Races in Wildwood, Florida (FL) Detailed Stats
Data:
Races - White alone (%)
Races - White alone (% change since 2000)
Races - Black alone (%)
Races - Black alone (% change since 2000)
Races - American Indian alone (%)
Races - American Indian alone (% change since 2000)
Races - Asian alone (%)
Races - Asian alone (% change since 2000)
Races - Hispanic (%)
Races - Hispanic (% change since 2000)
Races - Native Hawaiian and Other Pacific Islander alone (%)
Races - Native Hawaiian and Other Pacific Islander alone (% change since 2000)
Races - Two or more races(%)
Races - Two or more races(% change since 2000)
Races - Other race alone (%)
Races - Other race alone (% change since 2000)
Racial diversity
Place of birth - Born in state of residence (%)
Place of birth - Born in state of residence (%) - White
Place of birth - Born in state of residence (%) - Black or African American
Place of birth - Born in state of residence (%) - Asian
Place of birth - Born in state of residence (%) - Hispanic or Latino
Place of birth - Born in state of residence (%) - American Indian and Alaska Native
Place of birth - Born in state of residence (%) - Multirace
Place of birth - Born in state of residence (%) - Other Race
Place of birth - Born in other state (%)
Place of birth - Born in other state (%) - White
Place of birth - Born in other state (%) - Black or African American
Place of birth - Born in other state (%) - Asian
Place of birth - Born in other state (%) - Hispanic or Latino
Place of birth - Born in other state (%) - American Indian and Alaska Native
Place of birth - Born in other state (%) - Multirace
Place of birth - Born in other state (%) - Other Race
Place of birth - Native, outside of US (%)
Place of birth - Native, outside of US (%) - White
Place of birth - Native, outside of US (%) - Black or African American
Place of birth - Native, outside of US (%) - Asian
Place of birth - Native, outside of US (%) - Hispanic or Latino
Place of birth - Native, outside of US (%) - American Indian and Alaska Native
Place of birth - Native, outside of US (%) - Multirace
Place of birth - Native, outside of US (%) - Other Race
Place of birth - Foreign born (%)
Place of birth - Foreign born (%) - White
Place of birth - Foreign born (%) - Black or African American
Place of birth - Foreign born (%) - Asian
Place of birth - Foreign born (%) - Hispanic or Latino
Place of birth - Foreign born (%) - American Indian and Alaska Native
Place of birth - Foreign born (%) - Multirace
Place of birth - Foreign born (%) - Other Race
Residents speaking English at home (%)
Residents speaking English at home - Born in the United States (%)
Residents speaking English at home - Native, born elsewhere (%)
Residents speaking English at home - Foreign born (%)
Residents speaking Spanish at home (%)
Residents speaking Spanish at home - Born in the United States (%)
Residents speaking Spanish at home - Native, born elsewhere (%)
Residents speaking Spanish at home - Foreign born (%)
Residents speaking other language at home (%)
Residents speaking other language at home - Born in the United States (%)
Residents speaking other language at home - Native, born elsewhere (%)
Residents speaking other language at home - Foreign born (%)
Marital status - Never married (%)
Marital status - Now married (%)
Marital status - Separated (%)
Marital status - Widowed (%)
Marital status - Divorced (%)
Ancestries Reported - Arab (%)
Ancestries Reported - Czech (%)
Ancestries Reported - Danish (%)
Ancestries Reported - Dutch (%)
Ancestries Reported - English (%)
Ancestries Reported - French (%)
Ancestries Reported - French Canadian (%)
Ancestries Reported - German (%)
Ancestries Reported - Greek (%)
Ancestries Reported - Hungarian (%)
Ancestries Reported - Irish (%)
Ancestries Reported - Italian (%)
Ancestries Reported - Lithuanian (%)
Ancestries Reported - Norwegian (%)
Ancestries Reported - Polish (%)
Ancestries Reported - Portuguese (%)
Ancestries Reported - Russian (%)
Ancestries Reported - Scotch-Irish (%)
Ancestries Reported - Scottish (%)
Ancestries Reported - Slovak (%)
Ancestries Reported - Subsaharan African (%)
Ancestries Reported - Swedish (%)
Ancestries Reported - Swiss (%)
Ancestries Reported - Ukrainian (%)
Ancestries Reported - United States (%)
Ancestries Reported - Welsh (%)
Ancestries Reported - West Indian (%)
Ancestries Reported - Other (%)
Geographical mobility - Same house 1 year ago (%)
Geographical mobility - Same house 1 year ago (%) - White
Geographical mobility - Same house 1 year ago (%) - Black or African American
Geographical mobility - Same house 1 year ago (%) - Asian
Geographical mobility - Same house 1 year ago (%) - Hispanic or Latino
Geographical mobility - Same house 1 year ago (%) - American Indian and Alaska Native
Geographical mobility - Same house 1 year ago (%) - Multirace
Geographical mobility - Same house 1 year ago (%) - Other Race
Geographical mobility - Moved within same county (%)
Geographical mobility - Moved within same county (%) - White
Geographical mobility - Moved within same county (%) - Black or African American
Geographical mobility - Moved within same county (%) - Asian
Geographical mobility - Moved within same county (%) - Hispanic or Latino
Geographical mobility - Moved within same county (%) - American Indian and Alaska Native
Geographical mobility - Moved within same county (%) - Multirace
Geographical mobility - Moved within same county (%) - Other Race
Geographical mobility - Moved from different county within same state (%)
Geographical mobility - Moved from different county within same state (%) - White
Geographical mobility - Moved from different county within same state (%) - Black or African American
Geographical mobility - Moved from different county within same state (%) - Asian
Geographical mobility - Moved from different county within same state (%) - Hispanic or Latino
Geographical mobility - Moved from different county within same state (%) - American Indian and Alaska Native
Geographical mobility - Moved from different county within same state (%) - Multirace
Geographical mobility - Moved from different county within same state (%) - Other Race
Geographical mobility - Moved from different state (%)
Geographical mobility - Moved from different state (%) - White
Geographical mobility - Moved from different state (%) - Black or African American
Geographical mobility - Moved from different state (%) - Asian
Geographical mobility - Moved from different state (%) - Hispanic or Latino
Geographical mobility - Moved from different state (%) - American Indian and Alaska Native
Geographical mobility - Moved from different state (%) - Multirace
Geographical mobility - Moved from different state (%) - Other Race
Geographical mobility - Moved from abroad (%)
Geographical mobility - Moved from abroad (%) - White
Geographical mobility - Moved from abroad (%) - Black or African American
Geographical mobility - Moved from abroad (%) - Asian
Geographical mobility - Moved from abroad (%) - Hispanic or Latino
Geographical mobility - Moved from abroad (%) - American Indian and Alaska Native
Geographical mobility - Moved from abroad (%) - Multirace
Geographical mobility - Moved from abroad (%) - Other Race
Place of birth for the foreign-born population - Ireland (%)
Place of birth for the foreign-born population - Denmark (%)
Place of birth for the foreign-born population - Norway (%)
Place of birth for the foreign-born population - Sweden (%)
Place of birth for the foreign-born population - United Kingdom (%)
Place of birth for the foreign-born population - England (%)
Place of birth for the foreign-born population - Scotland (%)
Place of birth for the foreign-born population - Other Northern Europe (%)
Place of birth for the foreign-born population - Austria (%)
Place of birth for the foreign-born population - Belgium (%)
Place of birth for the foreign-born population - France (%)
Place of birth for the foreign-born population - Germany (%)
Place of birth for the foreign-born population - Netherlands (%)
Place of birth for the foreign-born population - Switzerland (%)
Place of birth for the foreign-born population - Other Western Europe (%)
Place of birth for the foreign-born population - Greece (%)
Place of birth for the foreign-born population - Italy (%)
Place of birth for the foreign-born population - Portugal (%)
Place of birth for the foreign-born population - Spain (%)
Place of birth for the foreign-born population - Other Southern Europe (%)
Place of birth for the foreign-born population - Albania (%)
Place of birth for the foreign-born population - Belarus (%)
Place of birth for the foreign-born population - Bosnia and Herzegovina (%)
Place of birth for the foreign-born population - Bulgaria (%)
Place of birth for the foreign-born population - Croatia (%)
Place of birth for the foreign-born population - Czechoslovakia (%)
Place of birth for the foreign-born population - Hungary (%)
Place of birth for the foreign-born population - Latvia (%)
Place of birth for the foreign-born population - Lithuania (%)
Place of birth for the foreign-born population - North Macedonia (Macedonia) (%)
Place of birth for the foreign-born population - Moldova (%)
Place of birth for the foreign-born population - Poland (%)
Place of birth for the foreign-born population - Romania (%)
Place of birth for the foreign-born population - Russia (%)
Place of birth for the foreign-born population - Serbia (%)
Place of birth for the foreign-born population - Ukraine (%)
Place of birth for the foreign-born population - Other Eastern Europe (%)
Place of birth for the foreign-born population - China (%)
Place of birth for the foreign-born population - Hong Kong (%)
Place of birth for the foreign-born population - Taiwan (%)
Place of birth for the foreign-born population - Japan (%)
Place of birth for the foreign-born population - Korea (%)
Place of birth for the foreign-born population - Other Eastern Asia (%)
Place of birth for the foreign-born population - Afghanistan (%)
Place of birth for the foreign-born population - Bangladesh (%)
Place of birth for the foreign-born population - India (%)
Place of birth for the foreign-born population - Iran (%)
Place of birth for the foreign-born population - Kazakhstan (%)
Place of birth for the foreign-born population - Nepal (%)
Place of birth for the foreign-born population - Pakistan (%)
Place of birth for the foreign-born population - Sri Lanka (%)
Place of birth for the foreign-born population - Uzbekistan (%)
Place of birth for the foreign-born population - Other South Central Asia (%)
Place of birth for the foreign-born population - Burma (%)
Place of birth for the foreign-born population - Cambodia (%)
Place of birth for the foreign-born population - Indonesia (%)
Place of birth for the foreign-born population - Laos (%)
Place of birth for the foreign-born population - Malaysia (%)
Place of birth for the foreign-born population - Philippines (%)
Place of birth for the foreign-born population - Singapore (%)
Place of birth for the foreign-born population - Thailand (%)
Place of birth for the foreign-born population - Vietnam (%)
Place of birth for the foreign-born population - Other South Eastern Asia (%)
Place of birth for the foreign-born population - Armenia (%)
Place of birth for the foreign-born population - Iraq (%)
Place of birth for the foreign-born population - Israel (%)
Place of birth for the foreign-born population - Jordan (%)
Place of birth for the foreign-born population - Kuwait (%)
Place of birth for the foreign-born population - Lebanon (%)
Place of birth for the foreign-born population - Saudi Arabia (%)
Place of birth for the foreign-born population - Syria (%)
Place of birth for the foreign-born population - Turkey (%)
Place of birth for the foreign-born population - Yemen (%)
Place of birth for the foreign-born population - Other Western Asia (%)
Place of birth for the foreign-born population - Eritrea (%)
Place of birth for the foreign-born population - Ethiopia (%)
Place of birth for the foreign-born population - Kenya (%)
Place of birth for the foreign-born population - Somalia (%)
Place of birth for the foreign-born population - Uganda (%)
Place of birth for the foreign-born population - Zimbabwe (%)
Place of birth for the foreign-born population - Other Eastern Africa (%)
Place of birth for the foreign-born population - Cameroon (%)
Place of birth for the foreign-born population - Congo (%)
Place of birth for the foreign-born population - Democratic Republic of Congo (Zaire) (%)
Place of birth for the foreign-born population - Other Middle Africa (%)
Place of birth for the foreign-born population - Egypt (%)
Place of birth for the foreign-born population - Morocco (%)
Place of birth for the foreign-born population - Sudan (%)
Place of birth for the foreign-born population - Other Northern Africa (%)
Place of birth for the foreign-born population - South Africa (%)
Place of birth for the foreign-born population - Other Southern Africa (%)
Place of birth for the foreign-born population - Cabo Verde (%)
Place of birth for the foreign-born population - Ghana (%)
Place of birth for the foreign-born population - Liberia (%)
Place of birth for the foreign-born population - Nigeria (%)
Place of birth for the foreign-born population - Senegal (%)
Place of birth for the foreign-born population - Sierra Leone (%)
Place of birth for the foreign-born population - Other Western Africa (%)
Place of birth for the foreign-born population - Australia (%)
Place of birth for the foreign-born population - New Zealand (%)
Place of birth for the foreign-born population - Fiji (%)
Place of birth for the foreign-born population - Micronesia (%)
Place of birth for the foreign-born population - Bahamas (%)
Place of birth for the foreign-born population - Barbados (%)
Place of birth for the foreign-born population - Cuba (%)
Place of birth for the foreign-born population - Dominica (%)
Place of birth for the foreign-born population - Dominican Republic (%)
Place of birth for the foreign-born population - Grenada (%)
Place of birth for the foreign-born population - Haiti (%)
Place of birth for the foreign-born population - Jamaica (%)
Place of birth for the foreign-born population - St. Vincent and the Grenadines (%)
Place of birth for the foreign-born population - Trinidad and Tobago (%)
Place of birth for the foreign-born population - West Indies (%)
Place of birth for the foreign-born population - Other Caribbean (%)
Place of birth for the foreign-born population - Belize (%)
Place of birth for the foreign-born population - Costa Rica (%)
Place of birth for the foreign-born population - El Salvador (%)
Place of birth for the foreign-born population - Guatemala (%)
Place of birth for the foreign-born population - Honduras (%)
Place of birth for the foreign-born population - Mexico (%)
Place of birth for the foreign-born population - Nicaragua (%)
Place of birth for the foreign-born population - Panama (%)
Place of birth for the foreign-born population - Other Central America (%)
Place of birth for the foreign-born population - Argentina (%)
Place of birth for the foreign-born population - Bolivia (%)
Place of birth for the foreign-born population - Brazil (%)
Place of birth for the foreign-born population - Chile (%)
Place of birth for the foreign-born population - Colombia (%)
Place of birth for the foreign-born population - Ecuador (%)
Place of birth for the foreign-born population - Guyana (%)
Place of birth for the foreign-born population - Peru (%)
Place of birth for the foreign-born population - Uruguay (%)
Place of birth for the foreign-born population - Venezuela (%)
Place of birth for the foreign-born population - Other South America (%)
Place of birth for the foreign-born population - Canada (%)
Place of birth for the foreign-born population - Other Northern America (%)
Place of birth for the foreign-born population - Other (%)
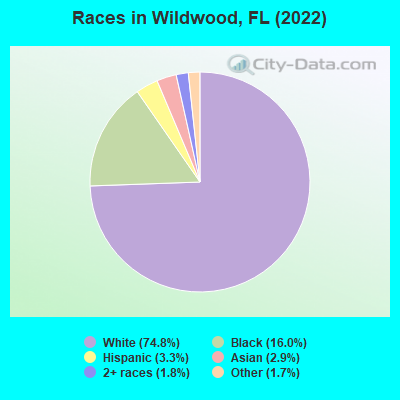
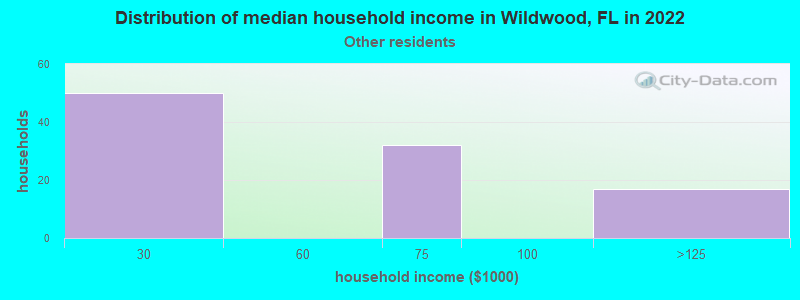
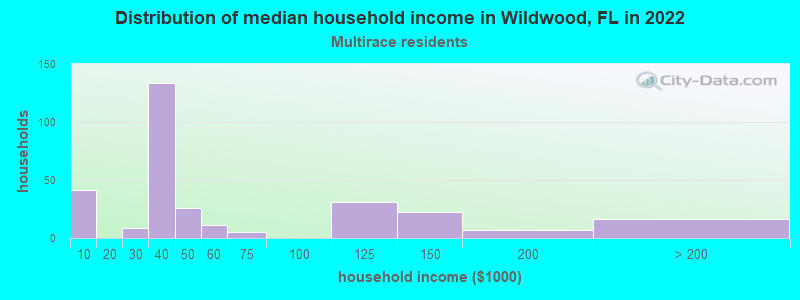
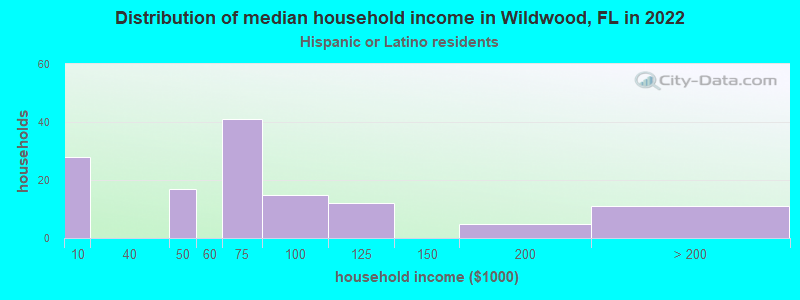
According to 2022 data, the most numerous races in Wildwood, FL are White alone (12,936 residents), Hispanic (576 residents), and Black alone (2,772 residents). 92.8% of Wildwood residents speak English at home. 7.7% of Wildwood, FL residents are foreign-born (5.7% born in Latin America, 1.6% born in Asia), which is 171.4% less than the foreign-born rate of 21.0% across the entire state of Florida.
Race distribution in Wildwood
2000 2022
10,458,509 65.4% White alone 2,682,715 16.8% Hispanic 2,264,268 14.2% Black alone 261,693 1.6% Asian alone 236,954 1.5% Two or more races 42,358 0.3% American Indian alone 28,994 0.2% Other race alone 6,887 0.04% Native Hawaiian and Other
11,309,403 50.8% White alone 6,025,039 27.1% Hispanic 3,241,015 14.6% Black alone 861,630 3.9% Two or more races 623,692 2.8% Asian alone 152,054 0.7% Other race alone 22,504 0.1% American Indian alone 9,486 0.04% Native Hawaiian and Other
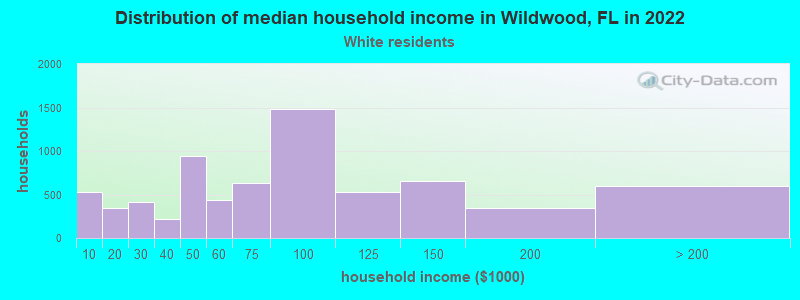
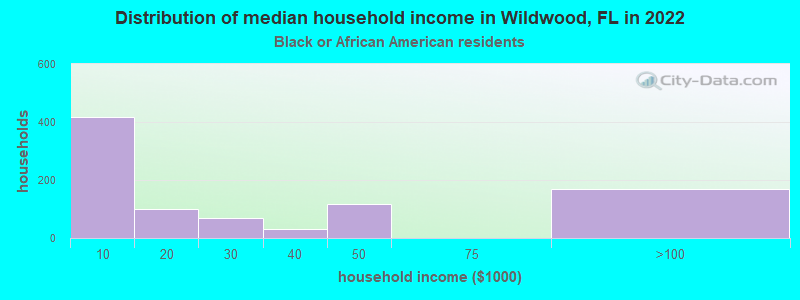
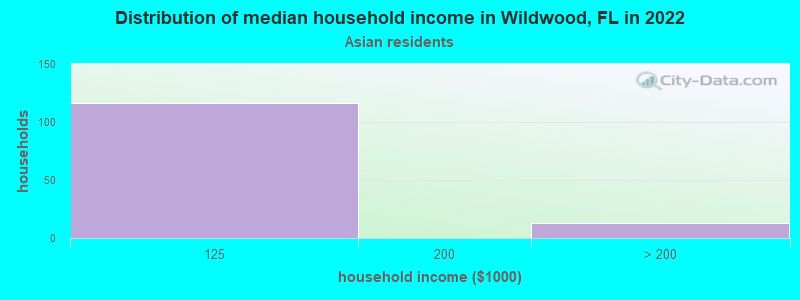
Income and house value in Wildwood Median household income in 2022 $77,037 White non-Hispanic householders$37,150 Two or more races householders$78,719 Hispanic or Latino race householdersMedian 2022 house value $786,131 White Non-Hispanic householders$852,091 Black or African American householders$874,975 Hispanic or Latino householders
Median age by race in Wildwood
64.7 Median age for White residents65.8 63.9 26.8 Median age for Black or African American residents28.8 22.4 -781,805,258.6 Median age for American Indian / Alaska Native residents-611,418,047.3 -594,925,633.7 52.3 Median age for Asian residents21.0 50.6 -666,666,666.0 Median age for Native Hawaiian / Pacific Islander residents-666,666,666.0 -666,666,666.0 20.1 Median age for Other race residents20.5 16.6 71.1 Median age for Two or more races residents63.1 71.4 64.7 Median age for White alone residents65.6 64.1 56.4 Median age for Hispanic or Latino residents69.6 28.5
Owner/renter occupied households by race in Wildwood
House owners and renters - White residents 4,881 74.1% Owner occupied1,708 25.9% Renter occupiedHouse owners and renters - Black or African American residents 346 34.8% Owner occupied646 65.2% Renter occupiedHouse owners and renters - Asian residents 137 100.0% Owner occupiedHouse owners and renters - Other race residents 112 70.6% Owner occupied47 29.4% Renter occupiedHouse owners and renters - Two or more races residents 188 78.8% Owner occupied50 21.2% Renter occupiedHouse owners and renters - White alone residents 4,862 73.7% Owner occupied1,731 26.3% Renter occupiedHouse owners and renters - Hispanic or Latino residents 148 83.0% Owner occupied30 17.0% Renter occupied
Language usage in Wildwood
English speakers - Total 92.8% of residents of Wildwood speak English at home.
3.5% of residents speak Spanish at home 544 93.0% Speak English very well41 7.0% Speak English less than very well4.2% of residents speak other language at home 468 66.0% Speak English very well241 34.0% Speak English less than very well
English speakers - Born in the United States 96.2% of residents of Wildwood speak English at home.
3.2% of residents speak Spanish at home 370 100.0% Speak English very well0.6% of residents speak other language at home 52 78.8% Speak English very well14 21.2% Speak English less than very well
All residents speak only English at home
English speakers - Foreign-born 55.9% of residents of Wildwood speak English at home.
13.4% of residents speak Spanish at home 114 72.6% Speak English very well43 27.4% Speak English less than very well22.7% of residents speak other language at home 197 74.1% Speak English very well69 25.9% Speak English less than very well
White (Caucasian) - Speak only English Native:
99.2% (12,430)Foreign-born:
51.6% (73)
White (Caucasian) - Speak another language Native:
1.1% (134)Foreign-born:
40.2% (57)
Black or African American - Speak only English Native:
97.6% (1,568)Foreign-born:
97.0% (517)
Asian - Speak another language Native:
86.0% (219)Foreign-born:
100.0% (266)
Two or more races - Speak only English Native:
81.3% (296)Foreign-born:
22.1% (49)
Two or more races - Speak another language Native:
16.1% (58)Foreign-born:
66.2% (147)
White alone - Speak only English Native:
98.3% (12,304)Foreign-born:
56.3% (75)
White alone - Speak another language Native:
1.6% (201)Foreign-born:
31.6% (42)
Hispanic or Latino - Speak another language Native:
43.6% (182)Foreign-born:
100.0% (139)
Foreign-born residents in Wildwood 1,339 residents are foreign born (5.7% Latin America , 1.6% Asia ).
This city:
7.7%Florida:
21.1%
Marital status for residents in Wildwood Marital status - White (Caucasian) population 15 years and over
Males 17.4% Never married68.0% Now married0.3% Separated5.0% Widowed9.3% DivorcedFemales 10.6% Never married50.2% Now married2.6% Separated11.9% Widowed24.6% DivorcedWomen who gave birth in the past 12 months Now married:
100.0% (102)Unmarried:
0.0% (0)
Women who did not give birth in the past 12 months Now married:
29.8% (362)Unmarried:
70.2% (855)
Marital status - Black or African American population 15 years and over
Males 24.1% Never married48.2% Now married0.0% Separated1.8% Widowed25.9% DivorcedFemales 32.0% Never married11.5% Now married32.9% Separated9.3% Widowed14.3% DivorcedWomen who did not give birth in the past 12 months Now married:
55.4% (309)Unmarried:
44.6% (248)
Marital status - Asian population 15 years and over
Males 0.0% Never married100.0% Now married0.0% Separated0.0% Widowed0.0% DivorcedFemales 42.2% Never married57.8% Now married0.0% Separated0.0% Widowed0.0% DivorcedWomen who did not give birth in the past 12 months Now married:
55.3% (124)Unmarried:
44.7% (100)
Marital status - Other race population 15 years and over
Males 52.9% Never married32.7% Now married0.0% Separated0.0% Widowed14.4% DivorcedFemales 61.5% Never married38.5% Now married0.0% Separated0.0% Widowed0.0% DivorcedWomen who did not give birth in the past 12 months Now married:
0.0% (0)Unmarried:
100.0% (115)
Marital status - Two or more races population 15 years and over
Males 44.3% Never married55.7% Now married0.0% Separated0.0% Widowed0.0% DivorcedFemales 7.5% Never married53.0% Now married0.0% Separated11.2% Widowed28.2% DivorcedWomen who did not give birth in the past 12 months Now married:
0.0% (0)Unmarried:
100.0% (39)
Marital status - White alone, not Hispanic / Latino population 15 years and over
Males 17.4% Never married67.9% Now married0.3% Separated5.0% Widowed9.3% DivorcedFemales 10.7% Never married49.9% Now married2.6% Separated12.1% Widowed24.7% DivorcedWomen who gave birth in the past 12 months Now married:
100.0% (110)Unmarried:
0.0% (0)
Women who did not give birth in the past 12 months Now married:
29.8% (393)Unmarried:
70.2% (928)
Marital status - Hispanic or Latino population 15 years and over
Males 22.5% Never married60.5% Now married0.0% Separated0.0% Widowed17.1% DivorcedFemales 30.7% Never married51.0% Now married0.0% Separated12.6% Widowed5.7% DivorcedWomen who did not give birth in the past 12 months Now married:
0.0% (0)Unmarried:
100.0% (83)
Ancestries in Wildwood
1,177 15.0% German878 11.2% Irish759 9.7% American739 9.4% English657 8.4% Bahamian568 7.2% Italian180 2.3% Polish165 2.1% Scottish111 1.4% French70 0.9% Swedish63 0.8% Portuguese52 0.7% Scotch-Irish47 0.6% Norwegian47 0.6% Scandinavian45 0.6% European44 0.6% Ukrainian36 0.5% Russian34 0.4% British29 0.4% Lithuanian29 0.4% Slovak26 0.3% Austrian25 0.3% Croatian25 0.3% French Canadian23 0.3% Finnish18 0.2% Greek18 0.2% Serbian16 0.2% Swiss15 0.2% Danish14 0.2% Hungarian11 0.1% Canadian11 0.1% Northern European8 0.1% Iranian8 0.1% Haitian
Geographical mobility in Wildwood Same house 1 year ago 9,332 72.6% White (Caucasian)1,807 75.5% Black or African American519 99.4% Asian398 100.0% Other race599 82.3% Two or more races9,311 72.4% White alone, not Hispanic / Latino481 92.1% Hispanic or LatinoMoved within same county 771 6.0% White / Caucasian416 17.4% Black or African American801 6.2% White alone, not Hispanic / LatinoMoved within same state 468 3.6% White / Caucasian85 3.6% Black or African American9 1.7% Asian21 2.9% Two or more races461 3.6% White alone, not Hispanic / LatinoMoved from different state 2,408 18.7% White / Caucasian110 15.2% Two or more races2,420 18.8% White alone, not Hispanic / Latino54 10.4% Hispanic or LatinoMoved from abroad 60 0.5% White18 0.8% Black or African American60 0.5% White alone, not Hispanic / Latino
Children Nativity (place of birth) in Wildwood
Children under 6 years - Living with two parents Both parents native 93 100.0% NativeChildren under 6 years - Living with one parent Native parent 353 98.6% Native5 1.4% Foreign-bornForeign-born parent 227 100.0% Foreign-bornChildren 6 to 17 years - Living with two parents Both parents native 572 100.0% NativeBoth parents foreign-born 238 100.0% NativeOne native, one foreign-born parent 19 100.0% NativeChildren 6 to 17 years - Living with one parent Native parent 332 52.8% Native296 47.2% Foreign-bornForeign-born parent 278 100.0% Native
Grandparents responsible for own grandchildren in Wildwood
Grandparents (30 to 59 years) White / Caucasian 51 100.0% Not responsible for grandchildrenWhite alone, not Hispanic / Latino 66 100.0% Not responsible for grandchildren
Grandparents (60 years and over)