Races in Wheaton, Maryland (MD) Detailed Stats
Data:
Races - White alone (%)
Races - White alone (% change since 2000)
Races - Black alone (%)
Races - Black alone (% change since 2000)
Races - American Indian alone (%)
Races - American Indian alone (% change since 2000)
Races - Asian alone (%)
Races - Asian alone (% change since 2000)
Races - Hispanic (%)
Races - Hispanic (% change since 2000)
Races - Native Hawaiian and Other Pacific Islander alone (%)
Races - Native Hawaiian and Other Pacific Islander alone (% change since 2000)
Races - Two or more races(%)
Races - Two or more races(% change since 2000)
Races - Other race alone (%)
Races - Other race alone (% change since 2000)
Racial diversity
Place of birth - Born in state of residence (%)
Place of birth - Born in state of residence (%) - White
Place of birth - Born in state of residence (%) - Black or African American
Place of birth - Born in state of residence (%) - Asian
Place of birth - Born in state of residence (%) - Hispanic or Latino
Place of birth - Born in state of residence (%) - American Indian and Alaska Native
Place of birth - Born in state of residence (%) - Multirace
Place of birth - Born in state of residence (%) - Other Race
Place of birth - Born in other state (%)
Place of birth - Born in other state (%) - White
Place of birth - Born in other state (%) - Black or African American
Place of birth - Born in other state (%) - Asian
Place of birth - Born in other state (%) - Hispanic or Latino
Place of birth - Born in other state (%) - American Indian and Alaska Native
Place of birth - Born in other state (%) - Multirace
Place of birth - Born in other state (%) - Other Race
Place of birth - Native, outside of US (%)
Place of birth - Native, outside of US (%) - White
Place of birth - Native, outside of US (%) - Black or African American
Place of birth - Native, outside of US (%) - Asian
Place of birth - Native, outside of US (%) - Hispanic or Latino
Place of birth - Native, outside of US (%) - American Indian and Alaska Native
Place of birth - Native, outside of US (%) - Multirace
Place of birth - Native, outside of US (%) - Other Race
Place of birth - Foreign born (%)
Place of birth - Foreign born (%) - White
Place of birth - Foreign born (%) - Black or African American
Place of birth - Foreign born (%) - Asian
Place of birth - Foreign born (%) - Hispanic or Latino
Place of birth - Foreign born (%) - American Indian and Alaska Native
Place of birth - Foreign born (%) - Multirace
Place of birth - Foreign born (%) - Other Race
Residents speaking English at home (%)
Residents speaking English at home - Born in the United States (%)
Residents speaking English at home - Native, born elsewhere (%)
Residents speaking English at home - Foreign born (%)
Residents speaking Spanish at home (%)
Residents speaking Spanish at home - Born in the United States (%)
Residents speaking Spanish at home - Native, born elsewhere (%)
Residents speaking Spanish at home - Foreign born (%)
Residents speaking other language at home (%)
Residents speaking other language at home - Born in the United States (%)
Residents speaking other language at home - Native, born elsewhere (%)
Residents speaking other language at home - Foreign born (%)
Marital status - Never married (%)
Marital status - Now married (%)
Marital status - Separated (%)
Marital status - Widowed (%)
Marital status - Divorced (%)
Ancestries Reported - Arab (%)
Ancestries Reported - Czech (%)
Ancestries Reported - Danish (%)
Ancestries Reported - Dutch (%)
Ancestries Reported - English (%)
Ancestries Reported - French (%)
Ancestries Reported - French Canadian (%)
Ancestries Reported - German (%)
Ancestries Reported - Greek (%)
Ancestries Reported - Hungarian (%)
Ancestries Reported - Irish (%)
Ancestries Reported - Italian (%)
Ancestries Reported - Lithuanian (%)
Ancestries Reported - Norwegian (%)
Ancestries Reported - Polish (%)
Ancestries Reported - Portuguese (%)
Ancestries Reported - Russian (%)
Ancestries Reported - Scotch-Irish (%)
Ancestries Reported - Scottish (%)
Ancestries Reported - Slovak (%)
Ancestries Reported - Subsaharan African (%)
Ancestries Reported - Swedish (%)
Ancestries Reported - Swiss (%)
Ancestries Reported - Ukrainian (%)
Ancestries Reported - United States (%)
Ancestries Reported - Welsh (%)
Ancestries Reported - West Indian (%)
Ancestries Reported - Other (%)
Geographical mobility - Same house 1 year ago (%)
Geographical mobility - Same house 1 year ago (%) - White
Geographical mobility - Same house 1 year ago (%) - Black or African American
Geographical mobility - Same house 1 year ago (%) - Asian
Geographical mobility - Same house 1 year ago (%) - Hispanic or Latino
Geographical mobility - Same house 1 year ago (%) - American Indian and Alaska Native
Geographical mobility - Same house 1 year ago (%) - Multirace
Geographical mobility - Same house 1 year ago (%) - Other Race
Geographical mobility - Moved within same county (%)
Geographical mobility - Moved within same county (%) - White
Geographical mobility - Moved within same county (%) - Black or African American
Geographical mobility - Moved within same county (%) - Asian
Geographical mobility - Moved within same county (%) - Hispanic or Latino
Geographical mobility - Moved within same county (%) - American Indian and Alaska Native
Geographical mobility - Moved within same county (%) - Multirace
Geographical mobility - Moved within same county (%) - Other Race
Geographical mobility - Moved from different county within same state (%)
Geographical mobility - Moved from different county within same state (%) - White
Geographical mobility - Moved from different county within same state (%) - Black or African American
Geographical mobility - Moved from different county within same state (%) - Asian
Geographical mobility - Moved from different county within same state (%) - Hispanic or Latino
Geographical mobility - Moved from different county within same state (%) - American Indian and Alaska Native
Geographical mobility - Moved from different county within same state (%) - Multirace
Geographical mobility - Moved from different county within same state (%) - Other Race
Geographical mobility - Moved from different state (%)
Geographical mobility - Moved from different state (%) - White
Geographical mobility - Moved from different state (%) - Black or African American
Geographical mobility - Moved from different state (%) - Asian
Geographical mobility - Moved from different state (%) - Hispanic or Latino
Geographical mobility - Moved from different state (%) - American Indian and Alaska Native
Geographical mobility - Moved from different state (%) - Multirace
Geographical mobility - Moved from different state (%) - Other Race
Geographical mobility - Moved from abroad (%)
Geographical mobility - Moved from abroad (%) - White
Geographical mobility - Moved from abroad (%) - Black or African American
Geographical mobility - Moved from abroad (%) - Asian
Geographical mobility - Moved from abroad (%) - Hispanic or Latino
Geographical mobility - Moved from abroad (%) - American Indian and Alaska Native
Geographical mobility - Moved from abroad (%) - Multirace
Geographical mobility - Moved from abroad (%) - Other Race
Place of birth for the foreign-born population - Ireland (%)
Place of birth for the foreign-born population - Denmark (%)
Place of birth for the foreign-born population - Norway (%)
Place of birth for the foreign-born population - Sweden (%)
Place of birth for the foreign-born population - United Kingdom (%)
Place of birth for the foreign-born population - England (%)
Place of birth for the foreign-born population - Scotland (%)
Place of birth for the foreign-born population - Other Northern Europe (%)
Place of birth for the foreign-born population - Austria (%)
Place of birth for the foreign-born population - Belgium (%)
Place of birth for the foreign-born population - France (%)
Place of birth for the foreign-born population - Germany (%)
Place of birth for the foreign-born population - Netherlands (%)
Place of birth for the foreign-born population - Switzerland (%)
Place of birth for the foreign-born population - Other Western Europe (%)
Place of birth for the foreign-born population - Greece (%)
Place of birth for the foreign-born population - Italy (%)
Place of birth for the foreign-born population - Portugal (%)
Place of birth for the foreign-born population - Spain (%)
Place of birth for the foreign-born population - Other Southern Europe (%)
Place of birth for the foreign-born population - Albania (%)
Place of birth for the foreign-born population - Belarus (%)
Place of birth for the foreign-born population - Bosnia and Herzegovina (%)
Place of birth for the foreign-born population - Bulgaria (%)
Place of birth for the foreign-born population - Croatia (%)
Place of birth for the foreign-born population - Czechoslovakia (%)
Place of birth for the foreign-born population - Hungary (%)
Place of birth for the foreign-born population - Latvia (%)
Place of birth for the foreign-born population - Lithuania (%)
Place of birth for the foreign-born population - North Macedonia (Macedonia) (%)
Place of birth for the foreign-born population - Moldova (%)
Place of birth for the foreign-born population - Poland (%)
Place of birth for the foreign-born population - Romania (%)
Place of birth for the foreign-born population - Russia (%)
Place of birth for the foreign-born population - Serbia (%)
Place of birth for the foreign-born population - Ukraine (%)
Place of birth for the foreign-born population - Other Eastern Europe (%)
Place of birth for the foreign-born population - China (%)
Place of birth for the foreign-born population - Hong Kong (%)
Place of birth for the foreign-born population - Taiwan (%)
Place of birth for the foreign-born population - Japan (%)
Place of birth for the foreign-born population - Korea (%)
Place of birth for the foreign-born population - Other Eastern Asia (%)
Place of birth for the foreign-born population - Afghanistan (%)
Place of birth for the foreign-born population - Bangladesh (%)
Place of birth for the foreign-born population - India (%)
Place of birth for the foreign-born population - Iran (%)
Place of birth for the foreign-born population - Kazakhstan (%)
Place of birth for the foreign-born population - Nepal (%)
Place of birth for the foreign-born population - Pakistan (%)
Place of birth for the foreign-born population - Sri Lanka (%)
Place of birth for the foreign-born population - Uzbekistan (%)
Place of birth for the foreign-born population - Other South Central Asia (%)
Place of birth for the foreign-born population - Burma (%)
Place of birth for the foreign-born population - Cambodia (%)
Place of birth for the foreign-born population - Indonesia (%)
Place of birth for the foreign-born population - Laos (%)
Place of birth for the foreign-born population - Malaysia (%)
Place of birth for the foreign-born population - Philippines (%)
Place of birth for the foreign-born population - Singapore (%)
Place of birth for the foreign-born population - Thailand (%)
Place of birth for the foreign-born population - Vietnam (%)
Place of birth for the foreign-born population - Other South Eastern Asia (%)
Place of birth for the foreign-born population - Armenia (%)
Place of birth for the foreign-born population - Iraq (%)
Place of birth for the foreign-born population - Israel (%)
Place of birth for the foreign-born population - Jordan (%)
Place of birth for the foreign-born population - Kuwait (%)
Place of birth for the foreign-born population - Lebanon (%)
Place of birth for the foreign-born population - Saudi Arabia (%)
Place of birth for the foreign-born population - Syria (%)
Place of birth for the foreign-born population - Turkey (%)
Place of birth for the foreign-born population - Yemen (%)
Place of birth for the foreign-born population - Other Western Asia (%)
Place of birth for the foreign-born population - Eritrea (%)
Place of birth for the foreign-born population - Ethiopia (%)
Place of birth for the foreign-born population - Kenya (%)
Place of birth for the foreign-born population - Somalia (%)
Place of birth for the foreign-born population - Uganda (%)
Place of birth for the foreign-born population - Zimbabwe (%)
Place of birth for the foreign-born population - Other Eastern Africa (%)
Place of birth for the foreign-born population - Cameroon (%)
Place of birth for the foreign-born population - Congo (%)
Place of birth for the foreign-born population - Democratic Republic of Congo (Zaire) (%)
Place of birth for the foreign-born population - Other Middle Africa (%)
Place of birth for the foreign-born population - Egypt (%)
Place of birth for the foreign-born population - Morocco (%)
Place of birth for the foreign-born population - Sudan (%)
Place of birth for the foreign-born population - Other Northern Africa (%)
Place of birth for the foreign-born population - South Africa (%)
Place of birth for the foreign-born population - Other Southern Africa (%)
Place of birth for the foreign-born population - Cabo Verde (%)
Place of birth for the foreign-born population - Ghana (%)
Place of birth for the foreign-born population - Liberia (%)
Place of birth for the foreign-born population - Nigeria (%)
Place of birth for the foreign-born population - Senegal (%)
Place of birth for the foreign-born population - Sierra Leone (%)
Place of birth for the foreign-born population - Other Western Africa (%)
Place of birth for the foreign-born population - Australia (%)
Place of birth for the foreign-born population - New Zealand (%)
Place of birth for the foreign-born population - Fiji (%)
Place of birth for the foreign-born population - Micronesia (%)
Place of birth for the foreign-born population - Bahamas (%)
Place of birth for the foreign-born population - Barbados (%)
Place of birth for the foreign-born population - Cuba (%)
Place of birth for the foreign-born population - Dominica (%)
Place of birth for the foreign-born population - Dominican Republic (%)
Place of birth for the foreign-born population - Grenada (%)
Place of birth for the foreign-born population - Haiti (%)
Place of birth for the foreign-born population - Jamaica (%)
Place of birth for the foreign-born population - St. Vincent and the Grenadines (%)
Place of birth for the foreign-born population - Trinidad and Tobago (%)
Place of birth for the foreign-born population - West Indies (%)
Place of birth for the foreign-born population - Other Caribbean (%)
Place of birth for the foreign-born population - Belize (%)
Place of birth for the foreign-born population - Costa Rica (%)
Place of birth for the foreign-born population - El Salvador (%)
Place of birth for the foreign-born population - Guatemala (%)
Place of birth for the foreign-born population - Honduras (%)
Place of birth for the foreign-born population - Mexico (%)
Place of birth for the foreign-born population - Nicaragua (%)
Place of birth for the foreign-born population - Panama (%)
Place of birth for the foreign-born population - Other Central America (%)
Place of birth for the foreign-born population - Argentina (%)
Place of birth for the foreign-born population - Bolivia (%)
Place of birth for the foreign-born population - Brazil (%)
Place of birth for the foreign-born population - Chile (%)
Place of birth for the foreign-born population - Colombia (%)
Place of birth for the foreign-born population - Ecuador (%)
Place of birth for the foreign-born population - Guyana (%)
Place of birth for the foreign-born population - Peru (%)
Place of birth for the foreign-born population - Uruguay (%)
Place of birth for the foreign-born population - Venezuela (%)
Place of birth for the foreign-born population - Other South America (%)
Place of birth for the foreign-born population - Canada (%)
Place of birth for the foreign-born population - Other Northern America (%)
Place of birth for the foreign-born population - Other (%)
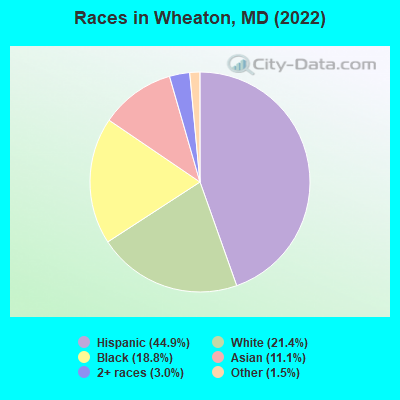
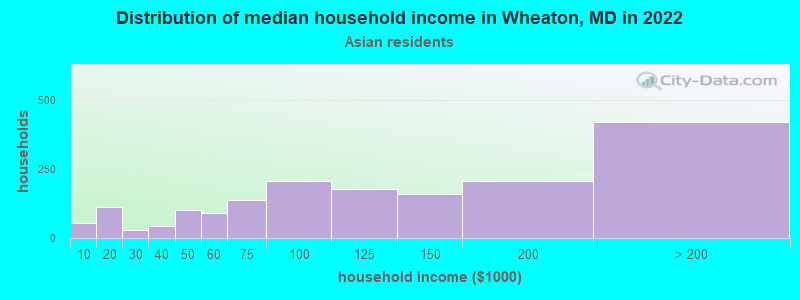
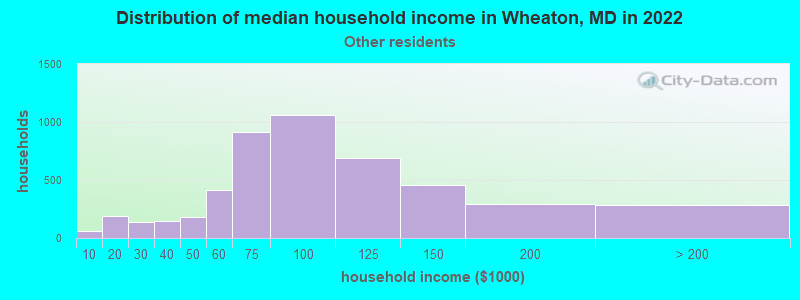
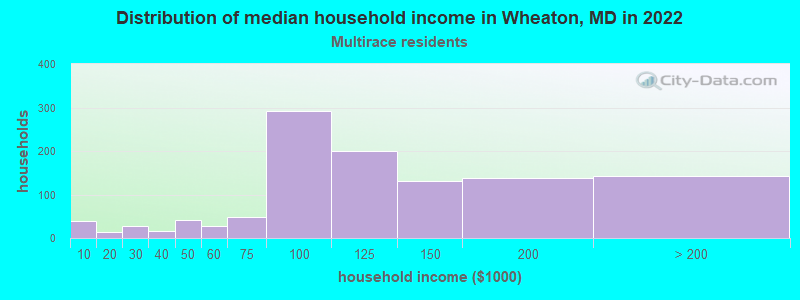
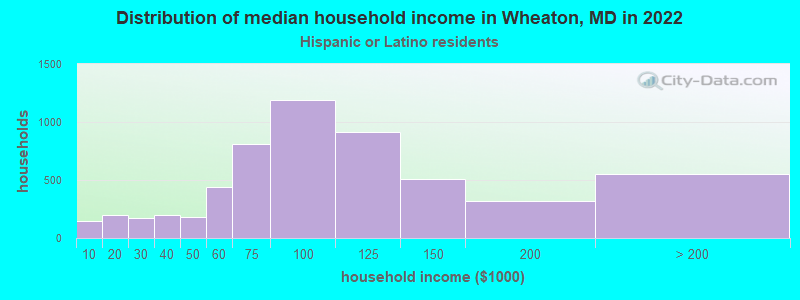
According to 2022 data, the most numerous races in Wheaton, MD are White alone (11,255 residents), Black alone (9,899 residents), and Hispanic (23,595 residents). 37.6% of Wheaton residents speak English at home.
Race distribution in Wheaton 23,595 44.9% Hispanic 11,255 21.4% White alone 9,899 18.8% Black alone 5,808 11.1% Asian alone 1,574 3.0% Two or more races 807 1.5% Other race alone 39 0.07% American Indian alone
2000 2022
3,286,547 62.1% White alone 1,464,735 27.7% Black alone 227,916 4.3% Hispanic 209,738 4.0% Asian alone 82,946 1.6% Two or more races 13,312 0.3% American Indian alone 9,379 0.2% Other race alone 1,913 0.04% Native Hawaiian and Other
2,906,492 47.1% White alone 1,800,914 29.2% Black alone 705,842 11.4% Hispanic 401,818 6.5% Asian alone 291,317 4.7% Two or more races 46,930 0.8% Other race alone 8,930 0.1% American Indian alone 2,417 0.04% Native Hawaiian and Other
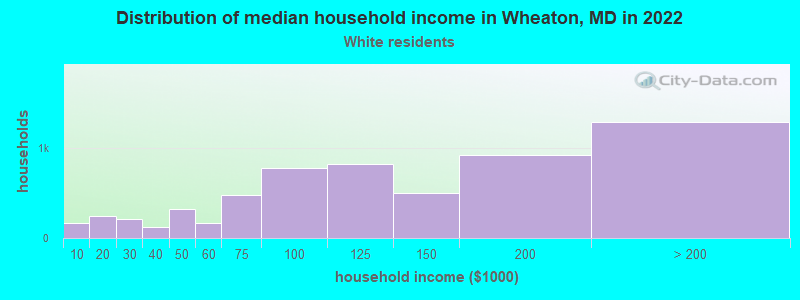
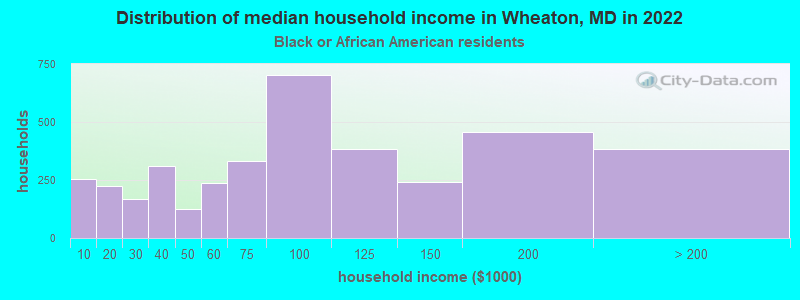
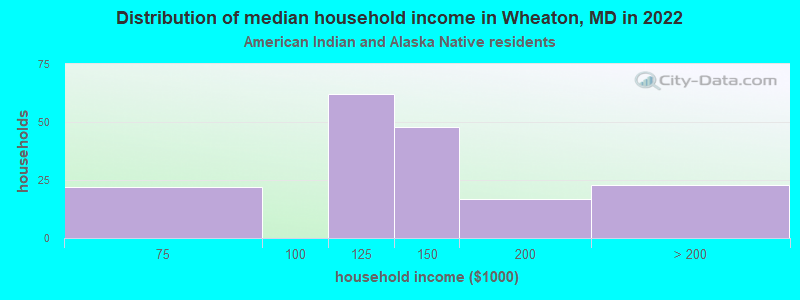
Income and house value in Wheaton Median household income in 2022 $114,027 White non-Hispanic householders$84,570 Black householders$121,471 American Indian and Alaska Native householders$105,120 Asian householders$82,449 Some other race householders$99,915 Two or more races householders$89,786 Hispanic or Latino race householders
Median age by race in Wheaton
43.1 Median age for White residents43.3 41.6 36.3 Median age for Black or African American residents36.4 36.1 43.8 Median age for American Indian / Alaska Native residents34.1 53.7 43.6 Median age for Asian residents37.5 50.7 -763,333,332.6 Median age for Native Hawaiian / Pacific Islander residents-720,061,021.4 -760,942,760.2 29.6 Median age for Other race residents31.8 27.4 34.6 Median age for Two or more races residents29.4 37.5 46.4 Median age for White alone residents48.2 44.4 31.4 Median age for Hispanic or Latino residents32.4 30.6
Owner/renter occupied households by race in Wheaton
House owners and renters - White residents 4,509 74.9% Owner occupied1,515 25.1% Renter occupiedHouse owners and renters - Black or African American residents 1,657 43.0% Owner occupied2,198 57.0% Renter occupiedHouse owners and renters - American Indian / Alaska Native residents 173 94.9% Owner occupied9 5.1% Renter occupiedHouse owners and renters - Asian residents 1,567 85.5% Owner occupied266 14.5% Renter occupiedHouse owners and renters - Native Hawaiian / Pacific Islander residents 13 100.0% Owner occupiedHouse owners and renters - Other race residents 2,756 59.1% Owner occupied1,906 40.9% Renter occupiedHouse owners and renters - Two or more races residents 619 53.4% Owner occupied541 46.6% Renter occupiedHouse owners and renters - White alone residents 4,042 75.9% Owner occupied1,281 24.1% Renter occupiedHouse owners and renters - Hispanic or Latino residents 3,231 58.3% Owner occupied2,315 41.7% Renter occupied
Language usage in Wheaton
English speakers - Total 37.6% of residents of Wheaton speak English at home.
40.1% of residents speak Spanish at home 11,381 57.6% Speak English very well8,380 42.4% Speak English less than very well22.5% of residents speak other language at home 7,101 64.0% Speak English very well4,000 36.0% Speak English less than very well
English speakers - Born in the United States 76.5% of residents of Wheaton speak English at home.
16.5% of residents speak Spanish at home 2,323 95.5% Speak English very well110 4.5% Speak English less than very well6.9% of residents speak other language at home 746 73.4% Speak English very well271 26.6% Speak English less than very well
English speakers - Native, born elsewhere 60.4% of residents of Wheaton speak English at home.
29.5% of residents speak Spanish at home 144 66.7% Speak English very well72 33.3% Speak English less than very well11.2% of residents speak other language at home 29 35.4% Speak English very well53 64.6% Speak English less than very well
English speakers - Foreign-born 7.1% of residents of Wheaton speak English at home.
55.5% of residents speak Spanish at home 4,722 36.9% Speak English very well8,084 63.1% Speak English less than very well37.4% of residents speak other language at home 5,097 59.0% Speak English very well3,547 41.0% Speak English less than very well
White (Caucasian) - Speak only English Native:
88.0% (9,553)Foreign-born:
15.0% (338)
White (Caucasian) - Speak another language Native:
10.7% (1,158)Foreign-born:
83.5% (1,885)
Black or African American - Speak only English Native:
80.1% (4,375)Foreign-born:
14.2% (605)
Black or African American - Speak another language Native:
20.6% (1,127)Foreign-born:
87.5% (3,718)
American Indian / Alaska Native - Speak only English Native:
21.1% (48)Foreign-born:
0.4% (1)
American Indian / Alaska Native - Speak another language Native:
100.0% (225)Foreign-born:
100.0% (279)
Asian - Speak only English Native:
35.0% (466)Foreign-born:
8.8% (383)
Asian - Speak another language Native:
67.4% (898)Foreign-born:
90.9% (3,978)
Other race - Speak only English Native:
13.5% (872)Foreign-born:
1.3% (153)
Other race - Speak another language Native:
83.7% (5,401)Foreign-born:
99.3% (11,972)
Two or more races - Speak only English Native:
63.0% (1,866)Foreign-born:
8.9% (129)
Two or more races - Speak another language Native:
37.3% (1,106)Foreign-born:
90.8% (1,322)
White alone - Speak only English Native:
93.3% (8,851)Foreign-born:
26.3% (314)
White alone - Speak another language Native:
6.7% (631)Foreign-born:
73.4% (878)
Hispanic or Latino - Speak only English Native:
22.8% (2,018)Foreign-born:
1.6% (207)
Hispanic or Latino - Speak another language Native:
76.4% (6,777)Foreign-born:
98.6% (12,806)
Foreign-born residents in Wheaton
Marital status for residents in Wheaton Marital status - White (Caucasian) population 15 years and over
Males 31.6% Never married59.4% Now married0.9% Separated2.1% Widowed6.0% DivorcedFemales 29.4% Never married50.8% Now married1.4% Separated7.3% Widowed11.1% DivorcedWomen who gave birth in the past 12 months Now married:
82.4% (259)Unmarried:
17.6% (56)
Women who did not give birth in the past 12 months Now married:
46.0% (1,227)Unmarried:
54.0% (1,439)
Marital status - Black or African American population 15 years and over
Males 52.3% Never married40.1% Now married1.2% Separated2.0% Widowed4.5% DivorcedFemales 48.1% Never married32.3% Now married3.5% Separated3.9% Widowed12.2% DivorcedWomen who gave birth in the past 12 months Now married:
41.5% (54)Unmarried:
58.5% (76)
Women who did not give birth in the past 12 months Now married:
29.6% (855)Unmarried:
70.4% (2,037)
Marital status - American Indian / Alaska Native population 15 years and over
Males 36.3% Never married63.7% Now married0.0% Separated0.0% Widowed0.0% DivorcedFemales 32.8% Never married43.5% Now married0.0% Separated0.0% Widowed23.7% DivorcedWomen who gave birth in the past 12 months Now married:
0.0% (0)Unmarried:
100.0% (61)
Women who did not give birth in the past 12 months Now married:
54.1% (30)Unmarried:
45.9% (25)
Marital status - Asian population 15 years and over
Males 40.1% Never married52.1% Now married0.0% Separated1.3% Widowed6.6% DivorcedFemales 22.0% Never married63.0% Now married0.6% Separated4.7% Widowed9.7% DivorcedWomen who gave birth in the past 12 months Now married:
100.0% (48)Unmarried:
0.0% (0)
Women who did not give birth in the past 12 months Now married:
62.9% (716)Unmarried:
37.1% (421)
Marital status - Native Hawaiian / Pacific Islander population 15 years and over
Males 100.0% Never married0.0% Now married0.0% Separated0.0% Widowed0.0% DivorcedFemales 0.0% Never married100.0% Now married0.0% Separated0.0% Widowed0.0% DivorcedMarital status - Other race population 15 years and over
Males 52.3% Never married39.4% Now married3.2% Separated0.3% Widowed4.9% DivorcedFemales 38.3% Never married49.5% Now married3.8% Separated3.7% Widowed4.7% DivorcedWomen who gave birth in the past 12 months Now married:
55.7% (211)Unmarried:
44.3% (168)
Women who did not give birth in the past 12 months Now married:
44.8% (1,908)Unmarried:
55.2% (2,352)
Marital status - Two or more races population 15 years and over
Males 50.5% Never married41.9% Now married0.0% Separated0.0% Widowed7.6% DivorcedFemales 47.6% Never married34.5% Now married3.2% Separated2.9% Widowed11.9% DivorcedWomen who gave birth in the past 12 months Now married:
100.0% (6)Unmarried:
0.0% (0)
Women who did not give birth in the past 12 months Now married:
34.1% (418)Unmarried:
65.9% (807)
Marital status - White alone, not Hispanic / Latino population 15 years and over
Males 28.3% Never married62.2% Now married0.2% Separated2.0% Widowed7.3% DivorcedFemales 26.1% Never married52.5% Now married1.2% Separated7.8% Widowed12.4% DivorcedWomen who gave birth in the past 12 months Now married:
100.0% (283)Unmarried:
0.0% (0)
Women who did not give birth in the past 12 months Now married:
45.4% (948)Unmarried:
54.6% (1,141)
Marital status - Hispanic or Latino population 15 years and over
Males 49.5% Never married42.5% Now married2.9% Separated0.6% Widowed4.5% DivorcedFemales 40.3% Never married47.5% Now married3.8% Separated3.9% Widowed4.5% DivorcedWomen who gave birth in the past 12 months Now married:
42.2% (176)Unmarried:
57.8% (241)
Women who did not give birth in the past 12 months Now married:
45.3% (2,247)Unmarried:
54.7% (2,714)
Ancestries in Wheaton
3,476 10.0% Ethiopian654 1.9% African614 1.8% English557 1.6% German475 1.4% Irish471 1.4% American381 1.1% Italian361 1.0% Ghanaian352 1.0% European350 1.0% Portuguese324 0.9% Jamaican292 0.8% Nigerian261 0.8% Kenyan220 0.6% Scandinavian177 0.5% Greek138 0.4% Zimbabwean120 0.3% Brazilian106 0.3% Russian96 0.3% Eastern European85 0.2% Haitian81 0.2% Scottish80 0.2% Turkish63 0.2% British61 0.2% Arab61 0.2% Polish59 0.2% Northern European55 0.2% Palestinian54 0.2% Swedish50 0.1% British West Indian46 0.1% Scotch-Irish43 0.1% Danish37 0.1% Slovene25 0.07% Finnish24 0.07% Albanian23 0.07% Czech23 0.07% French20 0.06% Icelander20 0.06% Iranian20 0.06% West Indian18 0.05% Lebanese18 0.05% French Canadian16 0.05% Ukrainian14 0.04% Dutch12 0.03% Bulgarian12 0.03% Bermudan11 0.03% Slovak11 0.03% Swiss11 0.03% Latvian6 0.02% Lithuanian6 0.02% Guyanese5 0.01% Canadian5 0.01% U.S. Virgin Islander
Geographical mobility in Wheaton Same house 1 year ago 12,006 88.0% White (Caucasian)9,208 90.1% Black or African American562 98.9% American Indian / Alaska Native5,389 93.7% Asian28 100.0% Native Hawaiian / Pacific Islander17,482 89.2% Other race4,105 86.9% Two or more races9,946 89.7% White alone, not Hispanic / Latino20,181 87.6% Hispanic or LatinoMoved within same county 485 3.6% White / Caucasian383 3.7% Black or African American152 2.6% Asian1,213 6.2% Other race226 4.8% Two or more races324 2.9% White alone, not Hispanic / Latino1,394 6.1% Hispanic or LatinoMoved within same state 228 1.7% White / Caucasian259 2.5% Black or African American15 0.3% Asian541 2.8% Other race20 0.4% Two or more races224 2.0% White alone, not Hispanic / Latino569 2.5% Hispanic or LatinoMoved from different state 848 6.2% White / Caucasian113 1.1% Black or African American71 1.2% Asian86 0.4% Other race137 2.9% Two or more races541 4.9% White alone, not Hispanic / Latino417 1.8% Hispanic or LatinoMoved from abroad 41 0.3% White489 4.8% Black or African American101 1.7% Asian258 1.3% Other race248 5.2% Two or more races27 0.2% White alone, not Hispanic / Latino432 1.9% Hispanic or Latino
Children Nativity (place of birth) in Wheaton
Children under 6 years - Living with two parents Both parents native 1,249 99.0% Native13 1.0% Foreign-bornBoth parents foreign-born 611 92.8% Native47 7.2% Foreign-bornOne native, one foreign-born parent 385 100.0% NativeChildren under 6 years - Living with one parent Native parent 340 100.0% NativeForeign-born parent 1,022 98.2% Native18 1.8% Foreign-bornChildren 6 to 17 years - Living with two parents Both parents native 1,359 97.4% Native36 2.6% Foreign-bornBoth parents foreign-born 2,160 85.6% Native363 14.4% Foreign-bornOne native, one foreign-born parent 507 100.0% NativeChildren 6 to 17 years - Living with one parent Native parent 919 100.0% NativeForeign-born parent 1,975 54.0% Native1,685 46.0% Foreign-born
Place of birth for residents in Wheaton 13,873 Americas13,851 Latin America9,967 Central America4,552 Asia3,835 Africa2,878 South America2,561 Eastern Africa2,378 South Eastern Asia1,172 South Central Asia1,006 Caribbean967 Europe907 Eastern Asia907 Western Africa753 China386 Northern Europe265 Southern Europe244 Middle Africa157 Eastern Europe156 Western Europe84 Western Asia39 Northern Africa21 Northern America4 Southern Africa7,027 El Salvador2,155 Ethiopia1,051 Guatemala928 Vietnam813 Philippines781 Nepal762 Honduras758 Peru712 Mexico585 China569 Colombia568 Dominican Republic476 Bolivia368 Jamaica366 Thailand296 Brazil283 Ecuador256 Venezuela249 Nicaragua246 Ghana221 Democratic Republic of Congo (Zaire)203 Eritrea189 India158 Portugal129 Korea126 Panama123 Nigeria106 Chile96 Germany92 Taiwan90 United Kingdom90 Zimbabwe90 Indonesia84 Burma (Myanmar)78 Kenya74 Hong Kong72 Greece63 Senegal61 Sri Lanka59 Bangladesh56 Cambodia50 Pakistan48 Romania48 France39 Malaysia39 Cabo Verde37 Costa Rica35 Sierra Leone34 Yemen31 Iran31 Turkey29 England25 Argentina25 Ireland24 Japan23 Russia22 Belarus21 Trinidad and Tobago21 Canada19 Liberia19 Italy18 Bosnia and Herzegovina16 Haiti16 Morocco14 Cuba14 Sweden14 Spain14 Algeria12 Ivory Coast12 Albania12 Grenada11 Poland11 Bulgaria10 Israel9 Netherlands8 Jordan8 Tanzania8 Uganda8 Congo8 Ukraine6 Guyana4 Bahamas4 South Africa
Grandparents responsible for own grandchildren in Wheaton
Grandparents (30 to 59 years) White / Caucasian 3 7.8% Responsible for grandchildren34 92.2% Not responsible for grandchildrenBlack or African American 3 19.2% Responsible for grandchildren11 80.8% Not responsible for grandchildrenAmerican Indian / Alaska Native 115 100.0% Not responsible for grandchildrenAsian 158 61.4% Responsible for grandchildren99 38.6% Not responsible for grandchildrenNative Hawaiian / Pacific Islander 11 100.0% Not responsible for grandchildrenOther race 167 42.1% Responsible for grandchildren229 57.9% Not responsible for grandchildrenTwo or more races 17 100.0% Not responsible for grandchildrenWhite alone, not Hispanic / Latino 5 100.0% Not responsible for grandchildrenHispanic or Latino 297 46.9% Responsible for grandchildren335 53.1% Not responsible for grandchildrenGrandparents (60 years and over) White / Caucasian 15 5.2% Responsible for grandchildren282 94.8% Not responsible for grandchildrenBlack or African American 111 75.1% Responsible for grandchildren37 24.9% Not responsible for grandchildrenAsian 32 55.5% Responsible for grandchildren26 44.5% Not responsible for grandchildrenOther race 150 24.6% Responsible for grandchildren459 75.4% Not responsible for grandchildrenTwo or more races 40 100.0% Not responsible for grandchildrenWhite alone, not Hispanic / Latino 214 100.0% Not responsible for grandchildrenHispanic or Latino 263 36.4% Responsible for grandchildren460 63.6% Not responsible for grandchildren