Races in Wharton, New Jersey (NJ) Detailed Stats
Data:
Races - White alone (%)
Races - White alone (% change since 2000)
Races - Black alone (%)
Races - Black alone (% change since 2000)
Races - American Indian alone (%)
Races - American Indian alone (% change since 2000)
Races - Asian alone (%)
Races - Asian alone (% change since 2000)
Races - Hispanic (%)
Races - Hispanic (% change since 2000)
Races - Native Hawaiian and Other Pacific Islander alone (%)
Races - Native Hawaiian and Other Pacific Islander alone (% change since 2000)
Races - Two or more races(%)
Races - Two or more races(% change since 2000)
Races - Other race alone (%)
Races - Other race alone (% change since 2000)
Racial diversity
Place of birth - Born in state of residence (%)
Place of birth - Born in state of residence (%) - White
Place of birth - Born in state of residence (%) - Black or African American
Place of birth - Born in state of residence (%) - Asian
Place of birth - Born in state of residence (%) - Hispanic or Latino
Place of birth - Born in state of residence (%) - American Indian and Alaska Native
Place of birth - Born in state of residence (%) - Multirace
Place of birth - Born in state of residence (%) - Other Race
Place of birth - Born in other state (%)
Place of birth - Born in other state (%) - White
Place of birth - Born in other state (%) - Black or African American
Place of birth - Born in other state (%) - Asian
Place of birth - Born in other state (%) - Hispanic or Latino
Place of birth - Born in other state (%) - American Indian and Alaska Native
Place of birth - Born in other state (%) - Multirace
Place of birth - Born in other state (%) - Other Race
Place of birth - Native, outside of US (%)
Place of birth - Native, outside of US (%) - White
Place of birth - Native, outside of US (%) - Black or African American
Place of birth - Native, outside of US (%) - Asian
Place of birth - Native, outside of US (%) - Hispanic or Latino
Place of birth - Native, outside of US (%) - American Indian and Alaska Native
Place of birth - Native, outside of US (%) - Multirace
Place of birth - Native, outside of US (%) - Other Race
Place of birth - Foreign born (%)
Place of birth - Foreign born (%) - White
Place of birth - Foreign born (%) - Black or African American
Place of birth - Foreign born (%) - Asian
Place of birth - Foreign born (%) - Hispanic or Latino
Place of birth - Foreign born (%) - American Indian and Alaska Native
Place of birth - Foreign born (%) - Multirace
Place of birth - Foreign born (%) - Other Race
Residents speaking English at home (%)
Residents speaking English at home - Born in the United States (%)
Residents speaking English at home - Native, born elsewhere (%)
Residents speaking English at home - Foreign born (%)
Residents speaking Spanish at home (%)
Residents speaking Spanish at home - Born in the United States (%)
Residents speaking Spanish at home - Native, born elsewhere (%)
Residents speaking Spanish at home - Foreign born (%)
Residents speaking other language at home (%)
Residents speaking other language at home - Born in the United States (%)
Residents speaking other language at home - Native, born elsewhere (%)
Residents speaking other language at home - Foreign born (%)
Marital status - Never married (%)
Marital status - Now married (%)
Marital status - Separated (%)
Marital status - Widowed (%)
Marital status - Divorced (%)
Ancestries Reported - Arab (%)
Ancestries Reported - Czech (%)
Ancestries Reported - Danish (%)
Ancestries Reported - Dutch (%)
Ancestries Reported - English (%)
Ancestries Reported - French (%)
Ancestries Reported - French Canadian (%)
Ancestries Reported - German (%)
Ancestries Reported - Greek (%)
Ancestries Reported - Hungarian (%)
Ancestries Reported - Irish (%)
Ancestries Reported - Italian (%)
Ancestries Reported - Lithuanian (%)
Ancestries Reported - Norwegian (%)
Ancestries Reported - Polish (%)
Ancestries Reported - Portuguese (%)
Ancestries Reported - Russian (%)
Ancestries Reported - Scotch-Irish (%)
Ancestries Reported - Scottish (%)
Ancestries Reported - Slovak (%)
Ancestries Reported - Subsaharan African (%)
Ancestries Reported - Swedish (%)
Ancestries Reported - Swiss (%)
Ancestries Reported - Ukrainian (%)
Ancestries Reported - United States (%)
Ancestries Reported - Welsh (%)
Ancestries Reported - West Indian (%)
Ancestries Reported - Other (%)
Geographical mobility - Same house 1 year ago (%)
Geographical mobility - Same house 1 year ago (%) - White
Geographical mobility - Same house 1 year ago (%) - Black or African American
Geographical mobility - Same house 1 year ago (%) - Asian
Geographical mobility - Same house 1 year ago (%) - Hispanic or Latino
Geographical mobility - Same house 1 year ago (%) - American Indian and Alaska Native
Geographical mobility - Same house 1 year ago (%) - Multirace
Geographical mobility - Same house 1 year ago (%) - Other Race
Geographical mobility - Moved within same county (%)
Geographical mobility - Moved within same county (%) - White
Geographical mobility - Moved within same county (%) - Black or African American
Geographical mobility - Moved within same county (%) - Asian
Geographical mobility - Moved within same county (%) - Hispanic or Latino
Geographical mobility - Moved within same county (%) - American Indian and Alaska Native
Geographical mobility - Moved within same county (%) - Multirace
Geographical mobility - Moved within same county (%) - Other Race
Geographical mobility - Moved from different county within same state (%)
Geographical mobility - Moved from different county within same state (%) - White
Geographical mobility - Moved from different county within same state (%) - Black or African American
Geographical mobility - Moved from different county within same state (%) - Asian
Geographical mobility - Moved from different county within same state (%) - Hispanic or Latino
Geographical mobility - Moved from different county within same state (%) - American Indian and Alaska Native
Geographical mobility - Moved from different county within same state (%) - Multirace
Geographical mobility - Moved from different county within same state (%) - Other Race
Geographical mobility - Moved from different state (%)
Geographical mobility - Moved from different state (%) - White
Geographical mobility - Moved from different state (%) - Black or African American
Geographical mobility - Moved from different state (%) - Asian
Geographical mobility - Moved from different state (%) - Hispanic or Latino
Geographical mobility - Moved from different state (%) - American Indian and Alaska Native
Geographical mobility - Moved from different state (%) - Multirace
Geographical mobility - Moved from different state (%) - Other Race
Geographical mobility - Moved from abroad (%)
Geographical mobility - Moved from abroad (%) - White
Geographical mobility - Moved from abroad (%) - Black or African American
Geographical mobility - Moved from abroad (%) - Asian
Geographical mobility - Moved from abroad (%) - Hispanic or Latino
Geographical mobility - Moved from abroad (%) - American Indian and Alaska Native
Geographical mobility - Moved from abroad (%) - Multirace
Geographical mobility - Moved from abroad (%) - Other Race
Place of birth for the foreign-born population - Ireland (%)
Place of birth for the foreign-born population - Denmark (%)
Place of birth for the foreign-born population - Norway (%)
Place of birth for the foreign-born population - Sweden (%)
Place of birth for the foreign-born population - United Kingdom (%)
Place of birth for the foreign-born population - England (%)
Place of birth for the foreign-born population - Scotland (%)
Place of birth for the foreign-born population - Other Northern Europe (%)
Place of birth for the foreign-born population - Austria (%)
Place of birth for the foreign-born population - Belgium (%)
Place of birth for the foreign-born population - France (%)
Place of birth for the foreign-born population - Germany (%)
Place of birth for the foreign-born population - Netherlands (%)
Place of birth for the foreign-born population - Switzerland (%)
Place of birth for the foreign-born population - Other Western Europe (%)
Place of birth for the foreign-born population - Greece (%)
Place of birth for the foreign-born population - Italy (%)
Place of birth for the foreign-born population - Portugal (%)
Place of birth for the foreign-born population - Spain (%)
Place of birth for the foreign-born population - Other Southern Europe (%)
Place of birth for the foreign-born population - Albania (%)
Place of birth for the foreign-born population - Belarus (%)
Place of birth for the foreign-born population - Bosnia and Herzegovina (%)
Place of birth for the foreign-born population - Bulgaria (%)
Place of birth for the foreign-born population - Croatia (%)
Place of birth for the foreign-born population - Czechoslovakia (%)
Place of birth for the foreign-born population - Hungary (%)
Place of birth for the foreign-born population - Latvia (%)
Place of birth for the foreign-born population - Lithuania (%)
Place of birth for the foreign-born population - North Macedonia (Macedonia) (%)
Place of birth for the foreign-born population - Moldova (%)
Place of birth for the foreign-born population - Poland (%)
Place of birth for the foreign-born population - Romania (%)
Place of birth for the foreign-born population - Russia (%)
Place of birth for the foreign-born population - Serbia (%)
Place of birth for the foreign-born population - Ukraine (%)
Place of birth for the foreign-born population - Other Eastern Europe (%)
Place of birth for the foreign-born population - China (%)
Place of birth for the foreign-born population - Hong Kong (%)
Place of birth for the foreign-born population - Taiwan (%)
Place of birth for the foreign-born population - Japan (%)
Place of birth for the foreign-born population - Korea (%)
Place of birth for the foreign-born population - Other Eastern Asia (%)
Place of birth for the foreign-born population - Afghanistan (%)
Place of birth for the foreign-born population - Bangladesh (%)
Place of birth for the foreign-born population - India (%)
Place of birth for the foreign-born population - Iran (%)
Place of birth for the foreign-born population - Kazakhstan (%)
Place of birth for the foreign-born population - Nepal (%)
Place of birth for the foreign-born population - Pakistan (%)
Place of birth for the foreign-born population - Sri Lanka (%)
Place of birth for the foreign-born population - Uzbekistan (%)
Place of birth for the foreign-born population - Other South Central Asia (%)
Place of birth for the foreign-born population - Burma (%)
Place of birth for the foreign-born population - Cambodia (%)
Place of birth for the foreign-born population - Indonesia (%)
Place of birth for the foreign-born population - Laos (%)
Place of birth for the foreign-born population - Malaysia (%)
Place of birth for the foreign-born population - Philippines (%)
Place of birth for the foreign-born population - Singapore (%)
Place of birth for the foreign-born population - Thailand (%)
Place of birth for the foreign-born population - Vietnam (%)
Place of birth for the foreign-born population - Other South Eastern Asia (%)
Place of birth for the foreign-born population - Armenia (%)
Place of birth for the foreign-born population - Iraq (%)
Place of birth for the foreign-born population - Israel (%)
Place of birth for the foreign-born population - Jordan (%)
Place of birth for the foreign-born population - Kuwait (%)
Place of birth for the foreign-born population - Lebanon (%)
Place of birth for the foreign-born population - Saudi Arabia (%)
Place of birth for the foreign-born population - Syria (%)
Place of birth for the foreign-born population - Turkey (%)
Place of birth for the foreign-born population - Yemen (%)
Place of birth for the foreign-born population - Other Western Asia (%)
Place of birth for the foreign-born population - Eritrea (%)
Place of birth for the foreign-born population - Ethiopia (%)
Place of birth for the foreign-born population - Kenya (%)
Place of birth for the foreign-born population - Somalia (%)
Place of birth for the foreign-born population - Uganda (%)
Place of birth for the foreign-born population - Zimbabwe (%)
Place of birth for the foreign-born population - Other Eastern Africa (%)
Place of birth for the foreign-born population - Cameroon (%)
Place of birth for the foreign-born population - Congo (%)
Place of birth for the foreign-born population - Democratic Republic of Congo (Zaire) (%)
Place of birth for the foreign-born population - Other Middle Africa (%)
Place of birth for the foreign-born population - Egypt (%)
Place of birth for the foreign-born population - Morocco (%)
Place of birth for the foreign-born population - Sudan (%)
Place of birth for the foreign-born population - Other Northern Africa (%)
Place of birth for the foreign-born population - South Africa (%)
Place of birth for the foreign-born population - Other Southern Africa (%)
Place of birth for the foreign-born population - Cabo Verde (%)
Place of birth for the foreign-born population - Ghana (%)
Place of birth for the foreign-born population - Liberia (%)
Place of birth for the foreign-born population - Nigeria (%)
Place of birth for the foreign-born population - Senegal (%)
Place of birth for the foreign-born population - Sierra Leone (%)
Place of birth for the foreign-born population - Other Western Africa (%)
Place of birth for the foreign-born population - Australia (%)
Place of birth for the foreign-born population - New Zealand (%)
Place of birth for the foreign-born population - Fiji (%)
Place of birth for the foreign-born population - Micronesia (%)
Place of birth for the foreign-born population - Bahamas (%)
Place of birth for the foreign-born population - Barbados (%)
Place of birth for the foreign-born population - Cuba (%)
Place of birth for the foreign-born population - Dominica (%)
Place of birth for the foreign-born population - Dominican Republic (%)
Place of birth for the foreign-born population - Grenada (%)
Place of birth for the foreign-born population - Haiti (%)
Place of birth for the foreign-born population - Jamaica (%)
Place of birth for the foreign-born population - St. Vincent and the Grenadines (%)
Place of birth for the foreign-born population - Trinidad and Tobago (%)
Place of birth for the foreign-born population - West Indies (%)
Place of birth for the foreign-born population - Other Caribbean (%)
Place of birth for the foreign-born population - Belize (%)
Place of birth for the foreign-born population - Costa Rica (%)
Place of birth for the foreign-born population - El Salvador (%)
Place of birth for the foreign-born population - Guatemala (%)
Place of birth for the foreign-born population - Honduras (%)
Place of birth for the foreign-born population - Mexico (%)
Place of birth for the foreign-born population - Nicaragua (%)
Place of birth for the foreign-born population - Panama (%)
Place of birth for the foreign-born population - Other Central America (%)
Place of birth for the foreign-born population - Argentina (%)
Place of birth for the foreign-born population - Bolivia (%)
Place of birth for the foreign-born population - Brazil (%)
Place of birth for the foreign-born population - Chile (%)
Place of birth for the foreign-born population - Colombia (%)
Place of birth for the foreign-born population - Ecuador (%)
Place of birth for the foreign-born population - Guyana (%)
Place of birth for the foreign-born population - Peru (%)
Place of birth for the foreign-born population - Uruguay (%)
Place of birth for the foreign-born population - Venezuela (%)
Place of birth for the foreign-born population - Other South America (%)
Place of birth for the foreign-born population - Canada (%)
Place of birth for the foreign-born population - Other Northern America (%)
Place of birth for the foreign-born population - Other (%)
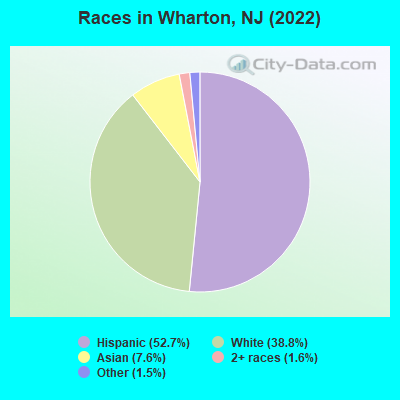
According to 2022 data, the most numerous races in Wharton, NJ are White alone (2,812 residents), Hispanic (3,821 residents), and Black alone (1 residents). 48.2% of Wharton residents speak English at home. 34.0% of Wharton, NJ residents are foreign-born (27.3% born in Latin America, 5.3% born in Asia), which is 32.3% greater than the foreign-born rate of 23.0% across the entire state of New Jersey.
Race distribution in Wharton
2000 2022
5,557,209 66.0% White alone 1,117,191 13.3% Hispanic 1,096,171 13.0% Black alone 477,012 5.7% Asian alone 133,689 1.6% Two or more races 19,565 0.2% Other race alone 11,338 0.1% American Indian alone 2,175 0.03% Native Hawaiian and Other
4,766,476 51.5% White alone 2,028,470 21.9% Hispanic 1,111,632 12.0% Black alone 923,546 10.0% Asian alone 332,237 3.6% Two or more races 89,847 1.0% Other race alone 8,557 0.09% American Indian alone 934 0.01% Native Hawaiian and Other
Income and house value in Wharton Median household income in 2022 $110,438 White non-Hispanic householders$85,696 Some other race householders$53,054 Two or more races householders$62,721 Hispanic or Latino race householdersMedian 2022 house value $325,442 White Non-Hispanic householders$488,263 Black or African American householders $258,516 Asian householders$326,241 Some other race householders$549,396 Two or more races householders$397,962 Hispanic or Latino householders
Median age by race in Wharton
40.8 Median age for White residents34.6 48.1 -695,431,471.4 Median age for Black or African American residents-735,135,134.4 -650,868,877.7 -847,710,329.3 Median age for American Indian / Alaska Native residents-707,246,376.1 -671,264,367.1 32.3 Median age for Asian residents36.2 2.8 -804,177,544.9 Median age for Native Hawaiian / Pacific Islander residents-666,666,666.0 -713,070,378.3 41.5 Median age for Other race residents37.9 39.8 46.8 Median age for Two or more races residents51.5 36.0 53.2 Median age for White alone residents51.7 54.7 33.0 Median age for Hispanic or Latino residents34.4 30.7
Owner/renter occupied households by race in Wharton
House owners and renters - White residents 983 55.4% Owner occupied793 44.6% Renter occupiedHouse owners and renters - Asian residents 76 61.1% Owner occupied48 38.9% Renter occupiedHouse owners and renters - Other race residents 331 72.4% Owner occupied126 27.6% Renter occupiedHouse owners and renters - Two or more races residents 387 53.7% Owner occupied333 46.3% Renter occupiedHouse owners and renters - White alone residents 979 60.7% Owner occupied634 39.3% Renter occupiedHouse owners and renters - Hispanic or Latino residents 523 49.9% Owner occupied526 50.1% Renter occupied
Language usage in Wharton
English speakers - Total 48.2% of residents of Wharton speak English at home.
44.4% of residents speak Spanish at home 1,666 57.0% Speak English very well1,257 43.0% Speak English less than very well5.6% of residents speak other language at home 349 93.8% Speak English very well23 6.2% Speak English less than very well
English speakers - Born in the United States 81.7% of residents of Wharton speak English at home.
20.2% of residents speak Spanish at home 171 100.0% Speak English very well
English speakers - Native, born elsewhere 77.5% of residents of Wharton speak English at home.
32.5% of residents speak Spanish at home 26 100.0% Speak English less than very well
English speakers - Foreign-born 6.8% of residents of Wharton speak English at home.
80.2% of residents speak Spanish at home 754 40.0% Speak English very well1,133 60.0% Speak English less than very well14.7% of residents speak other language at home 324 93.4% Speak English very well23 6.6% Speak English less than very well
White (Caucasian) - Speak only English Native:
81.0% (2,424)Foreign-born:
11.3% (42)
White (Caucasian) - Speak another language Native:
16.1% (483)Foreign-born:
83.3% (308)
Asian - Speak only English Native:
100.0% (18)Foreign-born:
10.1% (35)
Other race - Speak only English Native:
34.5% (275)Foreign-born:
12.4% (109)
Other race - Speak another language Native:
65.1% (518)Foreign-born:
87.9% (770)
Two or more races - Speak another language Native:
35.0% (181)Foreign-born:
97.9% (1,403)
White alone - Speak only English Native:
89.7% (2,240)Foreign-born:
31.1% (25)
White alone - Speak another language Native:
10.5% (262)Foreign-born:
69.1% (55)
Hispanic or Latino - Speak only English Native:
40.1% (623)Foreign-born:
3.8% (75)
Hispanic or Latino - Speak another language Native:
59.1% (919)Foreign-born:
94.8% (1,902)
Foreign-born residents in Wharton 2,462 residents are foreign born (27.3% Latin America , 5.3% Asia ).
This city:
34.0%New Jersey:
23.2%
Marital status for residents in Wharton Marital status - White (Caucasian) population 15 years and over
Males 49.6% Never married36.0% Now married0.0% Separated3.1% Widowed11.2% DivorcedFemales 30.3% Never married32.1% Now married0.9% Separated16.4% Widowed20.3% DivorcedWomen who gave birth in the past 12 months Now married:
0.0% (0)Unmarried:
100.0% (11)
Women who did not give birth in the past 12 months Now married:
22.0% (137)Unmarried:
78.0% (483)
Marital status - Asian population 15 years and over
Males 15.2% Never married72.6% Now married0.0% Separated0.0% Widowed12.1% DivorcedFemales 19.2% Never married61.6% Now married0.0% Separated19.2% Widowed0.0% DivorcedWomen who gave birth in the past 12 months Now married:
100.0% (71)Unmarried:
0.0% (0)
Women who did not give birth in the past 12 months Now married:
33.3% (15)Unmarried:
66.7% (30)
Marital status - Other race population 15 years and over
Males 47.2% Never married48.2% Now married0.0% Separated0.0% Widowed4.6% DivorcedFemales 49.8% Never married50.2% Now married0.0% Separated0.0% Widowed0.0% DivorcedWomen who gave birth in the past 12 months Now married:
100.0% (40)Unmarried:
0.0% (0)
Women who did not give birth in the past 12 months Now married:
32.8% (177)Unmarried:
67.2% (361)
Marital status - Two or more races population 15 years and over
Males 15.4% Never married61.4% Now married7.1% Separated0.0% Widowed16.0% DivorcedFemales 29.4% Never married34.2% Now married0.0% Separated15.7% Widowed20.8% DivorcedWomen who gave birth in the past 12 months Now married:
63.5% (146)Unmarried:
36.5% (84)
Women who did not give birth in the past 12 months Now married:
36.8% (79)Unmarried:
63.2% (135)
Marital status - White alone, not Hispanic / Latino population 15 years and over
Males 41.2% Never married43.9% Now married0.0% Separated4.5% Widowed10.5% DivorcedFemales 26.3% Never married34.1% Now married1.1% Separated19.8% Widowed18.6% DivorcedWomen who gave birth in the past 12 months Now married:
0.0% (0)Unmarried:
100.0% (11)
Women who did not give birth in the past 12 months Now married:
20.3% (84)Unmarried:
79.7% (329)
Marital status - Hispanic or Latino population 15 years and over
Males 43.3% Never married43.5% Now married2.3% Separated0.0% Widowed10.9% DivorcedFemales 43.7% Never married36.2% Now married0.0% Separated5.9% Widowed14.2% DivorcedWomen who gave birth in the past 12 months Now married:
69.0% (142)Unmarried:
31.0% (64)
Women who did not give birth in the past 12 months Now married:
31.1% (265)Unmarried:
68.9% (586)
Ancestries in Wharton
265 7.4% Italian168 4.7% Irish120 3.3% German101 2.8% American89 2.5% Polish47 1.3% Guyanese33 0.9% English11 0.3% French Canadian
Children Nativity (place of birth) in Wharton
Children under 6 years - Living with two parents Both parents native 84 100.0% NativeBoth parents foreign-born 344 100.0% NativeOne native, one foreign-born parent 14 100.0% NativeChildren under 6 years - Living with one parent Native parent 126 100.0% NativeForeign-born parent 100 100.0% NativeChildren 6 to 17 years - Living with two parents Both parents native 105 100.0% NativeBoth parents foreign-born 259 90.6% Native27 9.4% Foreign-bornOne native, one foreign-born parent 118 100.0% NativeChildren 6 to 17 years - Living with one parent Native parent 120 100.0% NativeForeign-born parent 282 50.3% Native279 49.7% Foreign-born
Grandparents responsible for own grandchildren in Wharton
Grandparents (30 to 59 years) White / Caucasian 19 100.0% Not responsible for grandchildrenAmerican Indian / Alaska Native 40 100.0% Not responsible for grandchildrenAsian 27 100.0% Responsible for grandchildrenOther race 121 100.0% Not responsible for grandchildrenTwo or more races 135 64.9% Responsible for grandchildren73 35.1% Not responsible for grandchildrenWhite alone, not Hispanic / Latino 21 100.0% Not responsible for grandchildrenHispanic or Latino 92 37.1% Responsible for grandchildren156 62.9% Not responsible for grandchildrenGrandparents (60 years and over) White / Caucasian 51 74.3% Responsible for grandchildren18 25.7% Not responsible for grandchildrenWhite alone, not Hispanic / Latino 59 100.0% Responsible for grandchildrenHispanic or Latino 31 100.0% Not responsible for grandchildren