Races in Wethersfield, Connecticut (CT) Detailed Stats
Data:
Races - White alone (%)
Races - White alone (% change since 2000)
Races - Black alone (%)
Races - Black alone (% change since 2000)
Races - American Indian alone (%)
Races - American Indian alone (% change since 2000)
Races - Asian alone (%)
Races - Asian alone (% change since 2000)
Races - Hispanic (%)
Races - Hispanic (% change since 2000)
Races - Native Hawaiian and Other Pacific Islander alone (%)
Races - Native Hawaiian and Other Pacific Islander alone (% change since 2000)
Races - Two or more races(%)
Races - Two or more races(% change since 2000)
Races - Other race alone (%)
Races - Other race alone (% change since 2000)
Racial diversity
Place of birth - Born in state of residence (%)
Place of birth - Born in state of residence (%) - White
Place of birth - Born in state of residence (%) - Black or African American
Place of birth - Born in state of residence (%) - Asian
Place of birth - Born in state of residence (%) - Hispanic or Latino
Place of birth - Born in state of residence (%) - American Indian and Alaska Native
Place of birth - Born in state of residence (%) - Multirace
Place of birth - Born in state of residence (%) - Other Race
Place of birth - Born in other state (%)
Place of birth - Born in other state (%) - White
Place of birth - Born in other state (%) - Black or African American
Place of birth - Born in other state (%) - Asian
Place of birth - Born in other state (%) - Hispanic or Latino
Place of birth - Born in other state (%) - American Indian and Alaska Native
Place of birth - Born in other state (%) - Multirace
Place of birth - Born in other state (%) - Other Race
Place of birth - Native, outside of US (%)
Place of birth - Native, outside of US (%) - White
Place of birth - Native, outside of US (%) - Black or African American
Place of birth - Native, outside of US (%) - Asian
Place of birth - Native, outside of US (%) - Hispanic or Latino
Place of birth - Native, outside of US (%) - American Indian and Alaska Native
Place of birth - Native, outside of US (%) - Multirace
Place of birth - Native, outside of US (%) - Other Race
Place of birth - Foreign born (%)
Place of birth - Foreign born (%) - White
Place of birth - Foreign born (%) - Black or African American
Place of birth - Foreign born (%) - Asian
Place of birth - Foreign born (%) - Hispanic or Latino
Place of birth - Foreign born (%) - American Indian and Alaska Native
Place of birth - Foreign born (%) - Multirace
Place of birth - Foreign born (%) - Other Race
Residents speaking English at home (%)
Residents speaking English at home - Born in the United States (%)
Residents speaking English at home - Native, born elsewhere (%)
Residents speaking English at home - Foreign born (%)
Residents speaking Spanish at home (%)
Residents speaking Spanish at home - Born in the United States (%)
Residents speaking Spanish at home - Native, born elsewhere (%)
Residents speaking Spanish at home - Foreign born (%)
Residents speaking other language at home (%)
Residents speaking other language at home - Born in the United States (%)
Residents speaking other language at home - Native, born elsewhere (%)
Residents speaking other language at home - Foreign born (%)
Marital status - Never married (%)
Marital status - Now married (%)
Marital status - Separated (%)
Marital status - Widowed (%)
Marital status - Divorced (%)
Ancestries Reported - Arab (%)
Ancestries Reported - Czech (%)
Ancestries Reported - Danish (%)
Ancestries Reported - Dutch (%)
Ancestries Reported - English (%)
Ancestries Reported - French (%)
Ancestries Reported - French Canadian (%)
Ancestries Reported - German (%)
Ancestries Reported - Greek (%)
Ancestries Reported - Hungarian (%)
Ancestries Reported - Irish (%)
Ancestries Reported - Italian (%)
Ancestries Reported - Lithuanian (%)
Ancestries Reported - Norwegian (%)
Ancestries Reported - Polish (%)
Ancestries Reported - Portuguese (%)
Ancestries Reported - Russian (%)
Ancestries Reported - Scotch-Irish (%)
Ancestries Reported - Scottish (%)
Ancestries Reported - Slovak (%)
Ancestries Reported - Subsaharan African (%)
Ancestries Reported - Swedish (%)
Ancestries Reported - Swiss (%)
Ancestries Reported - Ukrainian (%)
Ancestries Reported - United States (%)
Ancestries Reported - Welsh (%)
Ancestries Reported - West Indian (%)
Ancestries Reported - Other (%)
Geographical mobility - Same house 1 year ago (%)
Geographical mobility - Same house 1 year ago (%) - White
Geographical mobility - Same house 1 year ago (%) - Black or African American
Geographical mobility - Same house 1 year ago (%) - Asian
Geographical mobility - Same house 1 year ago (%) - Hispanic or Latino
Geographical mobility - Same house 1 year ago (%) - American Indian and Alaska Native
Geographical mobility - Same house 1 year ago (%) - Multirace
Geographical mobility - Same house 1 year ago (%) - Other Race
Geographical mobility - Moved within same county (%)
Geographical mobility - Moved within same county (%) - White
Geographical mobility - Moved within same county (%) - Black or African American
Geographical mobility - Moved within same county (%) - Asian
Geographical mobility - Moved within same county (%) - Hispanic or Latino
Geographical mobility - Moved within same county (%) - American Indian and Alaska Native
Geographical mobility - Moved within same county (%) - Multirace
Geographical mobility - Moved within same county (%) - Other Race
Geographical mobility - Moved from different county within same state (%)
Geographical mobility - Moved from different county within same state (%) - White
Geographical mobility - Moved from different county within same state (%) - Black or African American
Geographical mobility - Moved from different county within same state (%) - Asian
Geographical mobility - Moved from different county within same state (%) - Hispanic or Latino
Geographical mobility - Moved from different county within same state (%) - American Indian and Alaska Native
Geographical mobility - Moved from different county within same state (%) - Multirace
Geographical mobility - Moved from different county within same state (%) - Other Race
Geographical mobility - Moved from different state (%)
Geographical mobility - Moved from different state (%) - White
Geographical mobility - Moved from different state (%) - Black or African American
Geographical mobility - Moved from different state (%) - Asian
Geographical mobility - Moved from different state (%) - Hispanic or Latino
Geographical mobility - Moved from different state (%) - American Indian and Alaska Native
Geographical mobility - Moved from different state (%) - Multirace
Geographical mobility - Moved from different state (%) - Other Race
Geographical mobility - Moved from abroad (%)
Geographical mobility - Moved from abroad (%) - White
Geographical mobility - Moved from abroad (%) - Black or African American
Geographical mobility - Moved from abroad (%) - Asian
Geographical mobility - Moved from abroad (%) - Hispanic or Latino
Geographical mobility - Moved from abroad (%) - American Indian and Alaska Native
Geographical mobility - Moved from abroad (%) - Multirace
Geographical mobility - Moved from abroad (%) - Other Race
Place of birth for the foreign-born population - Ireland (%)
Place of birth for the foreign-born population - Denmark (%)
Place of birth for the foreign-born population - Norway (%)
Place of birth for the foreign-born population - Sweden (%)
Place of birth for the foreign-born population - United Kingdom (%)
Place of birth for the foreign-born population - England (%)
Place of birth for the foreign-born population - Scotland (%)
Place of birth for the foreign-born population - Other Northern Europe (%)
Place of birth for the foreign-born population - Austria (%)
Place of birth for the foreign-born population - Belgium (%)
Place of birth for the foreign-born population - France (%)
Place of birth for the foreign-born population - Germany (%)
Place of birth for the foreign-born population - Netherlands (%)
Place of birth for the foreign-born population - Switzerland (%)
Place of birth for the foreign-born population - Other Western Europe (%)
Place of birth for the foreign-born population - Greece (%)
Place of birth for the foreign-born population - Italy (%)
Place of birth for the foreign-born population - Portugal (%)
Place of birth for the foreign-born population - Spain (%)
Place of birth for the foreign-born population - Other Southern Europe (%)
Place of birth for the foreign-born population - Albania (%)
Place of birth for the foreign-born population - Belarus (%)
Place of birth for the foreign-born population - Bosnia and Herzegovina (%)
Place of birth for the foreign-born population - Bulgaria (%)
Place of birth for the foreign-born population - Croatia (%)
Place of birth for the foreign-born population - Czechoslovakia (%)
Place of birth for the foreign-born population - Hungary (%)
Place of birth for the foreign-born population - Latvia (%)
Place of birth for the foreign-born population - Lithuania (%)
Place of birth for the foreign-born population - North Macedonia (Macedonia) (%)
Place of birth for the foreign-born population - Moldova (%)
Place of birth for the foreign-born population - Poland (%)
Place of birth for the foreign-born population - Romania (%)
Place of birth for the foreign-born population - Russia (%)
Place of birth for the foreign-born population - Serbia (%)
Place of birth for the foreign-born population - Ukraine (%)
Place of birth for the foreign-born population - Other Eastern Europe (%)
Place of birth for the foreign-born population - China (%)
Place of birth for the foreign-born population - Hong Kong (%)
Place of birth for the foreign-born population - Taiwan (%)
Place of birth for the foreign-born population - Japan (%)
Place of birth for the foreign-born population - Korea (%)
Place of birth for the foreign-born population - Other Eastern Asia (%)
Place of birth for the foreign-born population - Afghanistan (%)
Place of birth for the foreign-born population - Bangladesh (%)
Place of birth for the foreign-born population - India (%)
Place of birth for the foreign-born population - Iran (%)
Place of birth for the foreign-born population - Kazakhstan (%)
Place of birth for the foreign-born population - Nepal (%)
Place of birth for the foreign-born population - Pakistan (%)
Place of birth for the foreign-born population - Sri Lanka (%)
Place of birth for the foreign-born population - Uzbekistan (%)
Place of birth for the foreign-born population - Other South Central Asia (%)
Place of birth for the foreign-born population - Burma (%)
Place of birth for the foreign-born population - Cambodia (%)
Place of birth for the foreign-born population - Indonesia (%)
Place of birth for the foreign-born population - Laos (%)
Place of birth for the foreign-born population - Malaysia (%)
Place of birth for the foreign-born population - Philippines (%)
Place of birth for the foreign-born population - Singapore (%)
Place of birth for the foreign-born population - Thailand (%)
Place of birth for the foreign-born population - Vietnam (%)
Place of birth for the foreign-born population - Other South Eastern Asia (%)
Place of birth for the foreign-born population - Armenia (%)
Place of birth for the foreign-born population - Iraq (%)
Place of birth for the foreign-born population - Israel (%)
Place of birth for the foreign-born population - Jordan (%)
Place of birth for the foreign-born population - Kuwait (%)
Place of birth for the foreign-born population - Lebanon (%)
Place of birth for the foreign-born population - Saudi Arabia (%)
Place of birth for the foreign-born population - Syria (%)
Place of birth for the foreign-born population - Turkey (%)
Place of birth for the foreign-born population - Yemen (%)
Place of birth for the foreign-born population - Other Western Asia (%)
Place of birth for the foreign-born population - Eritrea (%)
Place of birth for the foreign-born population - Ethiopia (%)
Place of birth for the foreign-born population - Kenya (%)
Place of birth for the foreign-born population - Somalia (%)
Place of birth for the foreign-born population - Uganda (%)
Place of birth for the foreign-born population - Zimbabwe (%)
Place of birth for the foreign-born population - Other Eastern Africa (%)
Place of birth for the foreign-born population - Cameroon (%)
Place of birth for the foreign-born population - Congo (%)
Place of birth for the foreign-born population - Democratic Republic of Congo (Zaire) (%)
Place of birth for the foreign-born population - Other Middle Africa (%)
Place of birth for the foreign-born population - Egypt (%)
Place of birth for the foreign-born population - Morocco (%)
Place of birth for the foreign-born population - Sudan (%)
Place of birth for the foreign-born population - Other Northern Africa (%)
Place of birth for the foreign-born population - South Africa (%)
Place of birth for the foreign-born population - Other Southern Africa (%)
Place of birth for the foreign-born population - Cabo Verde (%)
Place of birth for the foreign-born population - Ghana (%)
Place of birth for the foreign-born population - Liberia (%)
Place of birth for the foreign-born population - Nigeria (%)
Place of birth for the foreign-born population - Senegal (%)
Place of birth for the foreign-born population - Sierra Leone (%)
Place of birth for the foreign-born population - Other Western Africa (%)
Place of birth for the foreign-born population - Australia (%)
Place of birth for the foreign-born population - New Zealand (%)
Place of birth for the foreign-born population - Fiji (%)
Place of birth for the foreign-born population - Micronesia (%)
Place of birth for the foreign-born population - Bahamas (%)
Place of birth for the foreign-born population - Barbados (%)
Place of birth for the foreign-born population - Cuba (%)
Place of birth for the foreign-born population - Dominica (%)
Place of birth for the foreign-born population - Dominican Republic (%)
Place of birth for the foreign-born population - Grenada (%)
Place of birth for the foreign-born population - Haiti (%)
Place of birth for the foreign-born population - Jamaica (%)
Place of birth for the foreign-born population - St. Vincent and the Grenadines (%)
Place of birth for the foreign-born population - Trinidad and Tobago (%)
Place of birth for the foreign-born population - West Indies (%)
Place of birth for the foreign-born population - Other Caribbean (%)
Place of birth for the foreign-born population - Belize (%)
Place of birth for the foreign-born population - Costa Rica (%)
Place of birth for the foreign-born population - El Salvador (%)
Place of birth for the foreign-born population - Guatemala (%)
Place of birth for the foreign-born population - Honduras (%)
Place of birth for the foreign-born population - Mexico (%)
Place of birth for the foreign-born population - Nicaragua (%)
Place of birth for the foreign-born population - Panama (%)
Place of birth for the foreign-born population - Other Central America (%)
Place of birth for the foreign-born population - Argentina (%)
Place of birth for the foreign-born population - Bolivia (%)
Place of birth for the foreign-born population - Brazil (%)
Place of birth for the foreign-born population - Chile (%)
Place of birth for the foreign-born population - Colombia (%)
Place of birth for the foreign-born population - Ecuador (%)
Place of birth for the foreign-born population - Guyana (%)
Place of birth for the foreign-born population - Peru (%)
Place of birth for the foreign-born population - Uruguay (%)
Place of birth for the foreign-born population - Venezuela (%)
Place of birth for the foreign-born population - Other South America (%)
Place of birth for the foreign-born population - Canada (%)
Place of birth for the foreign-born population - Other Northern America (%)
Place of birth for the foreign-born population - Other (%)
Latest news about races in Wethersfield, CT collected exclusively by city-data.com from local newspapers, TV, and radio stations
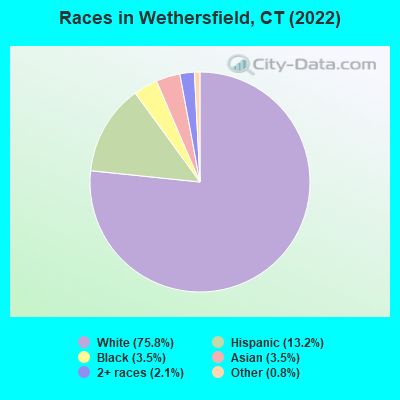
According to 2022 data, the most numerous races in Wethersfield, CT are White alone (20,702 residents), Hispanic (3,592 residents), and Black alone (944 residents). 78.4% of Wethersfield residents speak English at home. 13.7% of Wethersfield, CT residents are foreign-born (7.0% born in Europe, 2.9% born in Latin America, 2.4% born in Asia), which is 9.4% less than the foreign-born rate of 15.0% across the entire state of Connecticut.
Race distribution in Wethersfield
2000 2022
2,638,845 77.5% White alone 320,323 9.4% Hispanic 295,571 8.7% Black alone 81,564 2.4% Asian alone 52,896 1.6% Two or more races 8,141 0.2% Other race alone 7,267 0.2% American Indian alone 958 0.03% Native Hawaiian and Other
2,246,913 62.0% White alone 658,978 18.2% Hispanic 353,973 9.8% Black alone 172,929 4.8% Asian alone 159,631 4.4% Two or more races 29,761 0.8% Other race alone 3,428 0.09% American Indian alone 592 0.02% Native Hawaiian and Other
Income and house value in Wethersfield Median household income in 2022 $108,105 White non-Hispanic householders$141,847 Asian householders$104,263 Two or more races householders$102,024 Hispanic or Latino race householdersMedian 2022 house value $312,220 White Non-Hispanic householders$262,911 Black or African American householders$621,321 American Indian or Alaska Native householders $402,845 Asian householders$257,065 Some other race householders$255,311 Two or more races householders$262,132 Hispanic or Latino householders
Median age by race in Wethersfield
46.4 Median age for White residents45.3 48.6 45.2 Median age for Black or African American residents30.5 50.2 -742,173,111.6 Median age for American Indian / Alaska Native residents-701,030,927.1 -704,477,611.2 31.3 Median age for Asian residents35.7 25.2 -641,269,840.6 Median age for Native Hawaiian / Pacific Islander residents-414,239,481.8 -691,588,784.4 45.6 Median age for Other race residents42.7 47.2 28.3 Median age for Two or more races residents35.0 25.4 47.1 Median age for White alone residents44.9 49.4 34.2 Median age for Hispanic or Latino residents33.7 35.2
Owner/renter occupied households by race in Wethersfield
House owners and renters - White residents 7,864 84.5% Owner occupied1,447 15.5% Renter occupiedHouse owners and renters - Black or African American residents 261 47.5% Owner occupied288 52.5% Renter occupiedHouse owners and renters - American Indian / Alaska Native residents 12 100.0% Renter occupiedHouse owners and renters - Asian residents 255 75.0% Owner occupied85 25.0% Renter occupiedHouse owners and renters - Other race residents 284 60.2% Owner occupied188 39.8% Renter occupiedHouse owners and renters - Two or more races residents 489 68.9% Owner occupied220 31.1% Renter occupiedHouse owners and renters - White alone residents 7,768 84.3% Owner occupied1,444 15.7% Renter occupiedHouse owners and renters - Hispanic or Latino residents 753 60.7% Owner occupied487 39.3% Renter occupied
Language usage in Wethersfield
English speakers - Total 78.4% of residents of Wethersfield speak English at home.
7.5% of residents speak Spanish at home 1,428 73.8% Speak English very well506 26.2% Speak English less than very well13.9% of residents speak other language at home 2,353 65.4% Speak English very well1,246 34.6% Speak English less than very well
English speakers - Born in the United States 92.4% of residents of Wethersfield speak English at home.
2.0% of residents speak Spanish at home 51 53.1% Speak English very well45 46.9% Speak English less than very well4.6% of residents speak other language at home 178 82.0% Speak English very well39 18.0% Speak English less than very well
English speakers - Native, born elsewhere 23.3% of residents of Wethersfield speak English at home.
67.5% of residents speak Spanish at home 320 58.2% Speak English very well230 41.8% Speak English less than very well8.3% of residents speak other language at home 25 36.8% Speak English very well43 63.2% Speak English less than very well
English speakers - Foreign-born 20.8% of residents of Wethersfield speak English at home.
17.7% of residents speak Spanish at home 443 67.5% Speak English very well213 32.5% Speak English less than very well60.6% of residents speak other language at home 1,160 51.5% Speak English very well1,092 48.5% Speak English less than very well
White (Caucasian) - Speak only English Native:
93.6% (16,876)Foreign-born:
29.4% (493)
White (Caucasian) - Speak another language Native:
6.2% (1,119)Foreign-born:
70.3% (1,179)
Black or African American - Speak only English Native:
93.4% (838)Foreign-born:
25.5% (60)
Black or African American - Speak another language Native:
6.4% (57)Foreign-born:
64.5% (153)
Asian - Speak only English Native:
64.5% (142)Foreign-born:
6.7% (43)
Asian - Speak another language Native:
36.1% (79)Foreign-born:
93.8% (602)
Other race - Speak only English Native:
58.0% (681)Foreign-born:
16.3% (44)
Other race - Speak another language Native:
45.0% (528)Foreign-born:
81.8% (219)
Two or more races - Speak only English Native:
57.0% (869)Foreign-born:
9.3% (57)
Two or more races - Speak another language Native:
44.1% (672)Foreign-born:
90.8% (562)
White alone - Speak only English Native:
93.6% (16,692)Foreign-born:
28.0% (511)
White alone - Speak another language Native:
6.4% (1,144)Foreign-born:
71.8% (1,309)
Hispanic or Latino - Speak only English Native:
54.1% (1,445)Foreign-born:
3.5% (23)
Hispanic or Latino - Speak another language Native:
46.8% (1,250)Foreign-born:
97.0% (648)
Foreign-born residents in Wethersfield 3,743 residents are foreign born (7.0% Europe , 2.9% Latin America , 2.4% Asia ).
This city:
13.7%Connecticut:
15.0%
Marital status for residents in Wethersfield Marital status - White (Caucasian) population 15 years and over
Males 27.3% Never married61.8% Now married1.4% Separated2.6% Widowed6.8% DivorcedFemales 23.4% Never married54.5% Now married0.0% Separated7.9% Widowed14.2% DivorcedWomen who gave birth in the past 12 months Now married:
89.1% (105)Unmarried:
10.9% (13)
Women who did not give birth in the past 12 months Now married:
46.7% (1,872)Unmarried:
53.3% (2,133)
Marital status - Black or African American population 15 years and over
Males 60.0% Never married39.8% Now married0.0% Separated0.0% Widowed0.2% DivorcedFemales 44.8% Never married36.6% Now married0.0% Separated10.5% Widowed8.1% DivorcedWomen who did not give birth in the past 12 months Now married:
21.5% (61)Unmarried:
78.5% (221)
Marital status - Asian population 15 years and over
Males 24.7% Never married75.3% Now married0.0% Separated0.0% Widowed0.0% DivorcedFemales 22.8% Never married63.8% Now married0.0% Separated1.1% Widowed12.4% DivorcedWomen who gave birth in the past 12 months Now married:
100.0% (22)Unmarried:
0.0% (0)
Women who did not give birth in the past 12 months Now married:
59.7% (173)Unmarried:
40.3% (117)
Marital status - Other race population 15 years and over
Males 38.4% Never married61.6% Now married0.0% Separated0.0% Widowed0.0% DivorcedFemales 25.7% Never married50.7% Now married0.0% Separated7.7% Widowed15.9% DivorcedWomen who did not give birth in the past 12 months Now married:
43.5% (148)Unmarried:
56.5% (192)
Marital status - Two or more races population 15 years and over
Males 51.0% Never married33.1% Now married0.0% Separated0.0% Widowed15.9% DivorcedFemales 37.4% Never married37.4% Now married0.0% Separated6.6% Widowed18.5% DivorcedWomen who did not give birth in the past 12 months Now married:
44.8% (306)Unmarried:
55.2% (376)
Marital status - White alone, not Hispanic / Latino population 15 years and over
Males 27.2% Never married61.9% Now married1.4% Separated2.7% Widowed6.7% DivorcedFemales 23.3% Never married54.6% Now married0.0% Separated8.1% Widowed14.0% DivorcedWomen who gave birth in the past 12 months Now married:
89.1% (110)Unmarried:
10.9% (14)
Women who did not give birth in the past 12 months Now married:
46.4% (1,850)Unmarried:
53.6% (2,141)
Marital status - Hispanic or Latino population 15 years and over
Males 41.6% Never married50.3% Now married0.0% Separated0.0% Widowed8.1% DivorcedFemales 35.7% Never married43.9% Now married0.0% Separated2.3% Widowed18.1% DivorcedWomen who did not give birth in the past 12 months Now married:
43.1% (413)Unmarried:
56.9% (545)
Ancestries in Wethersfield
2,667 19.2% Italian1,113 8.0% Polish1,074 7.7% Irish632 4.6% Yugoslavian622 4.5% English593 4.3% American464 3.3% French Canadian396 2.9% Portuguese375 2.7% European316 2.3% French302 2.2% Albanian256 1.8% Greek254 1.8% German193 1.4% Afghan139 1.0% Guyanese112 0.8% Russian104 0.8% British98 0.7% Haitian89 0.6% Armenian77 0.6% Scottish73 0.5% Brazilian71 0.5% Eastern European70 0.5% Ukrainian52 0.4% Swedish48 0.3% Northern European41 0.3% Dutch40 0.3% Jamaican34 0.2% Norwegian33 0.2% Lithuanian27 0.2% Lebanese26 0.2% Hungarian22 0.2% Iranian20 0.1% Croatian15 0.1% Ghanaian13 0.09% Canadian13 0.09% Scandinavian9 0.06% Scotch-Irish8 0.06% African3 0.02% Romanian
Geographical mobility in Wethersfield Same house 1 year ago 19,342 93.8% White (Caucasian)1,104 96.0% Black or African American13 94.8% American Indian / Alaska Native564 61.0% Asian1,155 80.8% Other race1,897 81.7% Two or more races19,433 94.9% White alone, not Hispanic / Latino2,765 77.2% Hispanic or LatinoMoved within same county 693 3.4% White / Caucasian15 1.3% Black or African American55 5.9% Asian194 13.6% Other race369 15.9% Two or more races475 2.3% White alone, not Hispanic / Latino623 17.4% Hispanic or LatinoMoved within same state 220 1.1% White / Caucasian3 0.3% Black or African American210 1.0% White alone, not Hispanic / Latino20 0.6% Hispanic or LatinoMoved from different state 256 1.2% White / Caucasian15 1.3% Black or African American220 23.8% Asian38 2.7% Other race261 1.3% White alone, not Hispanic / Latino31 0.9% Hispanic or LatinoMoved from abroad 16 0.1% White142 15.4% Asian17 0.1% White alone, not Hispanic / Latino
Children Nativity (place of birth) in Wethersfield
Children under 6 years - Living with two parents Both parents native 1,202 100.0% NativeBoth parents foreign-born 161 82.3% Native35 17.7% Foreign-bornOne native, one foreign-born parent 81 100.0% NativeChildren under 6 years - Living with one parent Native parent 85 100.0% NativeForeign-born parent 31 100.0% NativeChildren 6 to 17 years - Living with two parents Both parents native 2,061 99.5% Native11 0.5% Foreign-bornBoth parents foreign-born 233 78.3% Native64 21.7% Foreign-bornOne native, one foreign-born parent 568 100.0% NativeChildren 6 to 17 years - Living with one parent Native parent 546 100.0% NativeForeign-born parent 97 50.8% Native94 49.2% Foreign-born
Grandparents responsible for own grandchildren in Wethersfield
Grandparents (30 to 59 years) White / Caucasian 10 49.5% Responsible for grandchildren10 50.5% Not responsible for grandchildrenAsian 44 100.0% Not responsible for grandchildrenWhite alone, not Hispanic / Latino 14 100.0% Not responsible for grandchildrenHispanic or Latino 14 100.0% Responsible for grandchildren
Grandparents (60 years and over) White / Caucasian 111 100.0% Not responsible for grandchildrenWhite alone, not Hispanic / Latino 117 100.0% Not responsible for grandchildrenHispanic or Latino 37 100.0% Not responsible for grandchildren