Races in Westwood, New Jersey (NJ) Detailed Stats
Ancestries, Foreign-born residents, place of birth
Settings
X


Recent posts about races in Westwood, New Jersey on our local forum with over 2,400,000 registered users:
 | Moving from greater Philly area suburb to Northern NJ (72 replies) |
| WESTWOOD Vs. HILLSDALE (3 replies) |
| Westwood NJ Flooding (6 replies) |
| Choosing between Park Ridge vs Montvale vs Hillsdale vs Westwood vs Washington Township vs Ramsey (2 replies) |
| Westwood Blvd, Westwood NJ (1 reply) |
| Opinions on Westwood Please (7 replies) |
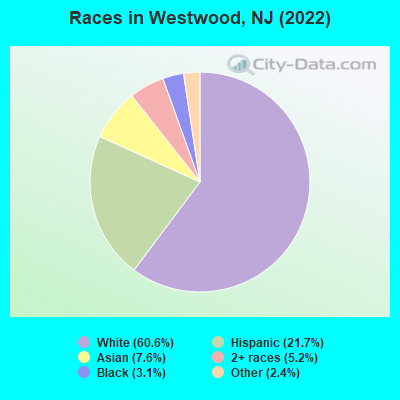
According to 2022 data, the most numerous races in Westwood, NJ are White alone (6,812 residents), Hispanic (2,442 residents), and Black alone (343 residents). 75.5% of Westwood residents speak English at home. 18.9% of Westwood, NJ residents are foreign-born (7.6% born in Latin America, 7.5% born in Asia, 2.5% born in Europe), which is 21.8% less than the foreign-born rate of 23.0% across the entire state of New Jersey.
Race distribution in Westwood
2000
2022

- 9,11182.8%White alone
- 6606.0%Hispanic
- 6245.7%Black alone
- 4824.4%Asian alone
- 910.8%Two or more races
- 200.2%Other race alone
- 100.09%American Indian alone
- 10.01%Native Hawaiian and Other
Pacific Islander alone

-
- 6,81260.6%White alone
- 2,44221.7%Hispanic
- 8547.6%Asian alone
- 5815.2%Two or more races
- 3433.1%Black alone
- 2742.4%Other race alone
- 70.06%American Indian alone
2000
2022
-
- 5,557,20966.0%White alone
- 1,117,19113.3%Hispanic
- 1,096,17113.0%Black alone
- 477,0125.7%Asian alone
- 133,6891.6%Two or more races
- 19,5650.2%Other race alone
- 11,3380.1%American Indian alone
- 2,1750.03%Native Hawaiian and Other
Pacific Islander alone

-
- 4,766,47651.5%White alone
- 2,028,47021.9%Hispanic
- 1,111,63212.0%Black alone
- 923,54610.0%Asian alone
- 332,2373.6%Two or more races
- 89,8471.0%Other race alone
- 8,5570.09%American Indian alone
- 9340.01%Native Hawaiian and Other
Pacific Islander alone

Income and house value in Westwood
- Median household income in 2022
- $138,925White non-Hispanic householders
- $196,630Black householders
- $153,501Asian householders
- $158,137Some other race householders
- $123,644Two or more races householders
- $151,207Hispanic or Latino race householders
- Median 2022 house value
- $556,847White Non-Hispanic householders
- $538,802Black or African American householders
- $514,973Asian householders
- $520,526Some other race householders
- $809,707Two or more races householders
- $538,339Hispanic or Latino householders
Household income for White non-Hispanic householders

Household income for Black householders

Household income for Asian householders

Household income for Some other race householders

Household income for Two or more races householders

Household income for Hispanic or Latino race householders

Median age by race in Westwood
- 47.4Median age for White residents
- 45.1Males
- 49.3Females
- 42.9Median age for Black or African American residents
- 24.3Males
- 48.2Females
- -766,197,182.3Median age for American Indian / Alaska Native residents
- -686,322,685.6Males
- -753,722,794.2Females
- 47.2Median age for Asian residents
- 43.2Males
- 76.0Females
- -510,460,250.5Median age for Native Hawaiian / Pacific Islander residents
- -514,767,932.0Males
- -713,070,378.3Females
- 41.2Median age for Other race residents
- 40.0Males
- 41.0Females
- 21.0Median age for Two or more races residents
- 15.6Males
- 20.9Females
- 48.0Median age for White alone residents
- 46.8Males
- 48.6Females
- 40.7Median age for Hispanic or Latino residents
- 40.4Males
- 41.4Females
Owner/renter occupied households by race in Westwood
- House owners and renters - White residents
- 2,07569.6%Owner occupied
- 90830.4%Renter occupied
- House owners and renters - Black or African American residents
- 11160.7%Owner occupied
- 7239.3%Renter occupied
- House owners and renters - American Indian / Alaska Native residents
- 9100.0%Owner occupied
- House owners and renters - Asian residents
- 29073.8%Owner occupied
- 10326.2%Renter occupied
- House owners and renters - Other race residents
- 4923.2%Owner occupied
- 16376.8%Renter occupied
- House owners and renters - Two or more races residents
- 21356.1%Owner occupied
- 16743.9%Renter occupied
- House owners and renters - White alone residents
- 1,93167.5%Owner occupied
- 93032.5%Renter occupied
- House owners and renters - Hispanic or Latino residents
- 43353.7%Owner occupied
- 37346.3%Renter occupied
Language usage in Westwood
- English speakers - Total
- 75.5% of residents of Westwood speak English at home.
- 14.8% of residents speak Spanish at home
- 1,01363.4%Speak English very well
- 58436.6%Speak English less than very well
- 8.9% of residents speak other language at home
- 79782.5%Speak English very well
- 16917.5%Speak English less than very well
- English speakers - Born in the United States
- 82.6% of residents of Westwood speak English at home.
- 11.4% of residents speak Spanish at home
- 372100.0%Speak English very well
- 5.5% of residents speak other language at home
- 178100.0%Speak English very well
- English speakers - Native, born elsewhere
- 47.4% of residents of Westwood speak English at home.
- 57.8% of residents speak Spanish at home
- 3146.3%Speak English very well
- 3653.7%Speak English less than very well
- English speakers - Foreign-born
- 36.7% of residents of Westwood speak English at home.
- 34.5% of residents speak Spanish at home
- 25434.7%Speak English very well
- 47765.3%Speak English less than very well
- 28.2% of residents speak other language at home
- 52888.4%Speak English very well
- 6911.6%Speak English less than very well
White (Caucasian) - Speak only English
| Native: | 94.2% (6,106) |
| Foreign-born: | 22.1% (109) |
White (Caucasian) - Speak another language
| Native: | 6.8% (443) |
| Foreign-born: | 78.0% (387) |
Black or African American - Speak only English
| Native: | 99.9% (332) |
| Foreign-born: | 100.0% (114) |
Asian - Speak only English
| Native: | 100.0% (99) |
| Foreign-born: | 66.5% (505) |
Other race - Speak another language
| Native: | 100.0% (374) |
| Foreign-born: | 99.5% (567) |
Two or more races - Speak another language
| Native: | 36.4% (471) |
| Foreign-born: | 100.0% (270) |
White alone - Speak only English
| Native: | 96.2% (6,009) |
| Foreign-born: | 17.5% (70) |
White alone - Speak another language
| Native: | 4.0% (252) |
| Foreign-born: | 82.7% (330) |
Hispanic or Latino - Speak only English
| Native: | 46.6% (681) |
| Foreign-born: | 7.2% (58) |
Hispanic or Latino - Speak another language
| Native: | 51.8% (757) |
| Foreign-born: | 92.5% (737) |
Foreign-born residents in Westwood
2,122 residents are foreign born (7.6% Latin America, 7.5% Asia, 2.5% Europe).
| This city: | 18.9% |
| New Jersey: | 23.2% |


Marital status for residents in Westwood
Marital status - White (Caucasian) population 15 years and over
- Males
- 30.5%Never married
- 57.1%Now married
- 3.0%Separated
- 1.1%Widowed
- 8.3%Divorced
- Females
- 28.1%Never married
- 46.3%Now married
- 0.0%Separated
- 12.8%Widowed
- 12.8%Divorced
Women who gave birth in the past 12 months
| Now married: | 100.0% (31) |
| Unmarried: | 0.0% (0) |
Women who did not give birth in the past 12 months
| Now married: | 35.1% (521) |
| Unmarried: | 64.9% (965) |
Marital status - Black or African American population 15 years and over
- Males
- 53.5%Never married
- 22.6%Now married
- 0.0%Separated
- 0.0%Widowed
- 24.0%Divorced
- Females
- 32.7%Never married
- 20.2%Now married
- 8.5%Separated
- 13.5%Widowed
- 25.1%Divorced
Women who did not give birth in the past 12 months
| Now married: | 26.8% (34) |
| Unmarried: | 73.2% (93) |
Marital status - Asian population 15 years and over
- Males
- 15.3%Never married
- 67.8%Now married
- 4.4%Separated
- 0.0%Widowed
- 12.6%Divorced
- Females
- 9.0%Never married
- 41.1%Now married
- 5.3%Separated
- 3.2%Widowed
- 41.4%Divorced
Women who did not give birth in the past 12 months
| Now married: | 79.4% (203) |
| Unmarried: | 20.6% (53) |
Marital status - Other race population 15 years and over
- Males
- 36.6%Never married
- 42.1%Now married
- 21.4%Separated
- 0.0%Widowed
- 0.0%Divorced
- Females
- 83.8%Never married
- 16.2%Now married
- 0.0%Separated
- 0.0%Widowed
- 0.0%Divorced
Women who did not give birth in the past 12 months
| Now married: | 16.2% (49) |
| Unmarried: | 83.8% (256) |
Marital status - Two or more races population 15 years and over
- Males
- 49.2%Never married
- 41.6%Now married
- 0.0%Separated
- 9.1%Widowed
- 0.0%Divorced
- Females
- 49.9%Never married
- 39.0%Now married
- 0.0%Separated
- 0.0%Widowed
- 11.1%Divorced
Women who did not give birth in the past 12 months
| Now married: | 14.3% (47) |
| Unmarried: | 85.7% (279) |
Marital status - White alone, not Hispanic / Latino population 15 years and over
- Males
- 30.1%Never married
- 59.9%Now married
- 0.0%Separated
- 1.3%Widowed
- 8.8%Divorced
- Females
- 28.0%Never married
- 46.0%Now married
- 0.0%Separated
- 13.9%Widowed
- 12.1%Divorced
Women who gave birth in the past 12 months
| Now married: | 100.0% (36) |
| Unmarried: | 0.0% (0) |
Women who did not give birth in the past 12 months
| Now married: | 34.7% (530) |
| Unmarried: | 65.3% (996) |
Marital status - Hispanic or Latino population 15 years and over
- Males
- 39.5%Never married
- 38.3%Now married
- 14.7%Separated
- 2.7%Widowed
- 4.8%Divorced
- Females
- 54.7%Never married
- 34.1%Now married
- 0.0%Separated
- 0.0%Widowed
- 11.2%Divorced
Women who did not give birth in the past 12 months
| Now married: | 18.2% (111) |
| Unmarried: | 81.8% (497) |
Ancestries in Westwood

- 84917.7%Italian
- 4188.7%Irish
- 2425.0%American
- 2425.0%German
- 1934.0%Kenyan
- 1252.6%Armenian
- 1232.6%Portuguese
- 1132.4%Dutch
- 1002.1%English
- 972.0%Polish
- 952.0%Croatian
- 711.5%European
- 380.8%Greek
- 340.7%Palestinian
- 280.6%Lebanese
- 250.5%Trinidadian and Tobagonian
- 240.5%Scotch-Irish
- 230.5%Slovak
- 200.4%Moroccan
- 120.3%Norwegian
- 120.3%Scottish
- 100.2%French Canadian
- 80.2%Lithuanian
- 70.1%Hungarian

Geographical mobility in Westwood

- Same house 1 year ago
- 6,36791.8%White (Caucasian)
- 40188.9%Black or African American
- 1096.6%American Indian / Alaska Native
- 85097.8%Asian
- 88493.6%Other race
- 1,60480.3%Two or more races
- 6,29492.7%White alone, not Hispanic / Latino
- 1,98981.5%Hispanic or Latino

-
- Moved within same county
- 4296.2%White / Caucasian
- 153.4%Black or African American
- 37718.9%Two or more races
- 3144.6%White alone, not Hispanic / Latino
- 46919.2%Hispanic or Latino

-
- Moved within same state
- 510.7%White / Caucasian
- 600.9%White alone, not Hispanic / Latino

-
- Moved from different state
- 1091.6%White / Caucasian
- 265.8%Black or African American
- 343.6%Other race
- 1201.8%White alone, not Hispanic / Latino
- 180.8%Hispanic or Latino

Children Nativity (place of birth) in Westwood
Place of birth for residents in Westwood
![Place of birth for the foreign-born population - Regions]()
- 893Americas
- 877Latin America
- 864Asia
- 526Central America
- 421South Eastern Asia
- 288Europe
- 199Caribbean
- 184Eastern Asia
- 150South America
- 149Southern Europe
- 143South Central Asia
- 114Western Asia
- 91Eastern Europe
- 75Africa
- 57Eastern Africa
- 29Western Europe
- 18Northern Africa
- 17Northern Europe
- 16Northern America

![Place of birth for the foreign-born population - Countries]()
- 421Philippines
- 295Mexico
- 182Korea
- 143India
- 131Nicaragua
- 90Dominican Republic
- 86Italy
- 74Syria
- 73Peru
- 67Panama
- 57Kenya
- 44Portugal
- 39Lebanon
- 33Trinidad and Tobago
- 32Costa Rica
- 29Germany
- 29Brazil
- 29Colombia
- 26Cuba
- 25Poland
- 19Greece
- 18Morocco
- 17Ireland
- 17Guyana
- 16Canada
- 14Russia
- 12Czechoslovakia
- 9Lithuania
- 2Japan

Grandparents responsible for own grandchildren in Westwood
Zip codes: 07675.