Races in Westmont, Illinois (IL) Detailed Stats
Data:
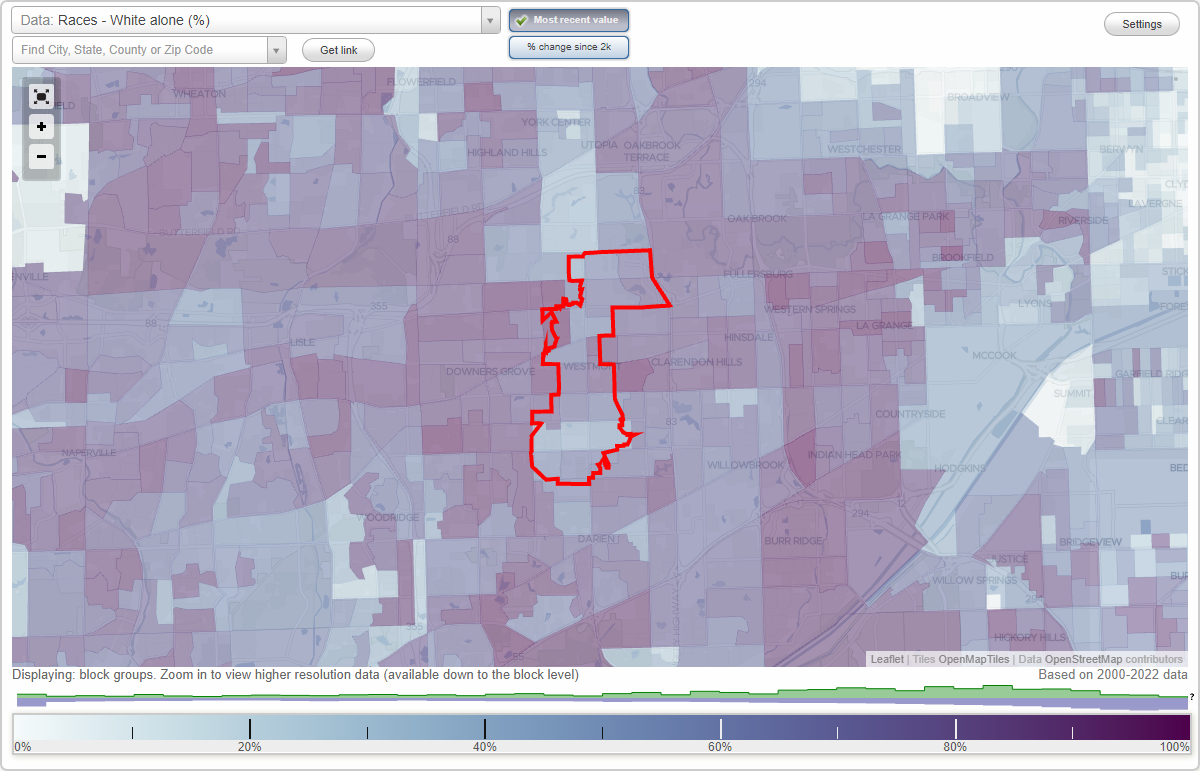
Races - White alone (%)
Races - White alone (% change since 2000)
Races - Black alone (%)
Races - Black alone (% change since 2000)
Races - American Indian alone (%)
Races - American Indian alone (% change since 2000)
Races - Asian alone (%)
Races - Asian alone (% change since 2000)
Races - Hispanic (%)
Races - Hispanic (% change since 2000)
Races - Native Hawaiian and Other Pacific Islander alone (%)
Races - Native Hawaiian and Other Pacific Islander alone (% change since 2000)
Races - Two or more races(%)
Races - Two or more races(% change since 2000)
Races - Other race alone (%)
Races - Other race alone (% change since 2000)
Racial diversity
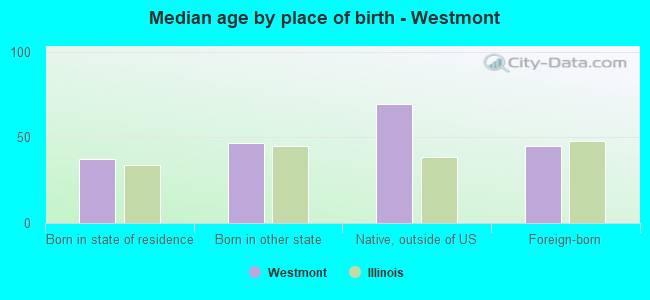
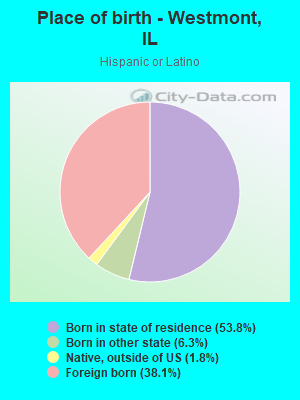
Place of birth - Born in state of residence (%)
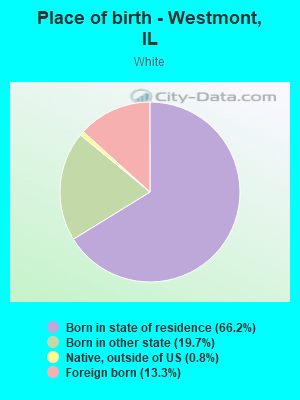
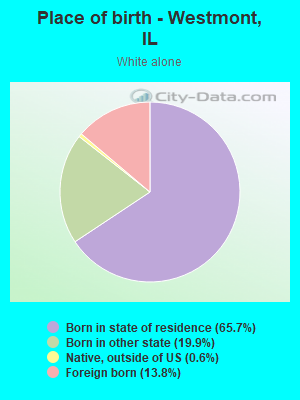
Place of birth - Born in state of residence (%) - White
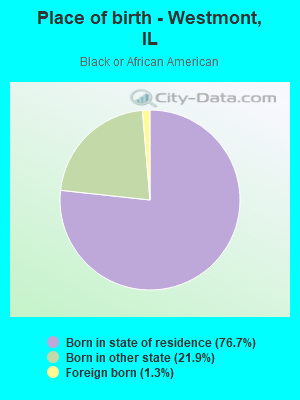
Place of birth - Born in state of residence (%) - Black or African American
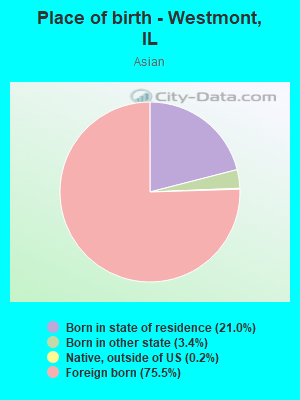
Place of birth - Born in state of residence (%) - Asian
Place of birth - Born in state of residence (%) - Hispanic or Latino
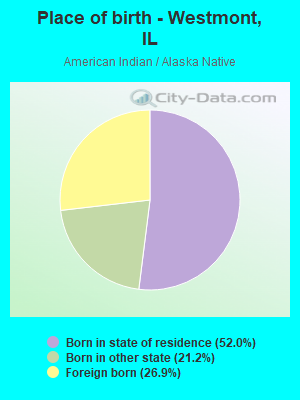
Place of birth - Born in state of residence (%) - American Indian and Alaska Native
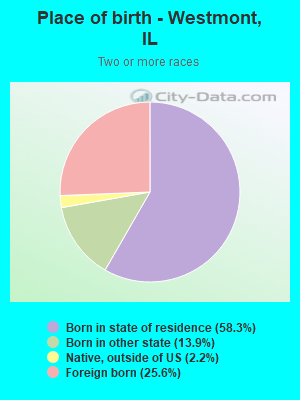
Place of birth - Born in state of residence (%) - Multirace
Place of birth - Born in state of residence (%) - Other Race
Place of birth - Born in other state (%)
Place of birth - Born in other state (%) - White
Place of birth - Born in other state (%) - Black or African American
Place of birth - Born in other state (%) - Asian
Place of birth - Born in other state (%) - Hispanic or Latino
Place of birth - Born in other state (%) - American Indian and Alaska Native
Place of birth - Born in other state (%) - Multirace
Place of birth - Born in other state (%) - Other Race
Place of birth - Native, outside of US (%)
Place of birth - Native, outside of US (%) - White
Place of birth - Native, outside of US (%) - Black or African American
Place of birth - Native, outside of US (%) - Asian
Place of birth - Native, outside of US (%) - Hispanic or Latino
Place of birth - Native, outside of US (%) - American Indian and Alaska Native
Place of birth - Native, outside of US (%) - Multirace
Place of birth - Native, outside of US (%) - Other Race
Place of birth - Foreign born (%)
Place of birth - Foreign born (%) - White
Place of birth - Foreign born (%) - Black or African American
Place of birth - Foreign born (%) - Asian
Place of birth - Foreign born (%) - Hispanic or Latino
Place of birth - Foreign born (%) - American Indian and Alaska Native
Place of birth - Foreign born (%) - Multirace
Place of birth - Foreign born (%) - Other Race
Residents speaking English at home (%)
Residents speaking English at home - Born in the United States (%)
Residents speaking English at home - Native, born elsewhere (%)
Residents speaking English at home - Foreign born (%)
Residents speaking Spanish at home (%)
Residents speaking Spanish at home - Born in the United States (%)
Residents speaking Spanish at home - Native, born elsewhere (%)
Residents speaking Spanish at home - Foreign born (%)
Residents speaking other language at home (%)
Residents speaking other language at home - Born in the United States (%)
Residents speaking other language at home - Native, born elsewhere (%)
Residents speaking other language at home - Foreign born (%)
Marital status - Never married (%)
Marital status - Now married (%)
Marital status - Separated (%)
Marital status - Widowed (%)
Marital status - Divorced (%)
Ancestries Reported - Arab (%)
Ancestries Reported - Czech (%)
Ancestries Reported - Danish (%)
Ancestries Reported - Dutch (%)
Ancestries Reported - English (%)
Ancestries Reported - French (%)
Ancestries Reported - French Canadian (%)
Ancestries Reported - German (%)
Ancestries Reported - Greek (%)
Ancestries Reported - Hungarian (%)
Ancestries Reported - Irish (%)
Ancestries Reported - Italian (%)
Ancestries Reported - Lithuanian (%)
Ancestries Reported - Norwegian (%)
Ancestries Reported - Polish (%)
Ancestries Reported - Portuguese (%)
Ancestries Reported - Russian (%)
Ancestries Reported - Scotch-Irish (%)
Ancestries Reported - Scottish (%)
Ancestries Reported - Slovak (%)
Ancestries Reported - Subsaharan African (%)
Ancestries Reported - Swedish (%)
Ancestries Reported - Swiss (%)
Ancestries Reported - Ukrainian (%)
Ancestries Reported - United States (%)
Ancestries Reported - Welsh (%)
Ancestries Reported - West Indian (%)
Ancestries Reported - Other (%)
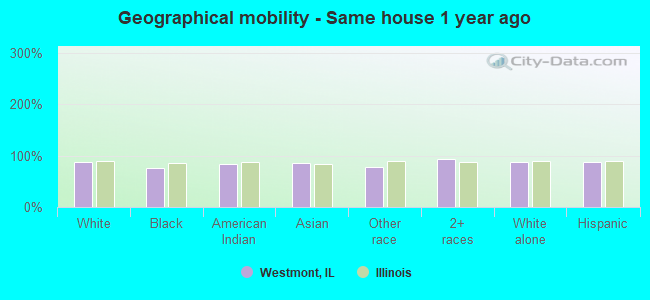
Geographical mobility - Same house 1 year ago (%)
Geographical mobility - Same house 1 year ago (%) - White
Geographical mobility - Same house 1 year ago (%) - Black or African American
Geographical mobility - Same house 1 year ago (%) - Asian
Geographical mobility - Same house 1 year ago (%) - Hispanic or Latino
Geographical mobility - Same house 1 year ago (%) - American Indian and Alaska Native
Geographical mobility - Same house 1 year ago (%) - Multirace
Geographical mobility - Same house 1 year ago (%) - Other Race
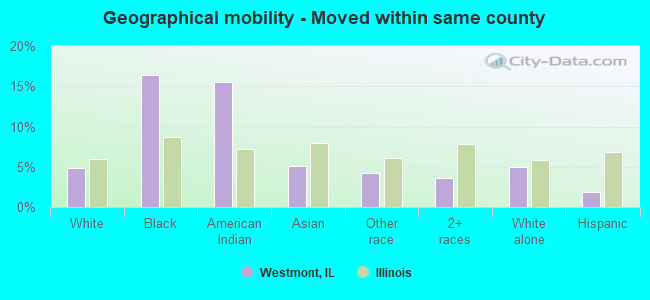
Geographical mobility - Moved within same county (%)
Geographical mobility - Moved within same county (%) - White
Geographical mobility - Moved within same county (%) - Black or African American
Geographical mobility - Moved within same county (%) - Asian
Geographical mobility - Moved within same county (%) - Hispanic or Latino
Geographical mobility - Moved within same county (%) - American Indian and Alaska Native
Geographical mobility - Moved within same county (%) - Multirace
Geographical mobility - Moved within same county (%) - Other Race
Geographical mobility - Moved from different county within same state (%)
Geographical mobility - Moved from different county within same state (%) - White
Geographical mobility - Moved from different county within same state (%) - Black or African American
Geographical mobility - Moved from different county within same state (%) - Asian
Geographical mobility - Moved from different county within same state (%) - Hispanic or Latino
Geographical mobility - Moved from different county within same state (%) - American Indian and Alaska Native
Geographical mobility - Moved from different county within same state (%) - Multirace
Geographical mobility - Moved from different county within same state (%) - Other Race
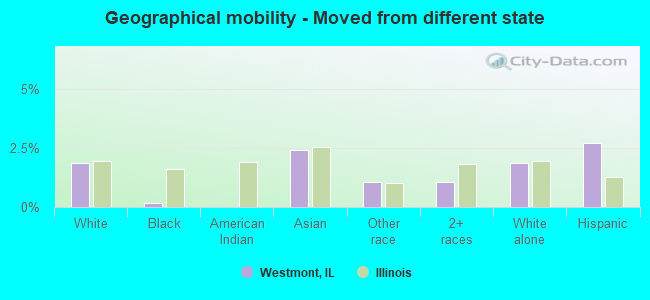
Geographical mobility - Moved from different state (%)
Geographical mobility - Moved from different state (%) - White
Geographical mobility - Moved from different state (%) - Black or African American
Geographical mobility - Moved from different state (%) - Asian
Geographical mobility - Moved from different state (%) - Hispanic or Latino
Geographical mobility - Moved from different state (%) - American Indian and Alaska Native
Geographical mobility - Moved from different state (%) - Multirace
Geographical mobility - Moved from different state (%) - Other Race
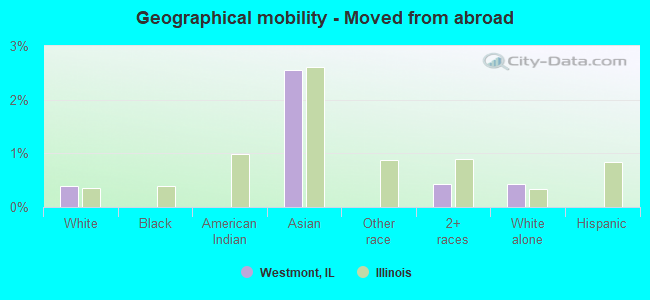
Geographical mobility - Moved from abroad (%)
Geographical mobility - Moved from abroad (%) - White
Geographical mobility - Moved from abroad (%) - Black or African American
Geographical mobility - Moved from abroad (%) - Asian
Geographical mobility - Moved from abroad (%) - Hispanic or Latino
Geographical mobility - Moved from abroad (%) - American Indian and Alaska Native
Geographical mobility - Moved from abroad (%) - Multirace
Geographical mobility - Moved from abroad (%) - Other Race
Place of birth for the foreign-born population - Ireland (%)
Place of birth for the foreign-born population - Denmark (%)
Place of birth for the foreign-born population - Norway (%)
Place of birth for the foreign-born population - Sweden (%)
Place of birth for the foreign-born population - United Kingdom (%)
Place of birth for the foreign-born population - England (%)
Place of birth for the foreign-born population - Scotland (%)
Place of birth for the foreign-born population - Other Northern Europe (%)
Place of birth for the foreign-born population - Austria (%)
Place of birth for the foreign-born population - Belgium (%)
Place of birth for the foreign-born population - France (%)
Place of birth for the foreign-born population - Germany (%)
Place of birth for the foreign-born population - Netherlands (%)
Place of birth for the foreign-born population - Switzerland (%)
Place of birth for the foreign-born population - Other Western Europe (%)
Place of birth for the foreign-born population - Greece (%)
Place of birth for the foreign-born population - Italy (%)
Place of birth for the foreign-born population - Portugal (%)
Place of birth for the foreign-born population - Spain (%)
Place of birth for the foreign-born population - Other Southern Europe (%)
Place of birth for the foreign-born population - Albania (%)
Place of birth for the foreign-born population - Belarus (%)
Place of birth for the foreign-born population - Bosnia and Herzegovina (%)
Place of birth for the foreign-born population - Bulgaria (%)
Place of birth for the foreign-born population - Croatia (%)
Place of birth for the foreign-born population - Czechoslovakia (%)
Place of birth for the foreign-born population - Hungary (%)
Place of birth for the foreign-born population - Latvia (%)
Place of birth for the foreign-born population - Lithuania (%)
Place of birth for the foreign-born population - North Macedonia (Macedonia) (%)
Place of birth for the foreign-born population - Moldova (%)
Place of birth for the foreign-born population - Poland (%)
Place of birth for the foreign-born population - Romania (%)
Place of birth for the foreign-born population - Russia (%)
Place of birth for the foreign-born population - Serbia (%)
Place of birth for the foreign-born population - Ukraine (%)
Place of birth for the foreign-born population - Other Eastern Europe (%)
Place of birth for the foreign-born population - China (%)
Place of birth for the foreign-born population - Hong Kong (%)
Place of birth for the foreign-born population - Taiwan (%)
Place of birth for the foreign-born population - Japan (%)
Place of birth for the foreign-born population - Korea (%)
Place of birth for the foreign-born population - Other Eastern Asia (%)
Place of birth for the foreign-born population - Afghanistan (%)
Place of birth for the foreign-born population - Bangladesh (%)
Place of birth for the foreign-born population - India (%)
Place of birth for the foreign-born population - Iran (%)
Place of birth for the foreign-born population - Kazakhstan (%)
Place of birth for the foreign-born population - Nepal (%)
Place of birth for the foreign-born population - Pakistan (%)
Place of birth for the foreign-born population - Sri Lanka (%)
Place of birth for the foreign-born population - Uzbekistan (%)
Place of birth for the foreign-born population - Other South Central Asia (%)
Place of birth for the foreign-born population - Burma (%)
Place of birth for the foreign-born population - Cambodia (%)
Place of birth for the foreign-born population - Indonesia (%)
Place of birth for the foreign-born population - Laos (%)
Place of birth for the foreign-born population - Malaysia (%)
Place of birth for the foreign-born population - Philippines (%)
Place of birth for the foreign-born population - Singapore (%)
Place of birth for the foreign-born population - Thailand (%)
Place of birth for the foreign-born population - Vietnam (%)
Place of birth for the foreign-born population - Other South Eastern Asia (%)
Place of birth for the foreign-born population - Armenia (%)
Place of birth for the foreign-born population - Iraq (%)
Place of birth for the foreign-born population - Israel (%)
Place of birth for the foreign-born population - Jordan (%)
Place of birth for the foreign-born population - Kuwait (%)
Place of birth for the foreign-born population - Lebanon (%)
Place of birth for the foreign-born population - Saudi Arabia (%)
Place of birth for the foreign-born population - Syria (%)
Place of birth for the foreign-born population - Turkey (%)
Place of birth for the foreign-born population - Yemen (%)
Place of birth for the foreign-born population - Other Western Asia (%)
Place of birth for the foreign-born population - Eritrea (%)
Place of birth for the foreign-born population - Ethiopia (%)
Place of birth for the foreign-born population - Kenya (%)
Place of birth for the foreign-born population - Somalia (%)
Place of birth for the foreign-born population - Uganda (%)
Place of birth for the foreign-born population - Zimbabwe (%)
Place of birth for the foreign-born population - Other Eastern Africa (%)
Place of birth for the foreign-born population - Cameroon (%)
Place of birth for the foreign-born population - Congo (%)
Place of birth for the foreign-born population - Democratic Republic of Congo (Zaire) (%)
Place of birth for the foreign-born population - Other Middle Africa (%)
Place of birth for the foreign-born population - Egypt (%)
Place of birth for the foreign-born population - Morocco (%)
Place of birth for the foreign-born population - Sudan (%)
Place of birth for the foreign-born population - Other Northern Africa (%)
Place of birth for the foreign-born population - South Africa (%)
Place of birth for the foreign-born population - Other Southern Africa (%)
Place of birth for the foreign-born population - Cabo Verde (%)
Place of birth for the foreign-born population - Ghana (%)
Place of birth for the foreign-born population - Liberia (%)
Place of birth for the foreign-born population - Nigeria (%)
Place of birth for the foreign-born population - Senegal (%)
Place of birth for the foreign-born population - Sierra Leone (%)
Place of birth for the foreign-born population - Other Western Africa (%)
Place of birth for the foreign-born population - Australia (%)
Place of birth for the foreign-born population - New Zealand (%)
Place of birth for the foreign-born population - Fiji (%)
Place of birth for the foreign-born population - Micronesia (%)
Place of birth for the foreign-born population - Bahamas (%)
Place of birth for the foreign-born population - Barbados (%)
Place of birth for the foreign-born population - Cuba (%)
Place of birth for the foreign-born population - Dominica (%)
Place of birth for the foreign-born population - Dominican Republic (%)
Place of birth for the foreign-born population - Grenada (%)
Place of birth for the foreign-born population - Haiti (%)
Place of birth for the foreign-born population - Jamaica (%)
Place of birth for the foreign-born population - St. Vincent and the Grenadines (%)
Place of birth for the foreign-born population - Trinidad and Tobago (%)
Place of birth for the foreign-born population - West Indies (%)
Place of birth for the foreign-born population - Other Caribbean (%)
Place of birth for the foreign-born population - Belize (%)
Place of birth for the foreign-born population - Costa Rica (%)
Place of birth for the foreign-born population - El Salvador (%)
Place of birth for the foreign-born population - Guatemala (%)
Place of birth for the foreign-born population - Honduras (%)
Place of birth for the foreign-born population - Mexico (%)
Place of birth for the foreign-born population - Nicaragua (%)
Place of birth for the foreign-born population - Panama (%)
Place of birth for the foreign-born population - Other Central America (%)
Place of birth for the foreign-born population - Argentina (%)
Place of birth for the foreign-born population - Bolivia (%)
Place of birth for the foreign-born population - Brazil (%)
Place of birth for the foreign-born population - Chile (%)
Place of birth for the foreign-born population - Colombia (%)
Place of birth for the foreign-born population - Ecuador (%)
Place of birth for the foreign-born population - Guyana (%)
Place of birth for the foreign-born population - Peru (%)
Place of birth for the foreign-born population - Uruguay (%)
Place of birth for the foreign-born population - Venezuela (%)
Place of birth for the foreign-born population - Other South America (%)
Place of birth for the foreign-born population - Canada (%)
Place of birth for the foreign-born population - Other Northern America (%)
Place of birth for the foreign-born population - Other (%)
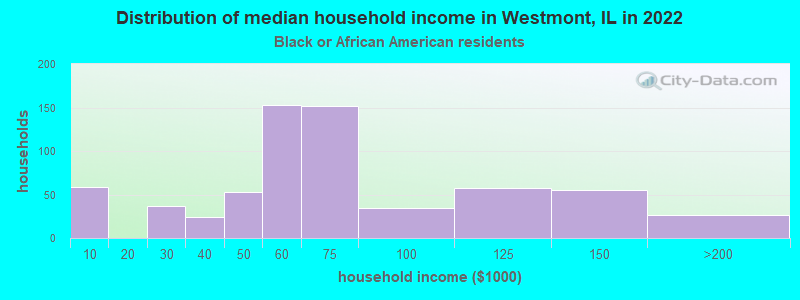
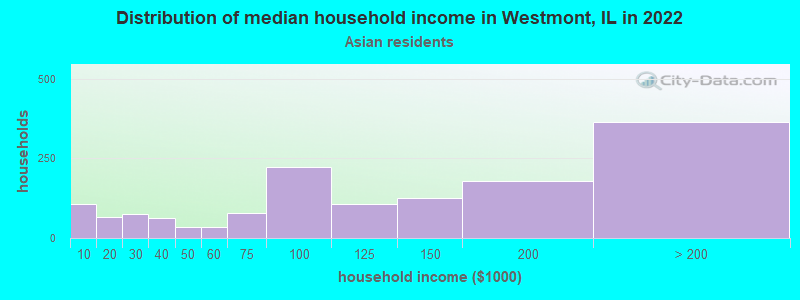
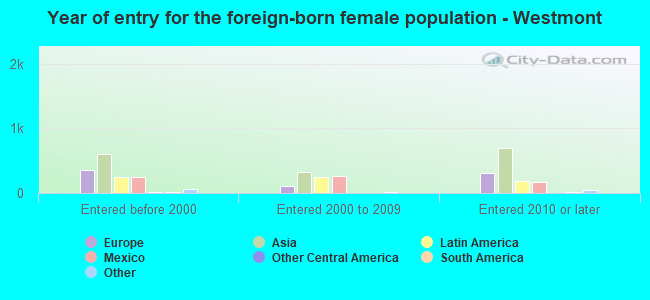
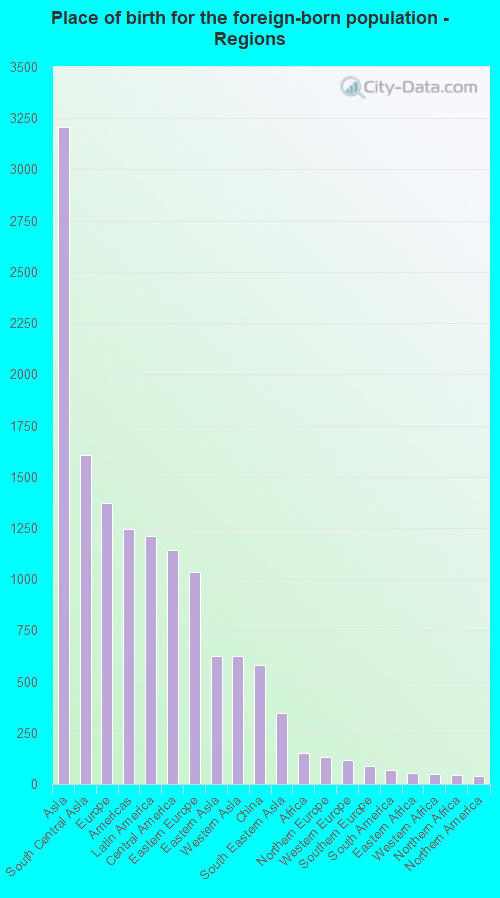
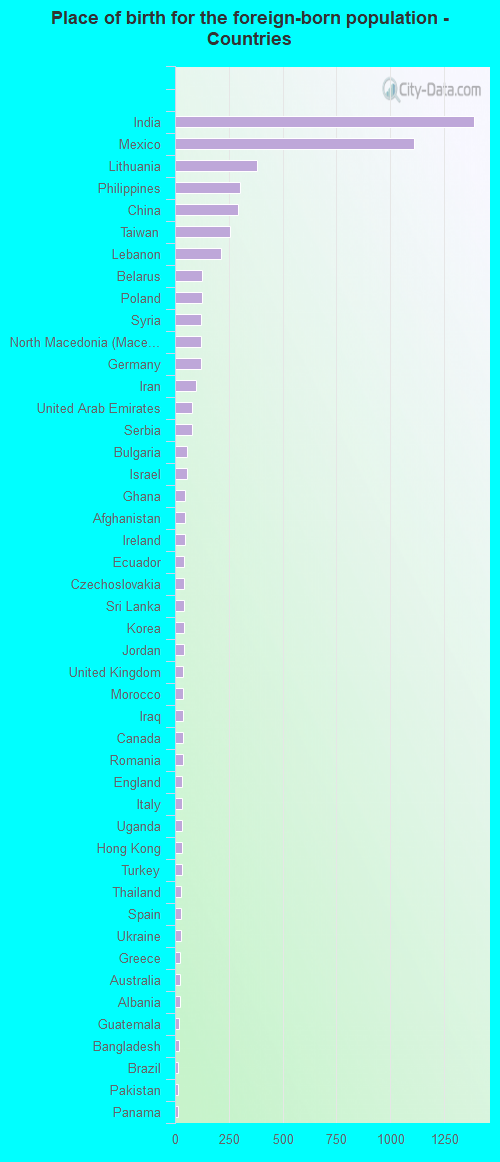
According to 2022 data, the most numerous races in Westmont, IL are White alone (14,978 residents), Hispanic (3,287 residents), and Black alone (1,376 residents). 68.7% of Westmont residents speak English at home. 25.0% of Westmont, IL residents are foreign-born (13.2% born in Asia, 5.6% born in Europe, 5.0% born in Latin America), which is 44.0% greater than the foreign-born rate of 14.0% across the entire state of Illinois.
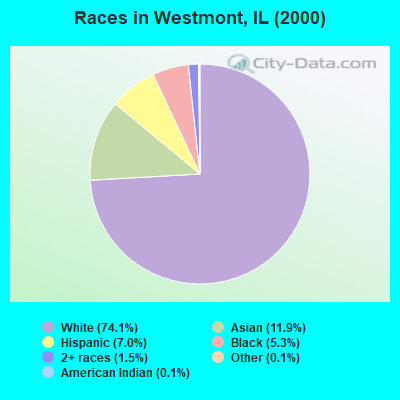
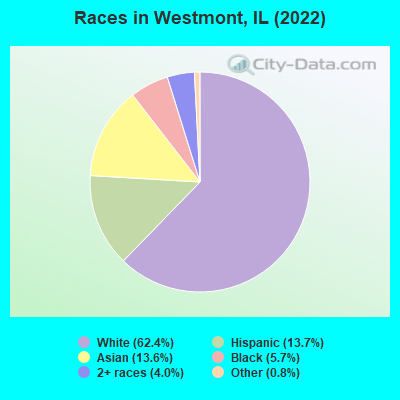
Race distribution in Westmont
2000 2022
8,424,140 67.8% White alone 1,856,152 14.9% Black alone 1,530,262 12.3% Hispanic 419,916 3.4% Asian alone 153,996 1.2% Two or more races 13,479 0.1% Other race alone 18,232 0.1% American Indian alone 3,116 0.03% Native Hawaiian and Other
7,356,301 58.5% White alone 2,299,726 18.3% Hispanic 1,660,423 13.2% Black alone 747,296 5.9% Asian alone 458,599 3.6% Two or more races 45,386 0.4% Other race alone 10,405 0.08% American Indian alone 3,896 0.03% Native Hawaiian and Other
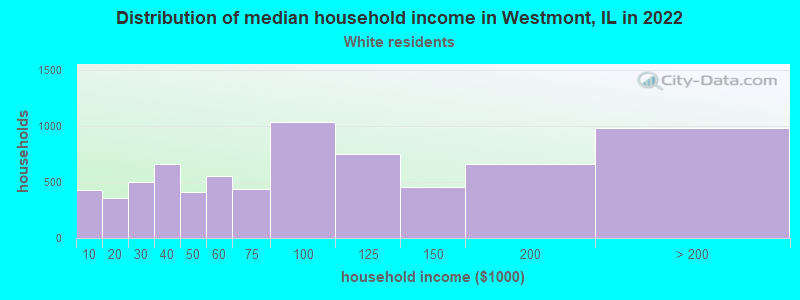
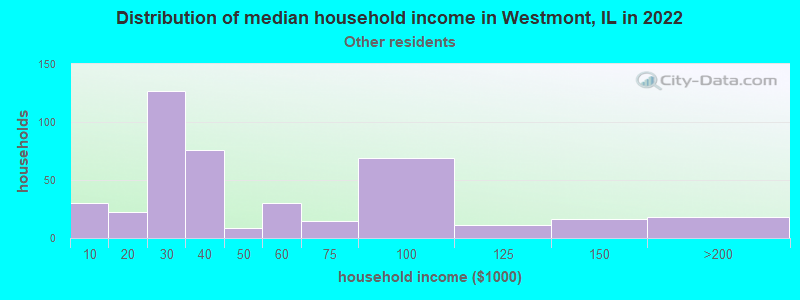
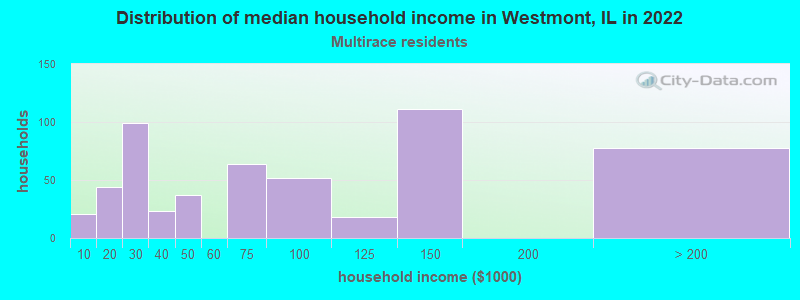
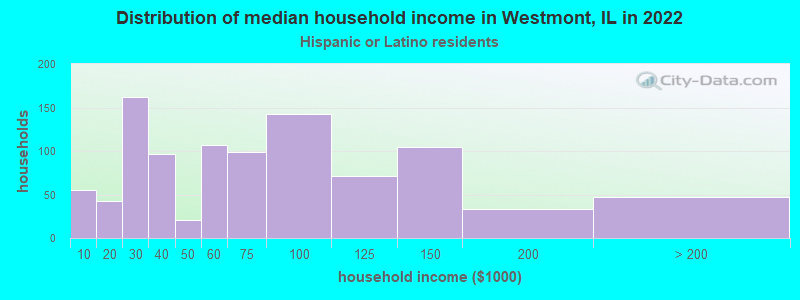
Income and house value in Westmont Median household income in 2022 $81,721 White non-Hispanic householders$52,969 Black householders$123,724 Asian householders$31,028 Some other race householders$77,089 Two or more races householders$57,122 Hispanic or Latino race householdersMedian 2022 house value $377,820 White Non-Hispanic householders$499,498 Black or African American householders$479,467 American Indian or Alaska Native householders $457,092 Asian householders$321,989 Some other race householders$309,629 Two or more races householders$317,514 Hispanic or Latino householders
Median age by race in Westmont
48.5 Median age for White residents43.8 52.4 36.2 Median age for Black or African American residents25.4 37.4 23.6 Median age for American Indian / Alaska Native residents20.7 18.7 39.0 Median age for Asian residents40.0 37.7 -593,236,714.4 Median age for Native Hawaiian / Pacific Islander residents-658,536,584.7 -576,015,108.0 31.2 Median age for Other race residents40.6 29.5 20.2 Median age for Two or more races residents15.5 22.7 50.1 Median age for White alone residents47.6 53.0 27.6 Median age for Hispanic or Latino residents26.8 28.2
Owner/renter occupied households by race in Westmont
House owners and renters - White residents 4,304 61.8% Owner occupied2,662 38.2% Renter occupiedHouse owners and renters - Black or African American residents 41 5.7% Owner occupied678 94.3% Renter occupiedHouse owners and renters - American Indian / Alaska Native residents 10 100.0% Renter occupiedHouse owners and renters - Asian residents 827 60.6% Owner occupied538 39.4% Renter occupiedHouse owners and renters - Other race residents 167 35.5% Owner occupied303 64.5% Renter occupiedHouse owners and renters - Two or more races residents 190 35.2% Owner occupied350 64.8% Renter occupiedHouse owners and renters - White alone residents 4,268 62.2% Owner occupied2,594 37.8% Renter occupiedHouse owners and renters - Hispanic or Latino residents 284 28.4% Owner occupied715 71.6% Renter occupied
Language usage in Westmont
English speakers - Total 68.7% of residents of Westmont speak English at home.
9.7% of residents speak Spanish at home 1,308 59.8% Speak English very well879 40.2% Speak English less than very well21.5% of residents speak other language at home 3,396 70.2% Speak English very well1,443 29.8% Speak English less than very well
English speakers - Born in the United States 94.2% of residents of Westmont speak English at home.
1.7% of residents speak Spanish at home 52 82.5% Speak English very well11 17.5% Speak English less than very well4.4% of residents speak other language at home 151 93.8% Speak English very well10 6.2% Speak English less than very well
English speakers - Native, born elsewhere 49.3% of residents of Westmont speak English at home.
25.3% of residents speak Spanish at home 38 100.0% Speak English very well26.0% of residents speak other language at home 39 100.0% Speak English very well
English speakers - Foreign-born 7.5% of residents of Westmont speak English at home.
20.9% of residents speak Spanish at home 494 39.8% Speak English very well747 60.2% Speak English less than very well71.4% of residents speak other language at home 2,870 67.6% Speak English very well1,373 32.4% Speak English less than very well
White (Caucasian) - Speak only English Native:
94.4% (12,029)Foreign-born:
14.3% (290)
White (Caucasian) - Speak another language Native:
5.7% (722)Foreign-born:
85.2% (1,735)
Black or African American - Speak another language Native:
0.3% (5)Foreign-born:
100.0% (19)
American Indian / Alaska Native - Speak only English Native:
34.3% (19)Foreign-born:
27.1% (7)
American Indian / Alaska Native - Speak another language Native:
63.4% (36)Foreign-born:
79.8% (21)
Asian - Speak only English Native:
81.7% (488)Foreign-born:
3.8% (96)
Asian - Speak another language Native:
23.2% (139)Foreign-born:
97.1% (2,438)
Other race - Speak only English Native:
40.2% (179)Foreign-born:
4.7% (34)
Other race - Speak another language Native:
61.5% (275)Foreign-born:
95.6% (691)
Two or more races - Speak only English Native:
76.7% (937)Foreign-born:
5.6% (33)
Two or more races - Speak another language Native:
21.2% (259)Foreign-born:
95.4% (562)
White alone - Speak only English Native:
95.6% (11,899)Foreign-born:
14.9% (308)
White alone - Speak another language Native:
4.4% (551)Foreign-born:
84.9% (1,751)
Hispanic or Latino - Speak only English Native:
46.9% (751)Foreign-born:
2.8% (35)
Hispanic or Latino - Speak another language Native:
52.8% (845)Foreign-born:
97.8% (1,223)
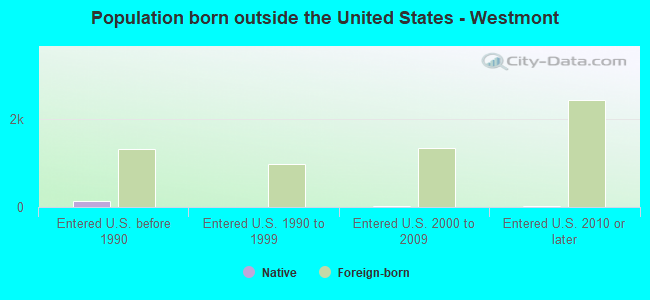
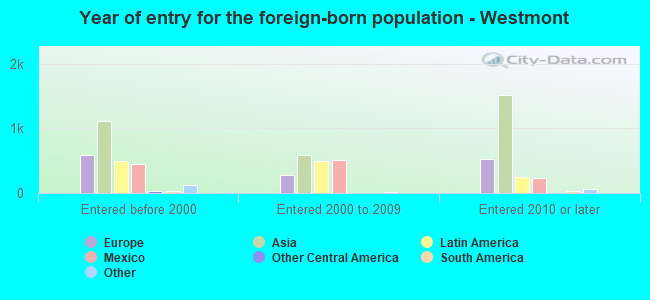
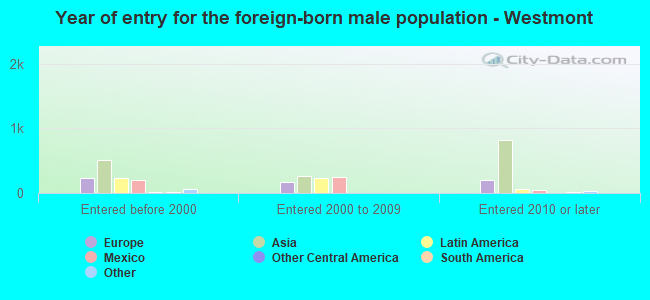
Foreign-born residents in Westmont 6,000 residents are foreign born (13.2% Asia , 5.6% Europe , 5.0% Latin America ).
This city:
25.0%Illinois:
14.1%
Marital status for residents in Westmont Marital status - White (Caucasian) population 15 years and over
Males 34.7% Never married54.0% Now married0.5% Separated3.1% Widowed7.7% DivorcedFemales 25.1% Never married46.8% Now married0.8% Separated12.4% Widowed14.9% DivorcedWomen who gave birth in the past 12 months Now married:
76.0% (149)Unmarried:
24.0% (47)
Women who did not give birth in the past 12 months Now married:
44.9% (1,235)Unmarried:
55.1% (1,513)
Marital status - Black or African American population 15 years and over
Males 52.9% Never married42.6% Now married3.1% Separated0.0% Widowed1.4% DivorcedFemales 50.7% Never married29.4% Now married4.0% Separated7.2% Widowed8.7% DivorcedWomen who did not give birth in the past 12 months Now married:
40.1% (210)Unmarried:
59.9% (314)
Marital status - American Indian / Alaska Native population 15 years and over
Males 70.0% Never married30.0% Now married0.0% Separated0.0% Widowed0.0% DivorcedFemales 74.1% Never married25.9% Now married0.0% Separated0.0% Widowed0.0% DivorcedWomen who did not give birth in the past 12 months Now married:
0.0% (0)Unmarried:
100.0% (67)
Marital status - Asian population 15 years and over
Males 22.5% Never married69.9% Now married0.0% Separated0.9% Widowed6.7% DivorcedFemales 21.2% Never married61.5% Now married1.0% Separated12.5% Widowed3.8% DivorcedWomen who gave birth in the past 12 months Now married:
100.0% (79)Unmarried:
0.0% (0)
Women who did not give birth in the past 12 months Now married:
60.9% (470)Unmarried:
39.1% (302)
Marital status - Other race population 15 years and over
Males 43.0% Never married43.7% Now married0.0% Separated11.0% Widowed2.3% DivorcedFemales 27.8% Never married46.1% Now married11.6% Separated14.2% Widowed0.3% DivorcedWomen who gave birth in the past 12 months Now married:
100.0% (99)Unmarried:
0.0% (0)
Women who did not give birth in the past 12 months Now married:
43.1% (165)Unmarried:
56.9% (218)
Marital status - Two or more races population 15 years and over
Males 16.3% Never married81.4% Now married0.0% Separated0.0% Widowed2.3% DivorcedFemales 40.6% Never married45.5% Now married6.3% Separated1.8% Widowed5.7% DivorcedWomen who did not give birth in the past 12 months Now married:
40.9% (212)Unmarried:
59.1% (306)
Marital status - White alone, not Hispanic / Latino population 15 years and over
Males 33.5% Never married54.7% Now married0.5% Separated2.9% Widowed8.4% DivorcedFemales 25.2% Never married45.9% Now married0.4% Separated13.0% Widowed15.4% DivorcedWomen who gave birth in the past 12 months Now married:
76.5% (120)Unmarried:
23.5% (37)
Women who did not give birth in the past 12 months Now married:
43.4% (1,188)Unmarried:
56.6% (1,547)
Marital status - Hispanic or Latino population 15 years and over
Males 40.4% Never married53.0% Now married0.0% Separated5.9% Widowed0.7% DivorcedFemales 37.8% Never married47.0% Now married9.0% Separated4.8% Widowed1.3% DivorcedWomen who gave birth in the past 12 months Now married:
88.9% (116)Unmarried:
11.1% (15)
Women who did not give birth in the past 12 months Now married:
43.8% (377)Unmarried:
56.2% (483)
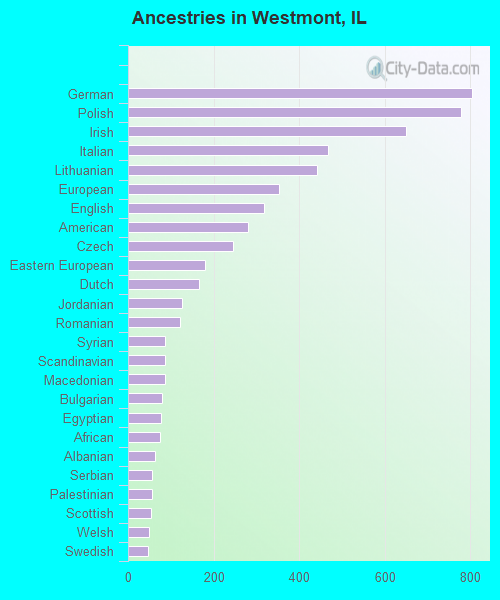
Ancestries in Westmont
804 6.4% German778 6.2% Polish650 5.2% Irish467 3.7% Italian442 3.5% Lithuanian352 2.8% European319 2.5% English280 2.2% American245 2.0% Czech181 1.4% Eastern European165 1.3% Dutch127 1.0% Jordanian122 1.0% Romanian86 0.7% Syrian86 0.7% Scandinavian86 0.7% Macedonian79 0.6% Bulgarian78 0.6% Egyptian76 0.6% African62 0.5% Albanian57 0.5% Serbian55 0.4% Palestinian54 0.4% Scottish49 0.4% Welsh46 0.4% Swedish44 0.4% Greek41 0.3% Iranian37 0.3% Czechoslovakian37 0.3% Scotch-Irish36 0.3% Moroccan35 0.3% Croatian34 0.3% Lebanese32 0.3% Norwegian29 0.2% Turkish28 0.2% Slovak27 0.2% Belgian26 0.2% Ukrainian24 0.2% Australian22 0.2% British21 0.2% Hungarian20 0.2% French17 0.1% Slovene15 0.1% Slavic13 0.1% Arab13 0.1% Estonian11 0.09% Jamaican10 0.08% Danish10 0.08% Brazilian10 0.08% Swiss6 0.05% French Canadian5 0.04% Northern European
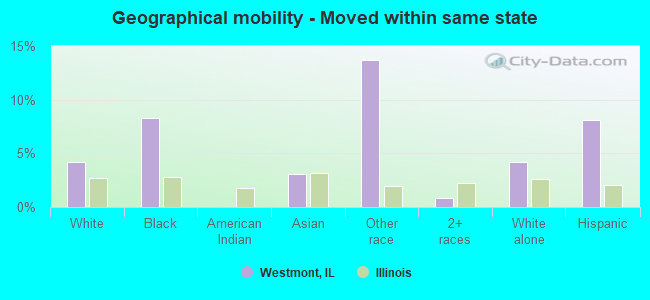
Geographical mobility in Westmont Same house 1 year ago 13,481 88.7% White (Caucasian)1,060 76.9% Black or African American121 84.5% American Indian / Alaska Native2,845 85.6% Asian1,053 77.7% Other race2,105 93.0% Two or more races13,091 88.3% White alone, not Hispanic / Latino2,795 88.1% Hispanic or LatinoMoved within same county 728 4.8% White / Caucasian226 16.4% Black or African American22 15.5% American Indian / Alaska Native171 5.1% Asian57 4.2% Other race81 3.6% Two or more races742 5.0% White alone, not Hispanic / Latino58 1.8% Hispanic or LatinoMoved within same state 644 4.2% White / Caucasian114 8.3% Black or African American103 3.1% Asian186 13.7% Other race19 0.8% Two or more races624 4.2% White alone, not Hispanic / Latino257 8.1% Hispanic or LatinoMoved from different state 280 1.8% White / Caucasian2 0.2% Black or African American80 2.4% Asian14 1.1% Other race24 1.1% Two or more races274 1.8% White alone, not Hispanic / Latino86 2.7% Hispanic or LatinoMoved from abroad 60 0.4% White85 2.6% Asian10 0.4% Two or more races64 0.4% White alone, not Hispanic / Latino
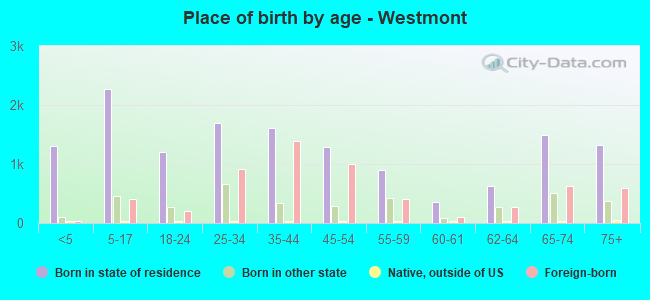
Children Nativity (place of birth) in Westmont
Children under 6 years - Living with two parents Both parents native 567 99.7% Native2 0.3% Foreign-bornBoth parents foreign-born 560 95.1% Native29 4.9% Foreign-bornOne native, one foreign-born parent 132 100.0% NativeChildren under 6 years - Living with one parent Native parent 174 100.0% NativeForeign-born parent 119 94.6% Native7 5.4% Foreign-bornChildren 6 to 17 years - Living with two parents Both parents native 989 100.0% NativeBoth parents foreign-born 382 51.9% Native354 48.1% Foreign-bornOne native, one foreign-born parent 94 100.0% NativeChildren 6 to 17 years - Living with one parent Native parent 571 100.0% NativeForeign-born parent 493 53.5% Native429 46.5% Foreign-born
Grandparents responsible for own grandchildren in Westmont
Grandparents (30 to 59 years) White / Caucasian 23 100.0% Not responsible for grandchildrenAmerican Indian / Alaska Native 12 100.0% Not responsible for grandchildrenAsian 9 100.0% Not responsible for grandchildrenTwo or more races 56 70.5% Responsible for grandchildren24 29.5% Not responsible for grandchildrenWhite alone, not Hispanic / Latino 26 100.0% Not responsible for grandchildrenHispanic or Latino 13 25.1% Responsible for grandchildren39 74.9% Not responsible for grandchildrenGrandparents (60 years and over) White / Caucasian 53 38.2% Responsible for grandchildren85 61.8% Not responsible for grandchildrenAsian 117 100.0% Not responsible for grandchildrenTwo or more races 73 100.0% Responsible for grandchildrenWhite alone, not Hispanic / Latino 58 40.5% Responsible for grandchildren85 59.5% Not responsible for grandchildrenHispanic or Latino 55 73.5% Responsible for grandchildren20 26.5% Not responsible for grandchildren