Races in Westchester, Illinois (IL) Detailed Stats
Data:
Races - White alone (%)
Races - White alone (% change since 2000)
Races - Black alone (%)
Races - Black alone (% change since 2000)
Races - American Indian alone (%)
Races - American Indian alone (% change since 2000)
Races - Asian alone (%)
Races - Asian alone (% change since 2000)
Races - Hispanic (%)
Races - Hispanic (% change since 2000)
Races - Native Hawaiian and Other Pacific Islander alone (%)
Races - Native Hawaiian and Other Pacific Islander alone (% change since 2000)
Races - Two or more races(%)
Races - Two or more races(% change since 2000)
Races - Other race alone (%)
Races - Other race alone (% change since 2000)
Racial diversity
Place of birth - Born in state of residence (%)
Place of birth - Born in state of residence (%) - White
Place of birth - Born in state of residence (%) - Black or African American
Place of birth - Born in state of residence (%) - Asian
Place of birth - Born in state of residence (%) - Hispanic or Latino
Place of birth - Born in state of residence (%) - American Indian and Alaska Native
Place of birth - Born in state of residence (%) - Multirace
Place of birth - Born in state of residence (%) - Other Race
Place of birth - Born in other state (%)
Place of birth - Born in other state (%) - White
Place of birth - Born in other state (%) - Black or African American
Place of birth - Born in other state (%) - Asian
Place of birth - Born in other state (%) - Hispanic or Latino
Place of birth - Born in other state (%) - American Indian and Alaska Native
Place of birth - Born in other state (%) - Multirace
Place of birth - Born in other state (%) - Other Race
Place of birth - Native, outside of US (%)
Place of birth - Native, outside of US (%) - White
Place of birth - Native, outside of US (%) - Black or African American
Place of birth - Native, outside of US (%) - Asian
Place of birth - Native, outside of US (%) - Hispanic or Latino
Place of birth - Native, outside of US (%) - American Indian and Alaska Native
Place of birth - Native, outside of US (%) - Multirace
Place of birth - Native, outside of US (%) - Other Race
Place of birth - Foreign born (%)
Place of birth - Foreign born (%) - White
Place of birth - Foreign born (%) - Black or African American
Place of birth - Foreign born (%) - Asian
Place of birth - Foreign born (%) - Hispanic or Latino
Place of birth - Foreign born (%) - American Indian and Alaska Native
Place of birth - Foreign born (%) - Multirace
Place of birth - Foreign born (%) - Other Race
Residents speaking English at home (%)
Residents speaking English at home - Born in the United States (%)
Residents speaking English at home - Native, born elsewhere (%)
Residents speaking English at home - Foreign born (%)
Residents speaking Spanish at home (%)
Residents speaking Spanish at home - Born in the United States (%)
Residents speaking Spanish at home - Native, born elsewhere (%)
Residents speaking Spanish at home - Foreign born (%)
Residents speaking other language at home (%)
Residents speaking other language at home - Born in the United States (%)
Residents speaking other language at home - Native, born elsewhere (%)
Residents speaking other language at home - Foreign born (%)
Marital status - Never married (%)
Marital status - Now married (%)
Marital status - Separated (%)
Marital status - Widowed (%)
Marital status - Divorced (%)
Ancestries Reported - Arab (%)
Ancestries Reported - Czech (%)
Ancestries Reported - Danish (%)
Ancestries Reported - Dutch (%)
Ancestries Reported - English (%)
Ancestries Reported - French (%)
Ancestries Reported - French Canadian (%)
Ancestries Reported - German (%)
Ancestries Reported - Greek (%)
Ancestries Reported - Hungarian (%)
Ancestries Reported - Irish (%)
Ancestries Reported - Italian (%)
Ancestries Reported - Lithuanian (%)
Ancestries Reported - Norwegian (%)
Ancestries Reported - Polish (%)
Ancestries Reported - Portuguese (%)
Ancestries Reported - Russian (%)
Ancestries Reported - Scotch-Irish (%)
Ancestries Reported - Scottish (%)
Ancestries Reported - Slovak (%)
Ancestries Reported - Subsaharan African (%)
Ancestries Reported - Swedish (%)
Ancestries Reported - Swiss (%)
Ancestries Reported - Ukrainian (%)
Ancestries Reported - United States (%)
Ancestries Reported - Welsh (%)
Ancestries Reported - West Indian (%)
Ancestries Reported - Other (%)
Geographical mobility - Same house 1 year ago (%)
Geographical mobility - Same house 1 year ago (%) - White
Geographical mobility - Same house 1 year ago (%) - Black or African American
Geographical mobility - Same house 1 year ago (%) - Asian
Geographical mobility - Same house 1 year ago (%) - Hispanic or Latino
Geographical mobility - Same house 1 year ago (%) - American Indian and Alaska Native
Geographical mobility - Same house 1 year ago (%) - Multirace
Geographical mobility - Same house 1 year ago (%) - Other Race
Geographical mobility - Moved within same county (%)
Geographical mobility - Moved within same county (%) - White
Geographical mobility - Moved within same county (%) - Black or African American
Geographical mobility - Moved within same county (%) - Asian
Geographical mobility - Moved within same county (%) - Hispanic or Latino
Geographical mobility - Moved within same county (%) - American Indian and Alaska Native
Geographical mobility - Moved within same county (%) - Multirace
Geographical mobility - Moved within same county (%) - Other Race
Geographical mobility - Moved from different county within same state (%)
Geographical mobility - Moved from different county within same state (%) - White
Geographical mobility - Moved from different county within same state (%) - Black or African American
Geographical mobility - Moved from different county within same state (%) - Asian
Geographical mobility - Moved from different county within same state (%) - Hispanic or Latino
Geographical mobility - Moved from different county within same state (%) - American Indian and Alaska Native
Geographical mobility - Moved from different county within same state (%) - Multirace
Geographical mobility - Moved from different county within same state (%) - Other Race
Geographical mobility - Moved from different state (%)
Geographical mobility - Moved from different state (%) - White
Geographical mobility - Moved from different state (%) - Black or African American
Geographical mobility - Moved from different state (%) - Asian
Geographical mobility - Moved from different state (%) - Hispanic or Latino
Geographical mobility - Moved from different state (%) - American Indian and Alaska Native
Geographical mobility - Moved from different state (%) - Multirace
Geographical mobility - Moved from different state (%) - Other Race
Geographical mobility - Moved from abroad (%)
Geographical mobility - Moved from abroad (%) - White
Geographical mobility - Moved from abroad (%) - Black or African American
Geographical mobility - Moved from abroad (%) - Asian
Geographical mobility - Moved from abroad (%) - Hispanic or Latino
Geographical mobility - Moved from abroad (%) - American Indian and Alaska Native
Geographical mobility - Moved from abroad (%) - Multirace
Geographical mobility - Moved from abroad (%) - Other Race
Place of birth for the foreign-born population - Ireland (%)
Place of birth for the foreign-born population - Denmark (%)
Place of birth for the foreign-born population - Norway (%)
Place of birth for the foreign-born population - Sweden (%)
Place of birth for the foreign-born population - United Kingdom (%)
Place of birth for the foreign-born population - England (%)
Place of birth for the foreign-born population - Scotland (%)
Place of birth for the foreign-born population - Other Northern Europe (%)
Place of birth for the foreign-born population - Austria (%)
Place of birth for the foreign-born population - Belgium (%)
Place of birth for the foreign-born population - France (%)
Place of birth for the foreign-born population - Germany (%)
Place of birth for the foreign-born population - Netherlands (%)
Place of birth for the foreign-born population - Switzerland (%)
Place of birth for the foreign-born population - Other Western Europe (%)
Place of birth for the foreign-born population - Greece (%)
Place of birth for the foreign-born population - Italy (%)
Place of birth for the foreign-born population - Portugal (%)
Place of birth for the foreign-born population - Spain (%)
Place of birth for the foreign-born population - Other Southern Europe (%)
Place of birth for the foreign-born population - Albania (%)
Place of birth for the foreign-born population - Belarus (%)
Place of birth for the foreign-born population - Bosnia and Herzegovina (%)
Place of birth for the foreign-born population - Bulgaria (%)
Place of birth for the foreign-born population - Croatia (%)
Place of birth for the foreign-born population - Czechoslovakia (%)
Place of birth for the foreign-born population - Hungary (%)
Place of birth for the foreign-born population - Latvia (%)
Place of birth for the foreign-born population - Lithuania (%)
Place of birth for the foreign-born population - North Macedonia (Macedonia) (%)
Place of birth for the foreign-born population - Moldova (%)
Place of birth for the foreign-born population - Poland (%)
Place of birth for the foreign-born population - Romania (%)
Place of birth for the foreign-born population - Russia (%)
Place of birth for the foreign-born population - Serbia (%)
Place of birth for the foreign-born population - Ukraine (%)
Place of birth for the foreign-born population - Other Eastern Europe (%)
Place of birth for the foreign-born population - China (%)
Place of birth for the foreign-born population - Hong Kong (%)
Place of birth for the foreign-born population - Taiwan (%)
Place of birth for the foreign-born population - Japan (%)
Place of birth for the foreign-born population - Korea (%)
Place of birth for the foreign-born population - Other Eastern Asia (%)
Place of birth for the foreign-born population - Afghanistan (%)
Place of birth for the foreign-born population - Bangladesh (%)
Place of birth for the foreign-born population - India (%)
Place of birth for the foreign-born population - Iran (%)
Place of birth for the foreign-born population - Kazakhstan (%)
Place of birth for the foreign-born population - Nepal (%)
Place of birth for the foreign-born population - Pakistan (%)
Place of birth for the foreign-born population - Sri Lanka (%)
Place of birth for the foreign-born population - Uzbekistan (%)
Place of birth for the foreign-born population - Other South Central Asia (%)
Place of birth for the foreign-born population - Burma (%)
Place of birth for the foreign-born population - Cambodia (%)
Place of birth for the foreign-born population - Indonesia (%)
Place of birth for the foreign-born population - Laos (%)
Place of birth for the foreign-born population - Malaysia (%)
Place of birth for the foreign-born population - Philippines (%)
Place of birth for the foreign-born population - Singapore (%)
Place of birth for the foreign-born population - Thailand (%)
Place of birth for the foreign-born population - Vietnam (%)
Place of birth for the foreign-born population - Other South Eastern Asia (%)
Place of birth for the foreign-born population - Armenia (%)
Place of birth for the foreign-born population - Iraq (%)
Place of birth for the foreign-born population - Israel (%)
Place of birth for the foreign-born population - Jordan (%)
Place of birth for the foreign-born population - Kuwait (%)
Place of birth for the foreign-born population - Lebanon (%)
Place of birth for the foreign-born population - Saudi Arabia (%)
Place of birth for the foreign-born population - Syria (%)
Place of birth for the foreign-born population - Turkey (%)
Place of birth for the foreign-born population - Yemen (%)
Place of birth for the foreign-born population - Other Western Asia (%)
Place of birth for the foreign-born population - Eritrea (%)
Place of birth for the foreign-born population - Ethiopia (%)
Place of birth for the foreign-born population - Kenya (%)
Place of birth for the foreign-born population - Somalia (%)
Place of birth for the foreign-born population - Uganda (%)
Place of birth for the foreign-born population - Zimbabwe (%)
Place of birth for the foreign-born population - Other Eastern Africa (%)
Place of birth for the foreign-born population - Cameroon (%)
Place of birth for the foreign-born population - Congo (%)
Place of birth for the foreign-born population - Democratic Republic of Congo (Zaire) (%)
Place of birth for the foreign-born population - Other Middle Africa (%)
Place of birth for the foreign-born population - Egypt (%)
Place of birth for the foreign-born population - Morocco (%)
Place of birth for the foreign-born population - Sudan (%)
Place of birth for the foreign-born population - Other Northern Africa (%)
Place of birth for the foreign-born population - South Africa (%)
Place of birth for the foreign-born population - Other Southern Africa (%)
Place of birth for the foreign-born population - Cabo Verde (%)
Place of birth for the foreign-born population - Ghana (%)
Place of birth for the foreign-born population - Liberia (%)
Place of birth for the foreign-born population - Nigeria (%)
Place of birth for the foreign-born population - Senegal (%)
Place of birth for the foreign-born population - Sierra Leone (%)
Place of birth for the foreign-born population - Other Western Africa (%)
Place of birth for the foreign-born population - Australia (%)
Place of birth for the foreign-born population - New Zealand (%)
Place of birth for the foreign-born population - Fiji (%)
Place of birth for the foreign-born population - Micronesia (%)
Place of birth for the foreign-born population - Bahamas (%)
Place of birth for the foreign-born population - Barbados (%)
Place of birth for the foreign-born population - Cuba (%)
Place of birth for the foreign-born population - Dominica (%)
Place of birth for the foreign-born population - Dominican Republic (%)
Place of birth for the foreign-born population - Grenada (%)
Place of birth for the foreign-born population - Haiti (%)
Place of birth for the foreign-born population - Jamaica (%)
Place of birth for the foreign-born population - St. Vincent and the Grenadines (%)
Place of birth for the foreign-born population - Trinidad and Tobago (%)
Place of birth for the foreign-born population - West Indies (%)
Place of birth for the foreign-born population - Other Caribbean (%)
Place of birth for the foreign-born population - Belize (%)
Place of birth for the foreign-born population - Costa Rica (%)
Place of birth for the foreign-born population - El Salvador (%)
Place of birth for the foreign-born population - Guatemala (%)
Place of birth for the foreign-born population - Honduras (%)
Place of birth for the foreign-born population - Mexico (%)
Place of birth for the foreign-born population - Nicaragua (%)
Place of birth for the foreign-born population - Panama (%)
Place of birth for the foreign-born population - Other Central America (%)
Place of birth for the foreign-born population - Argentina (%)
Place of birth for the foreign-born population - Bolivia (%)
Place of birth for the foreign-born population - Brazil (%)
Place of birth for the foreign-born population - Chile (%)
Place of birth for the foreign-born population - Colombia (%)
Place of birth for the foreign-born population - Ecuador (%)
Place of birth for the foreign-born population - Guyana (%)
Place of birth for the foreign-born population - Peru (%)
Place of birth for the foreign-born population - Uruguay (%)
Place of birth for the foreign-born population - Venezuela (%)
Place of birth for the foreign-born population - Other South America (%)
Place of birth for the foreign-born population - Canada (%)
Place of birth for the foreign-born population - Other Northern America (%)
Place of birth for the foreign-born population - Other (%)
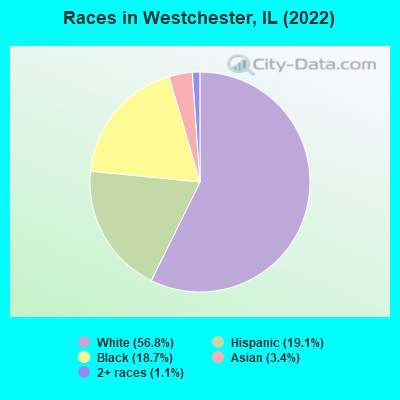
According to 2022 data, the most numerous races in Westchester, IL are White alone (9,277 residents), Hispanic (3,114 residents), and Black alone (3,051 residents). 75.5% of Westchester residents speak English at home. 14.0% of Westchester, IL residents are foreign-born (5.2% born in Europe, 5.2% born in Latin America, 3.0% born in Asia), which is about the same as the foreign-born rate of 14.0% across the entire state of Illinois.
Race distribution in Westchester
2000 2022
8,424,140 67.8% White alone 1,856,152 14.9% Black alone 1,530,262 12.3% Hispanic 419,916 3.4% Asian alone 153,996 1.2% Two or more races 13,479 0.1% Other race alone 18,232 0.1% American Indian alone 3,116 0.03% Native Hawaiian and Other
7,356,301 58.5% White alone 2,299,726 18.3% Hispanic 1,660,423 13.2% Black alone 747,296 5.9% Asian alone 458,599 3.6% Two or more races 45,386 0.4% Other race alone 10,405 0.08% American Indian alone 3,896 0.03% Native Hawaiian and Other
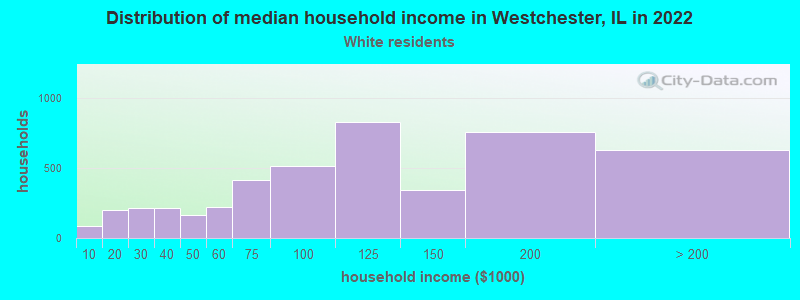
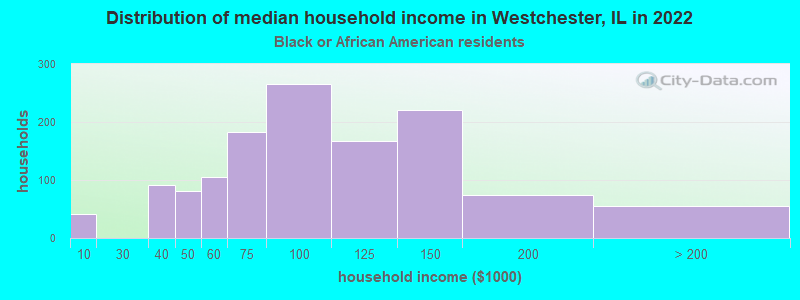
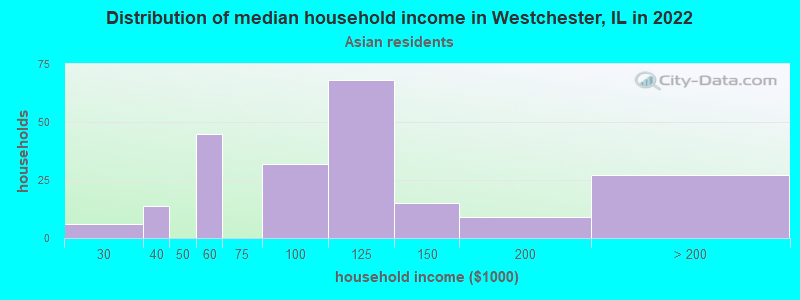
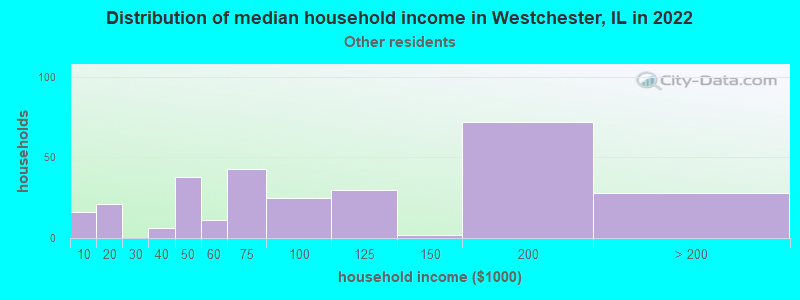
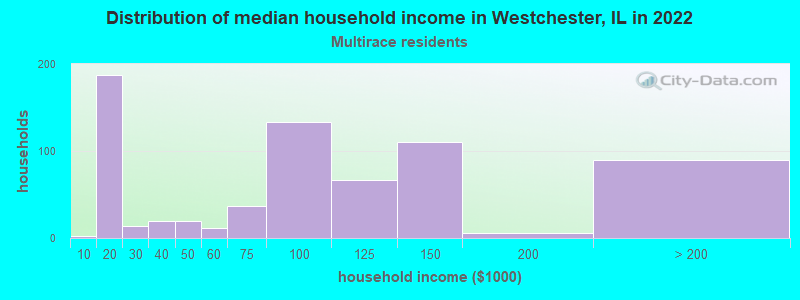
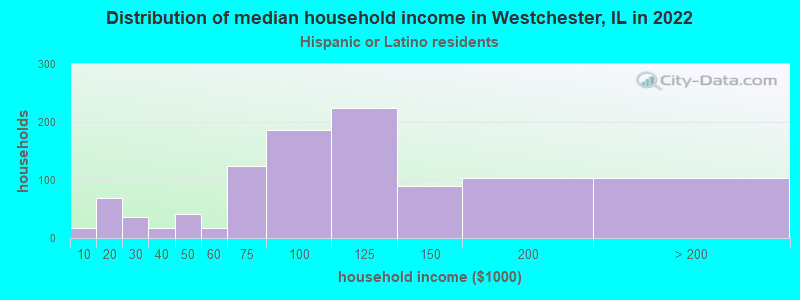
Income and house value in Westchester Median household income in 2022 $104,904 White non-Hispanic householders$87,916 Black householders$99,179 Asian householders$89,953 Some other race householders$75,992 Two or more races householders$99,695 Hispanic or Latino race householdersMedian 2022 house value $291,198 White Non-Hispanic householders$295,339 Black or African American householders $304,827 Asian householders$278,605 Some other race householders$276,190 Two or more races householders$297,409 Hispanic or Latino householders
Median age by race in Westchester
57.0 Median age for White residents55.4 57.7 52.9 Median age for Black or African American residents53.0 53.8 29.6 Median age for American Indian / Alaska Native residents-736,736,736.0 -641,399,416.3 47.0 Median age for Asian residents46.5 54.7 -687,999,999.3 Median age for Native Hawaiian / Pacific Islander residents-918,721,460.3 -610,229,276.3 40.5 Median age for Other race residents41.0 40.0 35.8 Median age for Two or more races residents39.8 32.7 59.0 Median age for White alone residents59.0 58.8 33.1 Median age for Hispanic or Latino residents35.0 30.4
Owner/renter occupied households by race in Westchester
House owners and renters - White residents 4,449 97.3% Owner occupied126 2.7% Renter occupiedHouse owners and renters - Black or African American residents 888 68.1% Owner occupied415 31.9% Renter occupiedHouse owners and renters - American Indian / Alaska Native residents 11 100.0% Owner occupiedHouse owners and renters - Asian residents 219 93.8% Owner occupied14 6.2% Renter occupiedHouse owners and renters - Other race residents 252 88.0% Owner occupied34 12.0% Renter occupiedHouse owners and renters - Two or more races residents 650 89.2% Owner occupied79 10.8% Renter occupiedHouse owners and renters - White alone residents 4,381 97.2% Owner occupied127 2.8% Renter occupiedHouse owners and renters - Hispanic or Latino residents 993 93.9% Owner occupied64 6.1% Renter occupied
Language usage in Westchester
English speakers - Total 75.5% of residents of Westchester speak English at home.
13.0% of residents speak Spanish at home 1,670 80.9% Speak English very well395 19.1% Speak English less than very well11.1% of residents speak other language at home 1,062 60.7% Speak English very well689 39.3% Speak English less than very well
English speakers - Born in the United States 87.7% of residents of Westchester speak English at home.
9.9% of residents speak Spanish at home 190 86.4% Speak English very well30 13.6% Speak English less than very well1.8% of residents speak other language at home 41 100.0% Speak English very well
English speakers - Native, born elsewhere 10.9% of residents of Westchester speak English at home.
43.7% of residents speak Spanish at home 52 100.0% Speak English very well45.4% of residents speak other language at home 37 68.5% Speak English very well17 31.5% Speak English less than very well
English speakers - Foreign-born 5.3% of residents of Westchester speak English at home.
37.8% of residents speak Spanish at home 600 69.6% Speak English very well262 30.4% Speak English less than very well57.1% of residents speak other language at home 679 52.2% Speak English very well622 47.8% Speak English less than very well
White (Caucasian) - Speak only English Native:
94.0% (7,670)Foreign-born:
7.2% (73)
White (Caucasian) - Speak another language Native:
7.5% (614)Foreign-born:
92.3% (941)
Black or African American - Speak another language Native:
1.3% (39)Foreign-born:
91.2% (20)
Asian - Speak only English Native:
49.7% (107)Foreign-born:
6.1% (21)
Asian - Speak another language Native:
50.3% (108)Foreign-born:
94.6% (321)
Other race - Speak only English Native:
31.0% (193)Foreign-born:
5.5% (16)
Other race - Speak another language Native:
69.6% (433)Foreign-born:
94.3% (266)
Two or more races - Speak another language Native:
27.2% (284)Foreign-born:
100.0% (487)
White alone - Speak only English Native:
93.1% (7,461)Foreign-born:
7.0% (74)
White alone - Speak another language Native:
6.7% (540)Foreign-born:
93.9% (991)
Hispanic or Latino - Speak only English Native:
52.3% (1,062)Foreign-born:
2.5% (21)
Hispanic or Latino - Speak another language Native:
49.0% (995)Foreign-born:
97.8% (823)
Foreign-born residents in Westchester 2,290 residents are foreign born (5.2% Europe , 5.2% Latin America , 3.0% Asia ).
This city:
14.0%Illinois:
14.1%
Marital status for residents in Westchester Marital status - White (Caucasian) population 15 years and over
Males 27.0% Never married59.4% Now married0.9% Separated3.0% Widowed9.8% DivorcedFemales 21.7% Never married53.5% Now married1.4% Separated13.1% Widowed10.2% DivorcedWomen who gave birth in the past 12 months Now married:
100.0% (47)Unmarried:
0.0% (0)
Women who did not give birth in the past 12 months Now married:
48.7% (682)Unmarried:
51.3% (719)
Marital status - Black or African American population 15 years and over
Males 27.7% Never married57.0% Now married0.0% Separated2.6% Widowed12.7% DivorcedFemales 38.8% Never married33.1% Now married1.1% Separated11.2% Widowed15.9% DivorcedWomen who did not give birth in the past 12 months Now married:
23.0% (159)Unmarried:
77.0% (530)
Marital status - American Indian / Alaska Native population 15 years and over
Males 0.0% Never married100.0% Now married0.0% Separated0.0% Widowed0.0% DivorcedFemales 50.0% Never married50.0% Now married0.0% Separated0.0% Widowed0.0% DivorcedWomen who did not give birth in the past 12 months Now married:
50.0% (11)Unmarried:
50.0% (11)
Marital status - Asian population 15 years and over
Males 44.6% Never married55.4% Now married0.0% Separated0.0% Widowed0.0% DivorcedFemales 19.0% Never married49.6% Now married2.1% Separated15.7% Widowed13.6% DivorcedWomen who did not give birth in the past 12 months Now married:
42.3% (44)Unmarried:
57.7% (61)
Marital status - Other race population 15 years and over
Males 18.5% Never married56.3% Now married0.0% Separated5.6% Widowed19.6% DivorcedFemales 32.0% Never married48.0% Now married2.7% Separated14.4% Widowed2.9% DivorcedWomen who did not give birth in the past 12 months Now married:
56.4% (150)Unmarried:
43.6% (116)
Marital status - Two or more races population 15 years and over
Males 52.0% Never married36.3% Now married8.0% Separated0.0% Widowed3.7% DivorcedFemales 49.4% Never married23.6% Now married2.1% Separated19.9% Widowed5.1% DivorcedWomen who gave birth in the past 12 months Now married:
100.0% (22)Unmarried:
0.0% (0)
Women who did not give birth in the past 12 months Now married:
25.3% (123)Unmarried:
74.7% (365)
Marital status - White alone, not Hispanic / Latino population 15 years and over
Males 27.0% Never married58.3% Now married0.9% Separated3.3% Widowed10.5% DivorcedFemales 21.1% Never married53.4% Now married1.5% Separated14.0% Widowed10.0% DivorcedWomen who gave birth in the past 12 months Now married:
100.0% (38)Unmarried:
0.0% (0)
Women who did not give birth in the past 12 months Now married:
45.9% (565)Unmarried:
54.1% (665)
Marital status - Hispanic or Latino population 15 years and over
Males 35.4% Never married56.8% Now married0.0% Separated1.6% Widowed6.3% DivorcedFemales 37.7% Never married40.7% Now married1.1% Separated13.7% Widowed6.7% DivorcedWomen who gave birth in the past 12 months Now married:
100.0% (31)Unmarried:
0.0% (0)
Women who did not give birth in the past 12 months Now married:
45.2% (417)Unmarried:
54.8% (506)
Ancestries in Westchester
1,109 11.6% Italian897 9.4% Polish539 5.7% Irish386 4.1% German301 3.2% American220 2.3% Greek132 1.4% Serbian131 1.4% English106 1.1% Armenian98 1.0% Slovene93 1.0% European86 0.9% Czech63 0.7% Dutch59 0.6% Turkish39 0.4% Croatian35 0.4% Lithuanian32 0.3% African31 0.3% Eastern European31 0.3% Iranian29 0.3% Romanian27 0.3% Scottish23 0.2% Yugoslavian20 0.2% Slovak18 0.2% Swedish17 0.2% Egyptian17 0.2% Albanian14 0.1% Russian14 0.1% Ukrainian11 0.1% French5 0.05% Scotch-Irish5 0.05% Ugandan4 0.04% Bulgarian4 0.04% Hungarian3 0.03% Norwegian3 0.03% Danish
Geographical mobility in Westchester Same house 1 year ago 8,755 93.7% White (Caucasian)2,968 95.9% Black or African American39 98.7% American Indian / Alaska Native537 96.1% Asian893 94.8% Other race1,424 88.5% Two or more races8,638 93.6% White alone, not Hispanic / Latino2,941 94.9% Hispanic or LatinoMoved within same county 232 2.5% White / Caucasian129 4.2% Black or African American17 3.0% Asian21 2.3% Other race146 9.1% Two or more races238 2.6% White alone, not Hispanic / Latino91 2.9% Hispanic or LatinoMoved within same state 156 1.7% White / Caucasian17 1.1% Two or more races152 1.7% White alone, not Hispanic / Latino31 1.0% Hispanic or LatinoMoved from different state 149 1.6% White / Caucasian8 0.3% Black or African American29 3.1% Other race153 1.7% White alone, not Hispanic / Latino40 1.3% Hispanic or LatinoMoved from abroad 11 0.1% White12 0.1% White alone, not Hispanic / Latino
Children Nativity (place of birth) in Westchester
Children under 6 years - Living with two parents Both parents native 381 100.0% NativeBoth parents foreign-born 43 100.0% NativeOne native, one foreign-born parent 59 100.0% NativeChildren under 6 years - Living with one parent Native parent 120 100.0% NativeChildren 6 to 17 years - Living with two parents Both parents native 1,019 100.0% NativeBoth parents foreign-born 70 100.0% NativeOne native, one foreign-born parent 61 100.0% NativeChildren 6 to 17 years - Living with one parent Native parent 428 100.0% NativeForeign-born parent 76 54.5% Native63 45.5% Foreign-born
Grandparents responsible for own grandchildren in Westchester
Grandparents (30 to 59 years) White / Caucasian 24 100.0% Not responsible for grandchildrenWhite alone, not Hispanic / Latino 8 100.0% Not responsible for grandchildrenHispanic or Latino 24 100.0% Not responsible for grandchildren
Grandparents (60 years and over) White / Caucasian 5 3.6% Responsible for grandchildren121 96.4% Not responsible for grandchildrenWhite alone, not Hispanic / Latino 6 3.4% Responsible for grandchildren156 96.6% Not responsible for grandchildrenHispanic or Latino 11 100.0% Not responsible for grandchildren