Races in West Orange, New Jersey (NJ) Detailed Stats
Ancestries, Foreign-born residents, place of birth

Recent posts about races in West Orange, New Jersey on our local forum with over 2,400,000 registered users:
 | There goes the neighborhood (West Orange) (32 replies) |
| West Orange pleasantdale area? (24 replies) |
| Pleasantdale West Orange Nj opinions (15 replies) |
| Looking to buy a single family house in West Orange,Need advice please. (32 replies) |
| Buying a house in NJ with Lively Indian community (19 replies) |
| Is it possible to reduce the size of a house? (7 replies) |
25.6% of West Orange, NJ residents are foreign-born (10.8% born in Latin America, 7.0% born in Asia, 5.7% born in Europe), which is 10.0% greater than the foreign-born rate of 23.0% across the entire state of New Jersey.
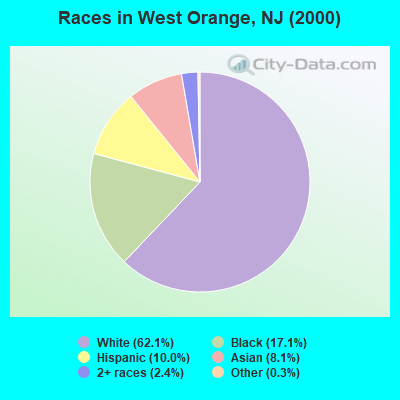
Race distribution in West Orange

- 27,90762.1%White alone
- 7,67217.1%Black alone
- 4,51410.0%Hispanic
- 3,6198.1%Asian alone
- 1,0602.4%Two or more races
- 1200.3%Other race alone
- 380.08%American Indian alone
- 130.03%Native Hawaiian and Other
Pacific Islander alone
2000
2022
-
- 5,557,20966.0%White alone
- 1,117,19113.3%Hispanic
- 1,096,17113.0%Black alone
- 477,0125.7%Asian alone
- 133,6891.6%Two or more races
- 19,5650.2%Other race alone
- 11,3380.1%American Indian alone
- 2,1750.03%Native Hawaiian and Other
Pacific Islander alone

-
- 4,766,47651.5%White alone
- 2,028,47021.9%Hispanic
- 1,111,63212.0%Black alone
- 923,54610.0%Asian alone
- 332,2373.6%Two or more races
- 89,8471.0%Other race alone
- 8,5570.09%American Indian alone
- 9340.01%Native Hawaiian and Other
Pacific Islander alone

Income and house value in West Orange
- Median household income in 2022
- $128,612White non-Hispanic householders
- $109,900Black householders
- over $200,000American Indian and Alaska Native householders
- over $200,000Asian householders
- $90,387Some other race householders
- $101,280Two or more races householders
- $83,283Hispanic or Latino race householders
- Median 2022 house value
- $567,270White Non-Hispanic householders
- $501,443Black or African American householders
- $423,027American Indian or Alaska Native householders
- $535,012Asian householders
- $420,929Some other race householders
- $426,174Two or more races householders
- $464,202Hispanic or Latino householders
Household income for White non-Hispanic householders

Household income for Black householders

Household income for American Indian and Alaska Native householders

Household income for Asian householders

Household income for Two or more races householders

Household income for Hispanic or Latino race householders

Foreign-born residents in West Orange
11,483 residents are foreign born (10.8% Latin America, 7.0% Asia, 5.7% Europe).
| This city: | 25.6% |
| New Jersey: | 17.5% |
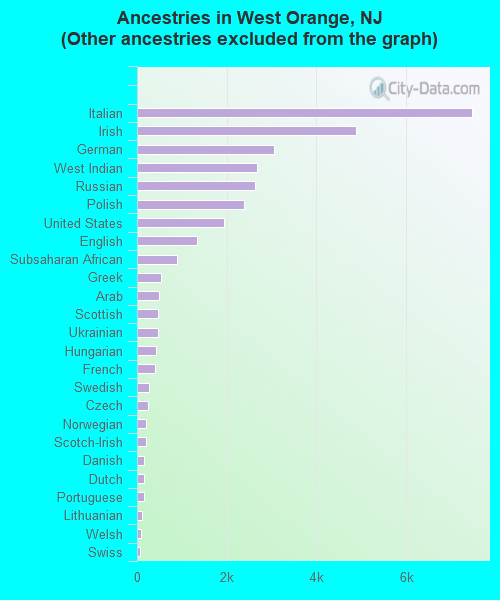
Ancestries in West Orange

- 15,69333.0%Other
- 7,47415.7%Italian
- 4,88910.3%Irish
- 3,0636.4%German
- 2,6745.6%West Indian
- 2,6205.5%Russian
- 2,3945.0%Polish
- 1,9444.1%United States
- 1,3382.8%English
- 8931.9%Subsaharan African
- 5291.1%Greek
- 5001.1%Arab
- 4681.0%Scottish
- 4671.0%Ukrainian
- 4320.9%Hungarian
- 4060.9%French
- 2770.6%Swedish
- 2420.5%Czech
- 2100.4%Norwegian
- 2030.4%Scotch-Irish
- 1620.3%Danish
- 1590.3%Dutch
- 1520.3%Portuguese
- 1130.2%Lithuanian
- 860.2%Welsh
- 720.2%Swiss
- 700.1%Slovak
- 480.1%French Canadian
Zip codes: 07052.