Races in West New York, New Jersey (NJ) Detailed Stats
Data:
Races - White alone (%)
Races - White alone (% change since 2000)
Races - Black alone (%)
Races - Black alone (% change since 2000)
Races - American Indian alone (%)
Races - American Indian alone (% change since 2000)
Races - Asian alone (%)
Races - Asian alone (% change since 2000)
Races - Hispanic (%)
Races - Hispanic (% change since 2000)
Races - Native Hawaiian and Other Pacific Islander alone (%)
Races - Native Hawaiian and Other Pacific Islander alone (% change since 2000)
Races - Two or more races(%)
Races - Two or more races(% change since 2000)
Races - Other race alone (%)
Races - Other race alone (% change since 2000)
Racial diversity
Place of birth - Born in state of residence (%)
Place of birth - Born in state of residence (%) - White
Place of birth - Born in state of residence (%) - Black or African American
Place of birth - Born in state of residence (%) - Asian
Place of birth - Born in state of residence (%) - Hispanic or Latino
Place of birth - Born in state of residence (%) - American Indian and Alaska Native
Place of birth - Born in state of residence (%) - Multirace
Place of birth - Born in state of residence (%) - Other Race
Place of birth - Born in other state (%)
Place of birth - Born in other state (%) - White
Place of birth - Born in other state (%) - Black or African American
Place of birth - Born in other state (%) - Asian
Place of birth - Born in other state (%) - Hispanic or Latino
Place of birth - Born in other state (%) - American Indian and Alaska Native
Place of birth - Born in other state (%) - Multirace
Place of birth - Born in other state (%) - Other Race
Place of birth - Native, outside of US (%)
Place of birth - Native, outside of US (%) - White
Place of birth - Native, outside of US (%) - Black or African American
Place of birth - Native, outside of US (%) - Asian
Place of birth - Native, outside of US (%) - Hispanic or Latino
Place of birth - Native, outside of US (%) - American Indian and Alaska Native
Place of birth - Native, outside of US (%) - Multirace
Place of birth - Native, outside of US (%) - Other Race
Place of birth - Foreign born (%)
Place of birth - Foreign born (%) - White
Place of birth - Foreign born (%) - Black or African American
Place of birth - Foreign born (%) - Asian
Place of birth - Foreign born (%) - Hispanic or Latino
Place of birth - Foreign born (%) - American Indian and Alaska Native
Place of birth - Foreign born (%) - Multirace
Place of birth - Foreign born (%) - Other Race
Residents speaking English at home (%)
Residents speaking English at home - Born in the United States (%)
Residents speaking English at home - Native, born elsewhere (%)
Residents speaking English at home - Foreign born (%)
Residents speaking Spanish at home (%)
Residents speaking Spanish at home - Born in the United States (%)
Residents speaking Spanish at home - Native, born elsewhere (%)
Residents speaking Spanish at home - Foreign born (%)
Residents speaking other language at home (%)
Residents speaking other language at home - Born in the United States (%)
Residents speaking other language at home - Native, born elsewhere (%)
Residents speaking other language at home - Foreign born (%)
Marital status - Never married (%)
Marital status - Now married (%)
Marital status - Separated (%)
Marital status - Widowed (%)
Marital status - Divorced (%)
Ancestries Reported - Arab (%)
Ancestries Reported - Czech (%)
Ancestries Reported - Danish (%)
Ancestries Reported - Dutch (%)
Ancestries Reported - English (%)
Ancestries Reported - French (%)
Ancestries Reported - French Canadian (%)
Ancestries Reported - German (%)
Ancestries Reported - Greek (%)
Ancestries Reported - Hungarian (%)
Ancestries Reported - Irish (%)
Ancestries Reported - Italian (%)
Ancestries Reported - Lithuanian (%)
Ancestries Reported - Norwegian (%)
Ancestries Reported - Polish (%)
Ancestries Reported - Portuguese (%)
Ancestries Reported - Russian (%)
Ancestries Reported - Scotch-Irish (%)
Ancestries Reported - Scottish (%)
Ancestries Reported - Slovak (%)
Ancestries Reported - Subsaharan African (%)
Ancestries Reported - Swedish (%)
Ancestries Reported - Swiss (%)
Ancestries Reported - Ukrainian (%)
Ancestries Reported - United States (%)
Ancestries Reported - Welsh (%)
Ancestries Reported - West Indian (%)
Ancestries Reported - Other (%)
Geographical mobility - Same house 1 year ago (%)
Geographical mobility - Same house 1 year ago (%) - White
Geographical mobility - Same house 1 year ago (%) - Black or African American
Geographical mobility - Same house 1 year ago (%) - Asian
Geographical mobility - Same house 1 year ago (%) - Hispanic or Latino
Geographical mobility - Same house 1 year ago (%) - American Indian and Alaska Native
Geographical mobility - Same house 1 year ago (%) - Multirace
Geographical mobility - Same house 1 year ago (%) - Other Race
Geographical mobility - Moved within same county (%)
Geographical mobility - Moved within same county (%) - White
Geographical mobility - Moved within same county (%) - Black or African American
Geographical mobility - Moved within same county (%) - Asian
Geographical mobility - Moved within same county (%) - Hispanic or Latino
Geographical mobility - Moved within same county (%) - American Indian and Alaska Native
Geographical mobility - Moved within same county (%) - Multirace
Geographical mobility - Moved within same county (%) - Other Race
Geographical mobility - Moved from different county within same state (%)
Geographical mobility - Moved from different county within same state (%) - White
Geographical mobility - Moved from different county within same state (%) - Black or African American
Geographical mobility - Moved from different county within same state (%) - Asian
Geographical mobility - Moved from different county within same state (%) - Hispanic or Latino
Geographical mobility - Moved from different county within same state (%) - American Indian and Alaska Native
Geographical mobility - Moved from different county within same state (%) - Multirace
Geographical mobility - Moved from different county within same state (%) - Other Race
Geographical mobility - Moved from different state (%)
Geographical mobility - Moved from different state (%) - White
Geographical mobility - Moved from different state (%) - Black or African American
Geographical mobility - Moved from different state (%) - Asian
Geographical mobility - Moved from different state (%) - Hispanic or Latino
Geographical mobility - Moved from different state (%) - American Indian and Alaska Native
Geographical mobility - Moved from different state (%) - Multirace
Geographical mobility - Moved from different state (%) - Other Race
Geographical mobility - Moved from abroad (%)
Geographical mobility - Moved from abroad (%) - White
Geographical mobility - Moved from abroad (%) - Black or African American
Geographical mobility - Moved from abroad (%) - Asian
Geographical mobility - Moved from abroad (%) - Hispanic or Latino
Geographical mobility - Moved from abroad (%) - American Indian and Alaska Native
Geographical mobility - Moved from abroad (%) - Multirace
Geographical mobility - Moved from abroad (%) - Other Race
Place of birth for the foreign-born population - Ireland (%)
Place of birth for the foreign-born population - Denmark (%)
Place of birth for the foreign-born population - Norway (%)
Place of birth for the foreign-born population - Sweden (%)
Place of birth for the foreign-born population - United Kingdom (%)
Place of birth for the foreign-born population - England (%)
Place of birth for the foreign-born population - Scotland (%)
Place of birth for the foreign-born population - Other Northern Europe (%)
Place of birth for the foreign-born population - Austria (%)
Place of birth for the foreign-born population - Belgium (%)
Place of birth for the foreign-born population - France (%)
Place of birth for the foreign-born population - Germany (%)
Place of birth for the foreign-born population - Netherlands (%)
Place of birth for the foreign-born population - Switzerland (%)
Place of birth for the foreign-born population - Other Western Europe (%)
Place of birth for the foreign-born population - Greece (%)
Place of birth for the foreign-born population - Italy (%)
Place of birth for the foreign-born population - Portugal (%)
Place of birth for the foreign-born population - Spain (%)
Place of birth for the foreign-born population - Other Southern Europe (%)
Place of birth for the foreign-born population - Albania (%)
Place of birth for the foreign-born population - Belarus (%)
Place of birth for the foreign-born population - Bosnia and Herzegovina (%)
Place of birth for the foreign-born population - Bulgaria (%)
Place of birth for the foreign-born population - Croatia (%)
Place of birth for the foreign-born population - Czechoslovakia (%)
Place of birth for the foreign-born population - Hungary (%)
Place of birth for the foreign-born population - Latvia (%)
Place of birth for the foreign-born population - Lithuania (%)
Place of birth for the foreign-born population - North Macedonia (Macedonia) (%)
Place of birth for the foreign-born population - Moldova (%)
Place of birth for the foreign-born population - Poland (%)
Place of birth for the foreign-born population - Romania (%)
Place of birth for the foreign-born population - Russia (%)
Place of birth for the foreign-born population - Serbia (%)
Place of birth for the foreign-born population - Ukraine (%)
Place of birth for the foreign-born population - Other Eastern Europe (%)
Place of birth for the foreign-born population - China (%)
Place of birth for the foreign-born population - Hong Kong (%)
Place of birth for the foreign-born population - Taiwan (%)
Place of birth for the foreign-born population - Japan (%)
Place of birth for the foreign-born population - Korea (%)
Place of birth for the foreign-born population - Other Eastern Asia (%)
Place of birth for the foreign-born population - Afghanistan (%)
Place of birth for the foreign-born population - Bangladesh (%)
Place of birth for the foreign-born population - India (%)
Place of birth for the foreign-born population - Iran (%)
Place of birth for the foreign-born population - Kazakhstan (%)
Place of birth for the foreign-born population - Nepal (%)
Place of birth for the foreign-born population - Pakistan (%)
Place of birth for the foreign-born population - Sri Lanka (%)
Place of birth for the foreign-born population - Uzbekistan (%)
Place of birth for the foreign-born population - Other South Central Asia (%)
Place of birth for the foreign-born population - Burma (%)
Place of birth for the foreign-born population - Cambodia (%)
Place of birth for the foreign-born population - Indonesia (%)
Place of birth for the foreign-born population - Laos (%)
Place of birth for the foreign-born population - Malaysia (%)
Place of birth for the foreign-born population - Philippines (%)
Place of birth for the foreign-born population - Singapore (%)
Place of birth for the foreign-born population - Thailand (%)
Place of birth for the foreign-born population - Vietnam (%)
Place of birth for the foreign-born population - Other South Eastern Asia (%)
Place of birth for the foreign-born population - Armenia (%)
Place of birth for the foreign-born population - Iraq (%)
Place of birth for the foreign-born population - Israel (%)
Place of birth for the foreign-born population - Jordan (%)
Place of birth for the foreign-born population - Kuwait (%)
Place of birth for the foreign-born population - Lebanon (%)
Place of birth for the foreign-born population - Saudi Arabia (%)
Place of birth for the foreign-born population - Syria (%)
Place of birth for the foreign-born population - Turkey (%)
Place of birth for the foreign-born population - Yemen (%)
Place of birth for the foreign-born population - Other Western Asia (%)
Place of birth for the foreign-born population - Eritrea (%)
Place of birth for the foreign-born population - Ethiopia (%)
Place of birth for the foreign-born population - Kenya (%)
Place of birth for the foreign-born population - Somalia (%)
Place of birth for the foreign-born population - Uganda (%)
Place of birth for the foreign-born population - Zimbabwe (%)
Place of birth for the foreign-born population - Other Eastern Africa (%)
Place of birth for the foreign-born population - Cameroon (%)
Place of birth for the foreign-born population - Congo (%)
Place of birth for the foreign-born population - Democratic Republic of Congo (Zaire) (%)
Place of birth for the foreign-born population - Other Middle Africa (%)
Place of birth for the foreign-born population - Egypt (%)
Place of birth for the foreign-born population - Morocco (%)
Place of birth for the foreign-born population - Sudan (%)
Place of birth for the foreign-born population - Other Northern Africa (%)
Place of birth for the foreign-born population - South Africa (%)
Place of birth for the foreign-born population - Other Southern Africa (%)
Place of birth for the foreign-born population - Cabo Verde (%)
Place of birth for the foreign-born population - Ghana (%)
Place of birth for the foreign-born population - Liberia (%)
Place of birth for the foreign-born population - Nigeria (%)
Place of birth for the foreign-born population - Senegal (%)
Place of birth for the foreign-born population - Sierra Leone (%)
Place of birth for the foreign-born population - Other Western Africa (%)
Place of birth for the foreign-born population - Australia (%)
Place of birth for the foreign-born population - New Zealand (%)
Place of birth for the foreign-born population - Fiji (%)
Place of birth for the foreign-born population - Micronesia (%)
Place of birth for the foreign-born population - Bahamas (%)
Place of birth for the foreign-born population - Barbados (%)
Place of birth for the foreign-born population - Cuba (%)
Place of birth for the foreign-born population - Dominica (%)
Place of birth for the foreign-born population - Dominican Republic (%)
Place of birth for the foreign-born population - Grenada (%)
Place of birth for the foreign-born population - Haiti (%)
Place of birth for the foreign-born population - Jamaica (%)
Place of birth for the foreign-born population - St. Vincent and the Grenadines (%)
Place of birth for the foreign-born population - Trinidad and Tobago (%)
Place of birth for the foreign-born population - West Indies (%)
Place of birth for the foreign-born population - Other Caribbean (%)
Place of birth for the foreign-born population - Belize (%)
Place of birth for the foreign-born population - Costa Rica (%)
Place of birth for the foreign-born population - El Salvador (%)
Place of birth for the foreign-born population - Guatemala (%)
Place of birth for the foreign-born population - Honduras (%)
Place of birth for the foreign-born population - Mexico (%)
Place of birth for the foreign-born population - Nicaragua (%)
Place of birth for the foreign-born population - Panama (%)
Place of birth for the foreign-born population - Other Central America (%)
Place of birth for the foreign-born population - Argentina (%)
Place of birth for the foreign-born population - Bolivia (%)
Place of birth for the foreign-born population - Brazil (%)
Place of birth for the foreign-born population - Chile (%)
Place of birth for the foreign-born population - Colombia (%)
Place of birth for the foreign-born population - Ecuador (%)
Place of birth for the foreign-born population - Guyana (%)
Place of birth for the foreign-born population - Peru (%)
Place of birth for the foreign-born population - Uruguay (%)
Place of birth for the foreign-born population - Venezuela (%)
Place of birth for the foreign-born population - Other South America (%)
Place of birth for the foreign-born population - Canada (%)
Place of birth for the foreign-born population - Other Northern America (%)
Place of birth for the foreign-born population - Other (%)
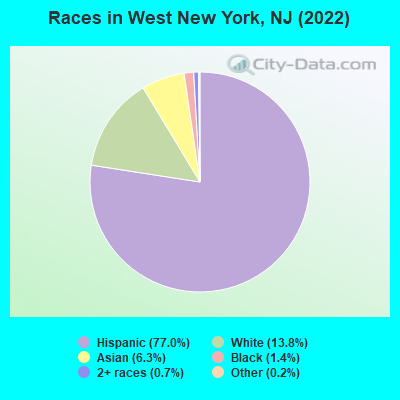
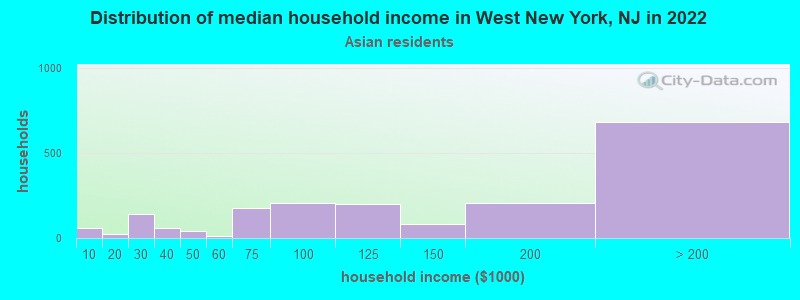
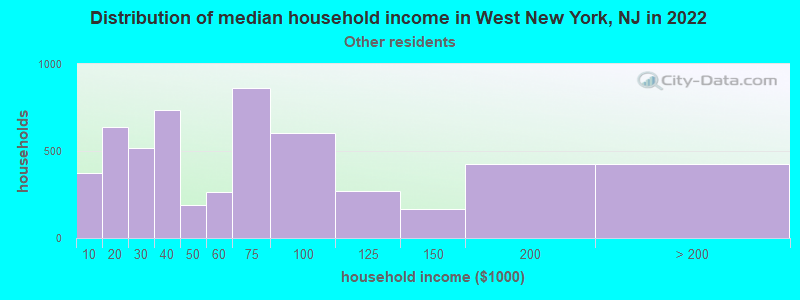
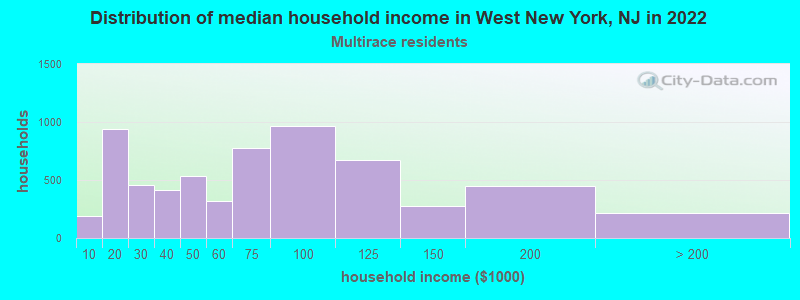
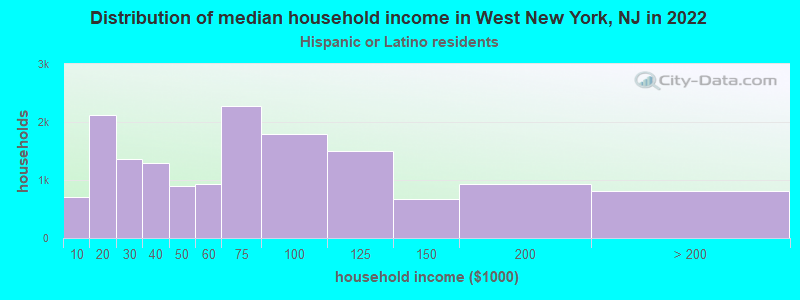
According to 2022 data, the most numerous races in West New York, NJ are White alone (7,133 residents), Hispanic (39,911 residents), and Black alone (744 residents). 23.8% of West New York residents speak English at home. 60.8% of West New York, NJ residents are foreign-born (50.2% born in Latin America, 6.1% born in Asia), which is 62.2% greater than the foreign-born rate of 23.0% across the entire state of New Jersey.
Race distribution in West New York
2000 2022
5,557,209 66.0% White alone 1,117,191 13.3% Hispanic 1,096,171 13.0% Black alone 477,012 5.7% Asian alone 133,689 1.6% Two or more races 19,565 0.2% Other race alone 11,338 0.1% American Indian alone 2,175 0.03% Native Hawaiian and Other
4,766,476 51.5% White alone 2,028,470 21.9% Hispanic 1,111,632 12.0% Black alone 923,546 10.0% Asian alone 332,237 3.6% Two or more races 89,847 1.0% Other race alone 8,557 0.09% American Indian alone 934 0.01% Native Hawaiian and Other
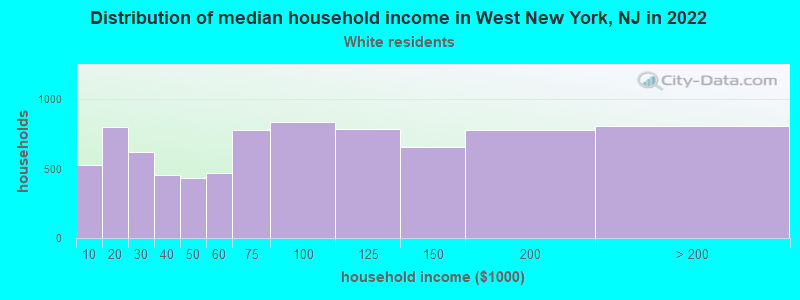
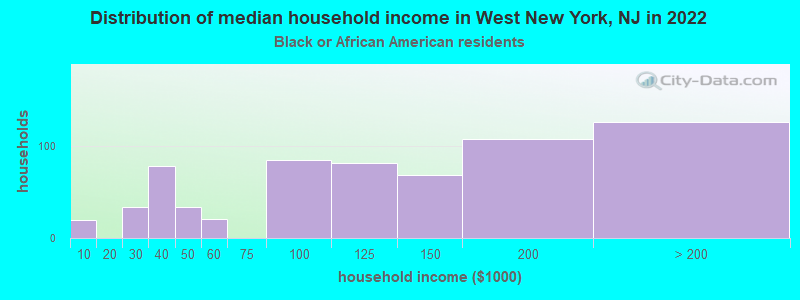
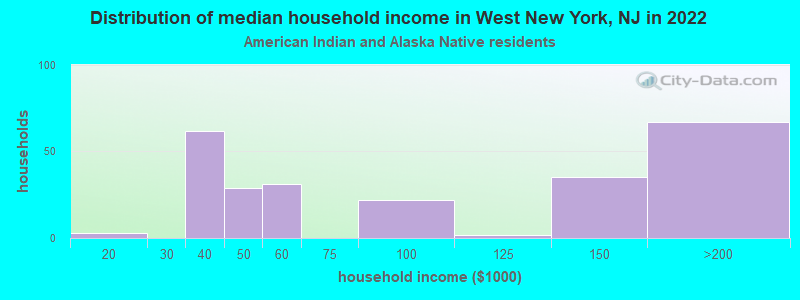
Income and house value in West New York Median household income in 2022 $98,484 White non-Hispanic householders$131,642 Black householders$138,357 Asian householders$59,696 Some other race householders$62,795 Two or more races householders$59,994 Hispanic or Latino race householdersMedian 2022 house value $850,013 White Non-Hispanic householdersover $1,000,000 Black or African American householders over $1,000,000 Asian householders$411,465 Some other race householders$423,183 Two or more races householders$422,663 Hispanic or Latino householders
Median age by race in West New York
39.5 Median age for White residents38.1 40.7 33.4 Median age for Black or African American residents33.0 33.5 38.0 Median age for American Indian / Alaska Native residents35.2 40.8 37.9 Median age for Asian residents37.5 39.6 -804,177,544.9 Median age for Native Hawaiian / Pacific Islander residents-860,335,194.7 -713,070,378.3 31.4 Median age for Other race residents31.1 31.5 43.9 Median age for Two or more races residents42.8 45.8 37.7 Median age for White alone residents36.7 39.8 37.8 Median age for Hispanic or Latino residents37.0 39.1
Owner/renter occupied households by race in West New York
House owners and renters - White residents 2,108 25.8% Owner occupied6,064 74.2% Renter occupiedHouse owners and renters - Black or African American residents 260 39.0% Owner occupied407 61.0% Renter occupiedHouse owners and renters - American Indian / Alaska Native residents 238 100.0% Renter occupiedHouse owners and renters - Asian residents 770 40.9% Owner occupied1,113 59.1% Renter occupiedHouse owners and renters - Other race residents 888 16.6% Owner occupied4,455 83.4% Renter occupiedHouse owners and renters - Two or more races residents 1,267 20.6% Owner occupied4,889 79.4% Renter occupiedHouse owners and renters - White alone residents 1,320 35.1% Owner occupied2,443 64.9% Renter occupiedHouse owners and renters - Hispanic or Latino residents 2,837 18.4% Owner occupied12,613 81.6% Renter occupied
Language usage in West New York
English speakers - Total 23.8% of residents of West New York speak English at home.
65.9% of residents speak Spanish at home 14,181 43.3% Speak English very well18,540 56.7% Speak English less than very well9.0% of residents speak other language at home 3,289 74.0% Speak English very well1,155 26.0% Speak English less than very well
English speakers - Born in the United States 63.0% of residents of West New York speak English at home.
28.2% of residents speak Spanish at home 1,359 86.4% Speak English very well214 13.6% Speak English less than very well7.1% of residents speak other language at home 396 100.0% Speak English very well
English speakers - Native, born elsewhere 17.9% of residents of West New York speak English at home.
75.4% of residents speak Spanish at home 509 60.5% Speak English very well332 39.5% Speak English less than very well4.2% of residents speak other language at home 47 100.0% Speak English very well
English speakers - Foreign-born 10.3% of residents of West New York speak English at home.
77.8% of residents speak Spanish at home 6,364 27.4% Speak English very well16,898 72.6% Speak English less than very well12.3% of residents speak other language at home 2,505 68.3% Speak English very well1,165 31.7% Speak English less than very well
White (Caucasian) - Speak only English Native:
59.0% (4,868)Foreign-born:
14.0% (923)
White (Caucasian) - Speak another language Native:
31.7% (2,618)Foreign-born:
82.6% (5,450)
Black or African American - Speak only English Native:
77.1% (839)Foreign-born:
8.2% (26)
Black or African American - Speak another language Native:
16.1% (175)Foreign-born:
80.1% (251)
American Indian / Alaska Native - Speak only English Native:
21.4% (57)Foreign-born:
15.3% (162)
American Indian / Alaska Native - Speak another language Native:
40.9% (109)Foreign-born:
82.2% (867)
Asian - Speak only English Native:
66.5% (356)Foreign-born:
13.5% (368)
Asian - Speak another language Native:
36.0% (193)Foreign-born:
86.5% (2,364)
Other race - Speak only English Native:
19.0% (1,052)Foreign-born:
12.9% (1,381)
Other race - Speak another language Native:
81.6% (4,518)Foreign-born:
87.5% (9,344)
Two or more races - Speak only English Native:
35.3% (1,470)Foreign-born:
6.7% (656)
Two or more races - Speak another language Native:
59.6% (2,481)Foreign-born:
92.8% (9,080)
White alone - Speak only English Native:
77.5% (3,811)Foreign-born:
23.5% (420)
White alone - Speak another language Native:
22.1% (1,085)Foreign-born:
75.9% (1,358)
Hispanic or Latino - Speak only English Native:
29.5% (3,803)Foreign-born:
9.6% (2,422)
Hispanic or Latino - Speak another language Native:
69.3% (8,931)Foreign-born:
91.0% (23,000)
Foreign-born residents in West New York 31,500 residents are foreign born (50.2% Latin America , 6.1% Asia ).
This city:
60.8%New Jersey:
23.2%
Marital status for residents in West New York Marital status - White (Caucasian) population 15 years and over
Males 42.3% Never married42.6% Now married3.5% Separated2.7% Widowed8.8% DivorcedFemales 32.9% Never married38.5% Now married3.4% Separated11.1% Widowed14.2% DivorcedWomen who gave birth in the past 12 months Now married:
60.4% (128)Unmarried:
39.6% (84)
Women who did not give birth in the past 12 months Now married:
39.4% (1,478)Unmarried:
60.6% (2,274)
Marital status - Black or African American population 15 years and over
Males 39.2% Never married42.1% Now married0.0% Separated0.0% Widowed18.7% DivorcedFemales 49.8% Never married30.2% Now married0.0% Separated8.5% Widowed11.5% DivorcedWomen who did not give birth in the past 12 months Now married:
17.4% (70)Unmarried:
82.6% (334)
Marital status - American Indian / Alaska Native population 15 years and over
Males 63.9% Never married30.3% Now married5.8% Separated0.0% Widowed0.0% DivorcedFemales 77.0% Never married23.0% Now married0.0% Separated0.0% Widowed0.0% DivorcedWomen who did not give birth in the past 12 months Now married:
27.9% (71)Unmarried:
72.1% (184)
Marital status - Asian population 15 years and over
Males 21.7% Never married72.2% Now married0.0% Separated1.9% Widowed4.3% DivorcedFemales 25.5% Never married58.7% Now married0.9% Separated1.9% Widowed13.0% DivorcedWomen who gave birth in the past 12 months Now married:
97.7% (85)Unmarried:
2.3% (2)
Women who did not give birth in the past 12 months Now married:
56.5% (673)Unmarried:
43.5% (518)
Marital status - Other race population 15 years and over
Males 50.6% Never married38.5% Now married2.6% Separated0.4% Widowed7.9% DivorcedFemales 42.1% Never married33.0% Now married7.7% Separated4.9% Widowed12.3% DivorcedWomen who gave birth in the past 12 months Now married:
23.4% (47)Unmarried:
76.6% (153)
Women who did not give birth in the past 12 months Now married:
37.7% (1,527)Unmarried:
62.3% (2,525)
Marital status - Two or more races population 15 years and over
Males 46.5% Never married44.5% Now married3.2% Separated0.7% Widowed5.1% DivorcedFemales 27.3% Never married39.6% Now married5.9% Separated9.1% Widowed18.1% DivorcedWomen who gave birth in the past 12 months Now married:
100.0% (156)Unmarried:
0.0% (0)
Women who did not give birth in the past 12 months Now married:
48.0% (1,511)Unmarried:
52.0% (1,636)
Marital status - White alone, not Hispanic / Latino population 15 years and over
Males 41.6% Never married41.0% Now married3.5% Separated4.5% Widowed9.5% DivorcedFemales 37.9% Never married38.8% Now married1.2% Separated9.9% Widowed12.1% DivorcedWomen who gave birth in the past 12 months Now married:
87.3% (99)Unmarried:
12.7% (14)
Women who did not give birth in the past 12 months Now married:
42.0% (678)Unmarried:
58.0% (935)
Marital status - Hispanic or Latino population 15 years and over
Males 46.3% Never married42.4% Now married3.2% Separated1.0% Widowed7.1% DivorcedFemales 34.2% Never married36.4% Now married5.7% Separated8.6% Widowed15.1% DivorcedWomen who gave birth in the past 12 months Now married:
50.9% (221)Unmarried:
49.1% (213)
Women who did not give birth in the past 12 months Now married:
39.1% (3,580)Unmarried:
60.9% (5,570)
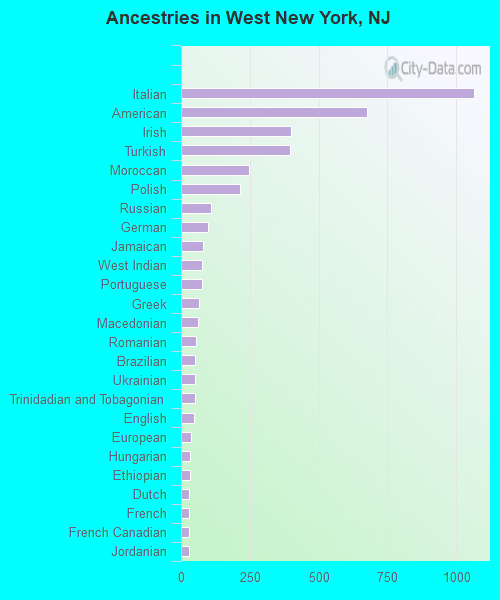
Ancestries in West New York
1,066 2.9% Italian677 1.9% American398 1.1% Irish396 1.1% Turkish247 0.7% Moroccan216 0.6% Polish108 0.3% Russian99 0.3% German80 0.2% Jamaican78 0.2% West Indian78 0.2% Portuguese67 0.2% Greek62 0.2% Macedonian55 0.2% Romanian51 0.1% Brazilian51 0.1% Ukrainian51 0.1% Trinidadian and Tobagonian47 0.1% English37 0.1% European32 0.09% Hungarian32 0.09% Ethiopian30 0.08% Dutch30 0.08% French30 0.08% French Canadian29 0.08% Jordanian25 0.07% Egyptian22 0.06% Eastern European21 0.06% Scotch-Irish18 0.05% New Zealander16 0.04% Haitian15 0.04% Croatian15 0.04% Iranian14 0.04% Finnish14 0.04% Canadian13 0.04% Scandinavian12 0.03% Scottish11 0.03% Belgian10 0.03% Slovak9 0.02% Lithuanian8 0.02% Syrian7 0.02% British7 0.02% Lebanese6 0.02% Australian5 0.01% Norwegian
Geographical mobility in West New York Same house 1 year ago 14,861 89.7% White (Caucasian)1,376 93.6% Black or African American790 71.2% American Indian / Alaska Native2,422 71.9% Asian14,473 85.7% Other race13,023 90.9% Two or more races6,189 88.3% White alone, not Hispanic / Latino35,463 89.5% Hispanic or LatinoMoved within same county 681 4.1% White / Caucasian321 29.0% American Indian / Alaska Native287 8.5% Asian1,676 9.9% Other race616 4.3% Two or more races308 4.4% White alone, not Hispanic / Latino2,486 6.3% Hispanic or LatinoMoved within same state 205 1.2% White / Caucasian5 0.3% Black or African American32 2.9% American Indian / Alaska Native103 3.0% Asian159 0.9% Other race204 1.4% Two or more races56 0.8% White alone, not Hispanic / Latino497 1.3% Hispanic or LatinoMoved from different state 221 1.3% White / Caucasian150 10.2% Black or African American32 2.9% American Indian / Alaska Native207 6.2% Asian329 1.9% Other race158 1.1% Two or more races175 2.5% White alone, not Hispanic / Latino574 1.4% Hispanic or LatinoMoved from abroad 225 1.4% White329 9.8% Asian176 1.0% Other race301 2.1% Two or more races271 3.9% White alone, not Hispanic / Latino430 1.1% Hispanic or Latino
Children Nativity (place of birth) in West New York
Children under 6 years - Living with two parents Both parents native 222 98.8% Native3 1.2% Foreign-bornBoth parents foreign-born 822 88.8% Native103 11.2% Foreign-bornOne native, one foreign-born parent 165 100.0% NativeChildren under 6 years - Living with one parent Native parent 318 95.4% Native15 4.6% Foreign-bornForeign-born parent 897 96.6% Native32 3.4% Foreign-bornChildren 6 to 17 years - Living with two parents Both parents native 617 100.0% NativeBoth parents foreign-born 1,889 71.8% Native743 28.2% Foreign-bornOne native, one foreign-born parent 307 95.9% Native13 4.1% Foreign-bornChildren 6 to 17 years - Living with one parent Native parent 369 100.0% NativeForeign-born parent 2,202 61.6% Native1,370 38.4% Foreign-born
Place of birth for residents in West New York 26,785 Americas26,758 Latin America11,283 Caribbean8,434 Central America7,040 South America3,259 Asia1,561 Eastern Asia1,092 Europe794 China790 South Central Asia545 Eastern Europe431 South Eastern Asia384 Western Asia319 Africa315 Southern Europe254 Northern Africa141 Northern Europe90 Western Europe42 Oceania42 Australia and New Zealand Subregion37 Southern Africa27 Eastern Africa27 Northern America5,827 Dominican Republic5,378 Cuba2,827 El Salvador2,737 Colombia2,541 Ecuador2,535 Mexico1,549 Guatemala1,440 Honduras722 China716 India624 Peru572 Venezuela528 Korea307 Turkey265 Philippines238 Japan209 Argentina206 Brazil200 Russia176 Morocco167 Spain125 Chile117 Italy105 Belarus95 United Kingdom70 Thailand69 Vietnam61 Costa Rica56 Ukraine51 Romania47 Taiwan47 North Macedonia (Macedonia)46 Algeria45 France39 Haiti38 Croatia37 Trinidad and Tobago37 Germany37 South Africa29 Portugal28 Jordan28 Ireland27 Kazakhstan27 Canada26 Singapore25 Ethiopia25 Australia24 Hungary23 Hong Kong23 Bolivia20 Nicaragua20 Poland19 Lebanon17 Nepal17 New Zealand16 Pakistan13 Saudi Arabia13 Iran12 Israel7 Belgium2 Kenya
Grandparents responsible for own grandchildren in West New York
Grandparents (30 to 59 years) White / Caucasian 75 100.0% Not responsible for grandchildrenAsian 114 100.0% Not responsible for grandchildrenOther race 103 16.6% Responsible for grandchildren520 83.4% Not responsible for grandchildrenTwo or more races 26 18.2% Responsible for grandchildren117 81.8% Not responsible for grandchildrenHispanic or Latino 89 15.5% Responsible for grandchildren486 84.5% Not responsible for grandchildrenGrandparents (60 years and over) White / Caucasian 177 100.0% Not responsible for grandchildrenOther race 305 100.0% Not responsible for grandchildrenTwo or more races 25 14.2% Responsible for grandchildren150 85.8% Not responsible for grandchildrenHispanic or Latino 11 2.1% Responsible for grandchildren505 97.9% Not responsible for grandchildren