Races in West Hartford, Connecticut (CT) Detailed Stats
Data:
Races - White alone (%)
Races - White alone (% change since 2000)
Races - Black alone (%)
Races - Black alone (% change since 2000)
Races - American Indian alone (%)
Races - American Indian alone (% change since 2000)
Races - Asian alone (%)
Races - Asian alone (% change since 2000)
Races - Hispanic (%)
Races - Hispanic (% change since 2000)
Races - Native Hawaiian and Other Pacific Islander alone (%)
Races - Native Hawaiian and Other Pacific Islander alone (% change since 2000)
Races - Two or more races(%)
Races - Two or more races(% change since 2000)
Races - Other race alone (%)
Races - Other race alone (% change since 2000)
Racial diversity
Place of birth - Born in state of residence (%)
Place of birth - Born in state of residence (%) - White
Place of birth - Born in state of residence (%) - Black or African American
Place of birth - Born in state of residence (%) - Asian
Place of birth - Born in state of residence (%) - Hispanic or Latino
Place of birth - Born in state of residence (%) - American Indian and Alaska Native
Place of birth - Born in state of residence (%) - Multirace
Place of birth - Born in state of residence (%) - Other Race
Place of birth - Born in other state (%)
Place of birth - Born in other state (%) - White
Place of birth - Born in other state (%) - Black or African American
Place of birth - Born in other state (%) - Asian
Place of birth - Born in other state (%) - Hispanic or Latino
Place of birth - Born in other state (%) - American Indian and Alaska Native
Place of birth - Born in other state (%) - Multirace
Place of birth - Born in other state (%) - Other Race
Place of birth - Native, outside of US (%)
Place of birth - Native, outside of US (%) - White
Place of birth - Native, outside of US (%) - Black or African American
Place of birth - Native, outside of US (%) - Asian
Place of birth - Native, outside of US (%) - Hispanic or Latino
Place of birth - Native, outside of US (%) - American Indian and Alaska Native
Place of birth - Native, outside of US (%) - Multirace
Place of birth - Native, outside of US (%) - Other Race
Place of birth - Foreign born (%)
Place of birth - Foreign born (%) - White
Place of birth - Foreign born (%) - Black or African American
Place of birth - Foreign born (%) - Asian
Place of birth - Foreign born (%) - Hispanic or Latino
Place of birth - Foreign born (%) - American Indian and Alaska Native
Place of birth - Foreign born (%) - Multirace
Place of birth - Foreign born (%) - Other Race
Residents speaking English at home (%)
Residents speaking English at home - Born in the United States (%)
Residents speaking English at home - Native, born elsewhere (%)
Residents speaking English at home - Foreign born (%)
Residents speaking Spanish at home (%)
Residents speaking Spanish at home - Born in the United States (%)
Residents speaking Spanish at home - Native, born elsewhere (%)
Residents speaking Spanish at home - Foreign born (%)
Residents speaking other language at home (%)
Residents speaking other language at home - Born in the United States (%)
Residents speaking other language at home - Native, born elsewhere (%)
Residents speaking other language at home - Foreign born (%)
Marital status - Never married (%)
Marital status - Now married (%)
Marital status - Separated (%)
Marital status - Widowed (%)
Marital status - Divorced (%)
Ancestries Reported - Arab (%)
Ancestries Reported - Czech (%)
Ancestries Reported - Danish (%)
Ancestries Reported - Dutch (%)
Ancestries Reported - English (%)
Ancestries Reported - French (%)
Ancestries Reported - French Canadian (%)
Ancestries Reported - German (%)
Ancestries Reported - Greek (%)
Ancestries Reported - Hungarian (%)
Ancestries Reported - Irish (%)
Ancestries Reported - Italian (%)
Ancestries Reported - Lithuanian (%)
Ancestries Reported - Norwegian (%)
Ancestries Reported - Polish (%)
Ancestries Reported - Portuguese (%)
Ancestries Reported - Russian (%)
Ancestries Reported - Scotch-Irish (%)
Ancestries Reported - Scottish (%)
Ancestries Reported - Slovak (%)
Ancestries Reported - Subsaharan African (%)
Ancestries Reported - Swedish (%)
Ancestries Reported - Swiss (%)
Ancestries Reported - Ukrainian (%)
Ancestries Reported - United States (%)
Ancestries Reported - Welsh (%)
Ancestries Reported - West Indian (%)
Ancestries Reported - Other (%)
Geographical mobility - Same house 1 year ago (%)
Geographical mobility - Same house 1 year ago (%) - White
Geographical mobility - Same house 1 year ago (%) - Black or African American
Geographical mobility - Same house 1 year ago (%) - Asian
Geographical mobility - Same house 1 year ago (%) - Hispanic or Latino
Geographical mobility - Same house 1 year ago (%) - American Indian and Alaska Native
Geographical mobility - Same house 1 year ago (%) - Multirace
Geographical mobility - Same house 1 year ago (%) - Other Race
Geographical mobility - Moved within same county (%)
Geographical mobility - Moved within same county (%) - White
Geographical mobility - Moved within same county (%) - Black or African American
Geographical mobility - Moved within same county (%) - Asian
Geographical mobility - Moved within same county (%) - Hispanic or Latino
Geographical mobility - Moved within same county (%) - American Indian and Alaska Native
Geographical mobility - Moved within same county (%) - Multirace
Geographical mobility - Moved within same county (%) - Other Race
Geographical mobility - Moved from different county within same state (%)
Geographical mobility - Moved from different county within same state (%) - White
Geographical mobility - Moved from different county within same state (%) - Black or African American
Geographical mobility - Moved from different county within same state (%) - Asian
Geographical mobility - Moved from different county within same state (%) - Hispanic or Latino
Geographical mobility - Moved from different county within same state (%) - American Indian and Alaska Native
Geographical mobility - Moved from different county within same state (%) - Multirace
Geographical mobility - Moved from different county within same state (%) - Other Race
Geographical mobility - Moved from different state (%)
Geographical mobility - Moved from different state (%) - White
Geographical mobility - Moved from different state (%) - Black or African American
Geographical mobility - Moved from different state (%) - Asian
Geographical mobility - Moved from different state (%) - Hispanic or Latino
Geographical mobility - Moved from different state (%) - American Indian and Alaska Native
Geographical mobility - Moved from different state (%) - Multirace
Geographical mobility - Moved from different state (%) - Other Race
Geographical mobility - Moved from abroad (%)
Geographical mobility - Moved from abroad (%) - White
Geographical mobility - Moved from abroad (%) - Black or African American
Geographical mobility - Moved from abroad (%) - Asian
Geographical mobility - Moved from abroad (%) - Hispanic or Latino
Geographical mobility - Moved from abroad (%) - American Indian and Alaska Native
Geographical mobility - Moved from abroad (%) - Multirace
Geographical mobility - Moved from abroad (%) - Other Race
Place of birth for the foreign-born population - Ireland (%)
Place of birth for the foreign-born population - Denmark (%)
Place of birth for the foreign-born population - Norway (%)
Place of birth for the foreign-born population - Sweden (%)
Place of birth for the foreign-born population - United Kingdom (%)
Place of birth for the foreign-born population - England (%)
Place of birth for the foreign-born population - Scotland (%)
Place of birth for the foreign-born population - Other Northern Europe (%)
Place of birth for the foreign-born population - Austria (%)
Place of birth for the foreign-born population - Belgium (%)
Place of birth for the foreign-born population - France (%)
Place of birth for the foreign-born population - Germany (%)
Place of birth for the foreign-born population - Netherlands (%)
Place of birth for the foreign-born population - Switzerland (%)
Place of birth for the foreign-born population - Other Western Europe (%)
Place of birth for the foreign-born population - Greece (%)
Place of birth for the foreign-born population - Italy (%)
Place of birth for the foreign-born population - Portugal (%)
Place of birth for the foreign-born population - Spain (%)
Place of birth for the foreign-born population - Other Southern Europe (%)
Place of birth for the foreign-born population - Albania (%)
Place of birth for the foreign-born population - Belarus (%)
Place of birth for the foreign-born population - Bosnia and Herzegovina (%)
Place of birth for the foreign-born population - Bulgaria (%)
Place of birth for the foreign-born population - Croatia (%)
Place of birth for the foreign-born population - Czechoslovakia (%)
Place of birth for the foreign-born population - Hungary (%)
Place of birth for the foreign-born population - Latvia (%)
Place of birth for the foreign-born population - Lithuania (%)
Place of birth for the foreign-born population - North Macedonia (Macedonia) (%)
Place of birth for the foreign-born population - Moldova (%)
Place of birth for the foreign-born population - Poland (%)
Place of birth for the foreign-born population - Romania (%)
Place of birth for the foreign-born population - Russia (%)
Place of birth for the foreign-born population - Serbia (%)
Place of birth for the foreign-born population - Ukraine (%)
Place of birth for the foreign-born population - Other Eastern Europe (%)
Place of birth for the foreign-born population - China (%)
Place of birth for the foreign-born population - Hong Kong (%)
Place of birth for the foreign-born population - Taiwan (%)
Place of birth for the foreign-born population - Japan (%)
Place of birth for the foreign-born population - Korea (%)
Place of birth for the foreign-born population - Other Eastern Asia (%)
Place of birth for the foreign-born population - Afghanistan (%)
Place of birth for the foreign-born population - Bangladesh (%)
Place of birth for the foreign-born population - India (%)
Place of birth for the foreign-born population - Iran (%)
Place of birth for the foreign-born population - Kazakhstan (%)
Place of birth for the foreign-born population - Nepal (%)
Place of birth for the foreign-born population - Pakistan (%)
Place of birth for the foreign-born population - Sri Lanka (%)
Place of birth for the foreign-born population - Uzbekistan (%)
Place of birth for the foreign-born population - Other South Central Asia (%)
Place of birth for the foreign-born population - Burma (%)
Place of birth for the foreign-born population - Cambodia (%)
Place of birth for the foreign-born population - Indonesia (%)
Place of birth for the foreign-born population - Laos (%)
Place of birth for the foreign-born population - Malaysia (%)
Place of birth for the foreign-born population - Philippines (%)
Place of birth for the foreign-born population - Singapore (%)
Place of birth for the foreign-born population - Thailand (%)
Place of birth for the foreign-born population - Vietnam (%)
Place of birth for the foreign-born population - Other South Eastern Asia (%)
Place of birth for the foreign-born population - Armenia (%)
Place of birth for the foreign-born population - Iraq (%)
Place of birth for the foreign-born population - Israel (%)
Place of birth for the foreign-born population - Jordan (%)
Place of birth for the foreign-born population - Kuwait (%)
Place of birth for the foreign-born population - Lebanon (%)
Place of birth for the foreign-born population - Saudi Arabia (%)
Place of birth for the foreign-born population - Syria (%)
Place of birth for the foreign-born population - Turkey (%)
Place of birth for the foreign-born population - Yemen (%)
Place of birth for the foreign-born population - Other Western Asia (%)
Place of birth for the foreign-born population - Eritrea (%)
Place of birth for the foreign-born population - Ethiopia (%)
Place of birth for the foreign-born population - Kenya (%)
Place of birth for the foreign-born population - Somalia (%)
Place of birth for the foreign-born population - Uganda (%)
Place of birth for the foreign-born population - Zimbabwe (%)
Place of birth for the foreign-born population - Other Eastern Africa (%)
Place of birth for the foreign-born population - Cameroon (%)
Place of birth for the foreign-born population - Congo (%)
Place of birth for the foreign-born population - Democratic Republic of Congo (Zaire) (%)
Place of birth for the foreign-born population - Other Middle Africa (%)
Place of birth for the foreign-born population - Egypt (%)
Place of birth for the foreign-born population - Morocco (%)
Place of birth for the foreign-born population - Sudan (%)
Place of birth for the foreign-born population - Other Northern Africa (%)
Place of birth for the foreign-born population - South Africa (%)
Place of birth for the foreign-born population - Other Southern Africa (%)
Place of birth for the foreign-born population - Cabo Verde (%)
Place of birth for the foreign-born population - Ghana (%)
Place of birth for the foreign-born population - Liberia (%)
Place of birth for the foreign-born population - Nigeria (%)
Place of birth for the foreign-born population - Senegal (%)
Place of birth for the foreign-born population - Sierra Leone (%)
Place of birth for the foreign-born population - Other Western Africa (%)
Place of birth for the foreign-born population - Australia (%)
Place of birth for the foreign-born population - New Zealand (%)
Place of birth for the foreign-born population - Fiji (%)
Place of birth for the foreign-born population - Micronesia (%)
Place of birth for the foreign-born population - Bahamas (%)
Place of birth for the foreign-born population - Barbados (%)
Place of birth for the foreign-born population - Cuba (%)
Place of birth for the foreign-born population - Dominica (%)
Place of birth for the foreign-born population - Dominican Republic (%)
Place of birth for the foreign-born population - Grenada (%)
Place of birth for the foreign-born population - Haiti (%)
Place of birth for the foreign-born population - Jamaica (%)
Place of birth for the foreign-born population - St. Vincent and the Grenadines (%)
Place of birth for the foreign-born population - Trinidad and Tobago (%)
Place of birth for the foreign-born population - West Indies (%)
Place of birth for the foreign-born population - Other Caribbean (%)
Place of birth for the foreign-born population - Belize (%)
Place of birth for the foreign-born population - Costa Rica (%)
Place of birth for the foreign-born population - El Salvador (%)
Place of birth for the foreign-born population - Guatemala (%)
Place of birth for the foreign-born population - Honduras (%)
Place of birth for the foreign-born population - Mexico (%)
Place of birth for the foreign-born population - Nicaragua (%)
Place of birth for the foreign-born population - Panama (%)
Place of birth for the foreign-born population - Other Central America (%)
Place of birth for the foreign-born population - Argentina (%)
Place of birth for the foreign-born population - Bolivia (%)
Place of birth for the foreign-born population - Brazil (%)
Place of birth for the foreign-born population - Chile (%)
Place of birth for the foreign-born population - Colombia (%)
Place of birth for the foreign-born population - Ecuador (%)
Place of birth for the foreign-born population - Guyana (%)
Place of birth for the foreign-born population - Peru (%)
Place of birth for the foreign-born population - Uruguay (%)
Place of birth for the foreign-born population - Venezuela (%)
Place of birth for the foreign-born population - Other South America (%)
Place of birth for the foreign-born population - Canada (%)
Place of birth for the foreign-born population - Other Northern America (%)
Place of birth for the foreign-born population - Other (%)
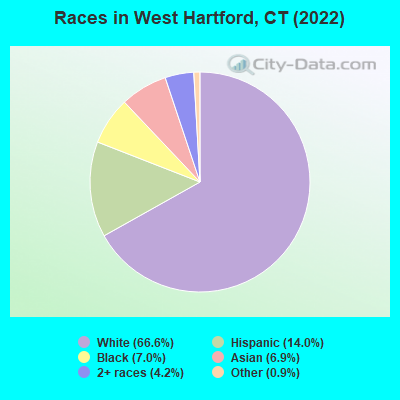
According to 2022 data, the most numerous races in West Hartford, CT are White alone (42,871 residents), Hispanic (9,029 residents), and Black alone (4,502 residents). 74.9% of West Hartford residents speak English at home. 18.1% of West Hartford, CT residents are foreign-born (5.9% born in Latin America, 5.7% born in Asia, 4.8% born in Europe), which is 17.3% greater than the foreign-born rate of 15.0% across the entire state of Connecticut.
Race distribution in West Hartford
2000 2022
2,638,845 77.5% White alone 320,323 9.4% Hispanic 295,571 8.7% Black alone 81,564 2.4% Asian alone 52,896 1.6% Two or more races 8,141 0.2% Other race alone 7,267 0.2% American Indian alone 958 0.03% Native Hawaiian and Other
2,246,913 62.0% White alone 658,978 18.2% Hispanic 353,973 9.8% Black alone 172,929 4.8% Asian alone 159,631 4.4% Two or more races 29,761 0.8% Other race alone 3,428 0.09% American Indian alone 592 0.02% Native Hawaiian and Other
Income and house value in West Hartford Median household income in 2022 $128,704 White non-Hispanic householders$91,325 Black householders$120,962 Asian householders$88,419 Some other race householders$106,371 Two or more races householders$80,049 Hispanic or Latino race householdersMedian 2022 house value $415,849 White Non-Hispanic householders$305,371 Black or African American householders$266,161 American Indian or Alaska Native householders $355,881 Asian householders$287,611 Some other race householders$292,224 Two or more races householders$293,608 Hispanic or Latino householders
Median age by race in West Hartford
43.3 Median age for White residents41.6 44.9 33.6 Median age for Black or African American residents29.5 38.7 40.5 Median age for American Indian / Alaska Native residents38.6 34.6 39.4 Median age for Asian residents37.4 41.2 -641,269,840.6 Median age for Native Hawaiian / Pacific Islander residents-414,239,481.8 -691,588,784.4 26.2 Median age for Other race residents28.9 25.5 32.3 Median age for Two or more races residents29.0 33.4 43.7 Median age for White alone residents42.5 45.5 34.6 Median age for Hispanic or Latino residents34.0 35.7
Owner/renter occupied households by race in West Hartford
House owners and renters - White residents 14,436 71.7% Owner occupied5,703 28.3% Renter occupiedHouse owners and renters - Black or African American residents 803 49.6% Owner occupied816 50.4% Renter occupiedHouse owners and renters - American Indian / Alaska Native residents 16 100.0% Renter occupiedHouse owners and renters - Asian residents 1,127 74.1% Owner occupied394 25.9% Renter occupiedHouse owners and renters - Other race residents 453 56.1% Owner occupied355 43.9% Renter occupiedHouse owners and renters - Two or more races residents 1,387 62.2% Owner occupied842 37.8% Renter occupiedHouse owners and renters - White alone residents 13,707 71.6% Owner occupied5,447 28.4% Renter occupiedHouse owners and renters - Hispanic or Latino residents 1,983 56.2% Owner occupied1,545 43.8% Renter occupied
Language usage in West Hartford
English speakers - Total 74.9% of residents of West Hartford speak English at home.
10.5% of residents speak Spanish at home 4,434 69.1% Speak English very well1,983 30.9% Speak English less than very well14.5% of residents speak other language at home 6,097 68.5% Speak English very well2,802 31.5% Speak English less than very well
English speakers - Born in the United States 92.3% of residents of West Hartford speak English at home.
4.8% of residents speak Spanish at home 711 77.3% Speak English very well209 22.7% Speak English less than very well2.6% of residents speak other language at home 484 95.1% Speak English very well25 4.9% Speak English less than very well
English speakers - Native, born elsewhere 28.4% of residents of West Hartford speak English at home.
60.9% of residents speak Spanish at home 786 65.7% Speak English very well411 34.3% Speak English less than very well12.6% of residents speak other language at home 221 89.1% Speak English very well27 10.9% Speak English less than very well
English speakers - Foreign-born 21.7% of residents of West Hartford speak English at home.
21.3% of residents speak Spanish at home 1,621 65.3% Speak English very well862 34.7% Speak English less than very well56.7% of residents speak other language at home 4,029 61.1% Speak English very well2,567 38.9% Speak English less than very well
White (Caucasian) - Speak only English Native:
93.3% (35,820)Foreign-born:
25.0% (1,067)
White (Caucasian) - Speak another language Native:
6.4% (2,457)Foreign-born:
74.0% (3,162)
Black or African American - Speak only English Native:
91.0% (3,012)Foreign-born:
58.7% (738)
Black or African American - Speak another language Native:
9.1% (300)Foreign-born:
39.5% (496)
American Indian / Alaska Native - Speak only English Native:
86.4% (36)Foreign-born:
18.2% (29)
Asian - Speak only English Native:
40.9% (478)Foreign-born:
11.0% (359)
Asian - Speak another language Native:
58.4% (684)Foreign-born:
89.3% (2,906)
Other race - Speak only English Native:
34.2% (565)Foreign-born:
18.1% (91)
Other race - Speak another language Native:
65.7% (1,087)Foreign-born:
79.7% (404)
Two or more races - Speak only English Native:
71.8% (3,365)Foreign-born:
10.3% (157)
Two or more races - Speak another language Native:
26.6% (1,248)Foreign-born:
89.1% (1,365)
White alone - Speak only English Native:
95.5% (35,316)Foreign-born:
25.7% (974)
White alone - Speak another language Native:
4.6% (1,684)Foreign-born:
74.1% (2,815)
Hispanic or Latino - Speak only English Native:
38.6% (2,249)Foreign-born:
7.5% (196)
Hispanic or Latino - Speak another language Native:
61.1% (3,557)Foreign-born:
92.1% (2,398)
Foreign-born residents in West Hartford 11,677 residents are foreign born (5.9% Latin America , 5.7% Asia , 4.8% Europe ).
This city:
18.1%Connecticut:
15.0%
Marital status for residents in West Hartford Marital status - White (Caucasian) population 15 years and over
Males 33.9% Never married56.6% Now married0.9% Separated1.7% Widowed6.9% DivorcedFemales 31.9% Never married47.4% Now married0.4% Separated9.9% Widowed10.5% DivorcedWomen who gave birth in the past 12 months Now married:
98.1% (383)Unmarried:
1.9% (7)
Women who did not give birth in the past 12 months Now married:
40.8% (3,913)Unmarried:
59.2% (5,690)
Marital status - Black or African American population 15 years and over
Males 46.9% Never married45.6% Now married0.2% Separated0.0% Widowed7.2% DivorcedFemales 51.4% Never married27.5% Now married1.0% Separated7.1% Widowed13.1% DivorcedWomen who gave birth in the past 12 months Now married:
61.7% (28)Unmarried:
38.3% (18)
Women who did not give birth in the past 12 months Now married:
20.6% (268)Unmarried:
79.4% (1,031)
Marital status - American Indian / Alaska Native population 15 years and over
Males 0.0% Never married15.6% Now married75.0% Separated0.0% Widowed9.4% DivorcedFemales 57.1% Never married42.9% Now married0.0% Separated0.0% Widowed0.0% DivorcedWomen who did not give birth in the past 12 months Now married:
33.3% (16)Unmarried:
66.7% (32)
Marital status - Asian population 15 years and over
Males 34.5% Never married61.5% Now married0.3% Separated2.8% Widowed0.8% DivorcedFemales 30.3% Never married58.0% Now married1.5% Separated6.2% Widowed4.0% DivorcedWomen who gave birth in the past 12 months Now married:
100.0% (40)Unmarried:
0.0% (0)
Women who did not give birth in the past 12 months Now married:
49.6% (593)Unmarried:
50.4% (602)
Marital status - Other race population 15 years and over
Males 47.2% Never married46.1% Now married0.0% Separated0.0% Widowed6.7% DivorcedFemales 57.0% Never married22.1% Now married5.6% Separated8.6% Widowed6.8% DivorcedWomen who gave birth in the past 12 months Now married:
40.0% (7)Unmarried:
60.0% (11)
Women who did not give birth in the past 12 months Now married:
12.3% (97)Unmarried:
87.7% (690)
Marital status - Two or more races population 15 years and over
Males 47.2% Never married40.6% Now married6.5% Separated0.8% Widowed4.9% DivorcedFemales 31.8% Never married42.1% Now married8.3% Separated4.6% Widowed13.1% DivorcedWomen who gave birth in the past 12 months Now married:
81.6% (61)Unmarried:
18.4% (14)
Women who did not give birth in the past 12 months Now married:
48.7% (804)Unmarried:
51.3% (848)
Marital status - White alone, not Hispanic / Latino population 15 years and over
Males 32.4% Never married58.0% Now married1.0% Separated1.8% Widowed6.8% DivorcedFemales 31.4% Never married48.4% Now married0.3% Separated10.5% Widowed9.3% DivorcedWomen who gave birth in the past 12 months Now married:
98.1% (403)Unmarried:
1.9% (8)
Women who did not give birth in the past 12 months Now married:
41.9% (3,849)Unmarried:
58.1% (5,343)
Marital status - Hispanic or Latino population 15 years and over
Males 45.6% Never married38.0% Now married6.0% Separated0.4% Widowed10.0% DivorcedFemales 41.8% Never married30.5% Now married5.6% Separated4.3% Widowed17.8% DivorcedWomen who gave birth in the past 12 months Now married:
25.0% (6)Unmarried:
75.0% (19)
Women who did not give birth in the past 12 months Now married:
31.6% (786)Unmarried:
68.4% (1,699)
Ancestries in West Hartford
2,561 8.6% Irish1,901 6.4% Italian1,496 5.0% American1,353 4.6% English1,023 3.4% German989 3.3% Polish739 2.5% European587 2.0% Russian543 1.8% Portuguese462 1.6% Haitian379 1.3% French Canadian367 1.2% Eastern European366 1.2% Ukrainian345 1.2% Albanian274 0.9% Jamaican264 0.9% Brazilian243 0.8% Greek218 0.7% Guyanese215 0.7% French183 0.6% Swedish173 0.6% Arab162 0.5% Scottish159 0.5% Armenian157 0.5% British157 0.5% Northern European148 0.5% Ethiopian144 0.5% Hungarian132 0.4% Nigerian122 0.4% Lithuanian114 0.4% Bulgarian94 0.3% Norwegian94 0.3% Afghan92 0.3% Israeli78 0.3% Serbian75 0.3% Romanian71 0.2% Canadian60 0.2% Iranian46 0.2% Dutch45 0.2% Somali44 0.1% Lebanese43 0.1% Austrian39 0.1% Danish37 0.1% Finnish36 0.1% Syrian36 0.1% Belizean32 0.1% Yugoslavian31 0.1% Ghanaian31 0.1% Barbadian30 0.1% Estonian28 0.09% Scotch-Irish25 0.08% Palestinian25 0.08% Slovak21 0.07% West Indian19 0.06% Swiss18 0.06% South African17 0.06% African16 0.05% Trinidadian and Tobagonian14 0.05% Belgian12 0.04% Welsh11 0.04% Senegalese10 0.03% Scandinavian9 0.03% Turkish9 0.03% Australian8 0.03% Croatian6 0.02% Moroccan5 0.02% Slovene2 0.01% Czechoslovakian
Geographical mobility in West Hartford Same house 1 year ago 39,718 89.1% White (Caucasian)4,045 84.1% Black or African American35 20.0% American Indian / Alaska Native3,863 86.7% Asian1,790 80.6% Other race5,672 84.7% Two or more races37,994 89.4% White alone, not Hispanic / Latino7,307 82.3% Hispanic or LatinoMoved within same county 1,955 4.4% White / Caucasian377 7.8% Black or African American40 23.0% American Indian / Alaska Native304 6.8% Asian152 6.8% Other race566 8.4% Two or more races1,783 4.2% White alone, not Hispanic / Latino740 8.3% Hispanic or LatinoMoved within same state 622 1.4% White / Caucasian9 0.2% Black or African American17 0.4% Asian72 3.3% Other race88 1.3% Two or more races544 1.3% White alone, not Hispanic / Latino194 2.2% Hispanic or LatinoMoved from different state 2,408 5.4% White / Caucasian391 8.1% Black or African American144 82.9% American Indian / Alaska Native88 2.0% Asian121 5.4% Other race359 5.4% Two or more races2,298 5.4% White alone, not Hispanic / Latino632 7.1% Hispanic or LatinoMoved from abroad 98 0.2% White113 2.5% Asian40 1.8% Other race105 0.2% White alone, not Hispanic / Latino45 0.5% Hispanic or Latino
Children Nativity (place of birth) in West Hartford
Children under 6 years - Living with two parents Both parents native 2,359 100.0% NativeBoth parents foreign-born 277 84.4% Native51 15.6% Foreign-bornOne native, one foreign-born parent 290 100.0% NativeChildren under 6 years - Living with one parent Native parent 400 100.0% NativeForeign-born parent 316 85.2% Native55 14.8% Foreign-bornChildren 6 to 17 years - Living with two parents Both parents native 4,417 99.6% Native19 0.4% Foreign-bornBoth parents foreign-born 1,034 71.5% Native412 28.5% Foreign-bornOne native, one foreign-born parent 854 99.1% Native8 0.9% Foreign-bornChildren 6 to 17 years - Living with one parent Native parent 2,075 100.0% NativeForeign-born parent 1,038 50.8% Native1,006 49.2% Foreign-born
Place of birth for residents in West Hartford
Grandparents responsible for own grandchildren in West Hartford
Grandparents (30 to 59 years) White / Caucasian 37 100.0% Not responsible for grandchildrenBlack or African American 6 100.0% Responsible for grandchildrenTwo or more races 12 24.5% Responsible for grandchildren37 75.5% Not responsible for grandchildrenWhite alone, not Hispanic / Latino 50 100.0% Not responsible for grandchildrenGrandparents (60 years and over) White / Caucasian 54 42.7% Responsible for grandchildren72 57.3% Not responsible for grandchildrenBlack or African American 52 100.0% Not responsible for grandchildrenTwo or more races 45 100.0% Not responsible for grandchildrenWhite alone, not Hispanic / Latino 19 27.1% Responsible for grandchildren52 72.9% Not responsible for grandchildren