Races in West Gate, Virginia (VA) Detailed Stats
Ancestries, Foreign-born residents, place of birth

Recent posts about races in West Gate, Virginia on our local forum with over 2,400,000 registered users:
 | Buy a house in Manassas 20110 or Woodbridge 22193? (13 replies) |
| Thinking about buying a home in West Game of Lomond (6 replies) |
| Manassas - Older SFH - What's the deal? (17 replies) |
| Herndon job, traffic/living question (9 replies) |
21.6% of West Gate, VA residents are foreign-born (15.3% born in Latin America, 3.8% born in Asia), which is 44.4% greater than the foreign-born rate of 12.0% across the entire state of Virginia.
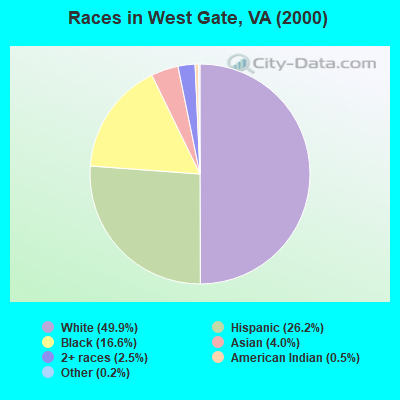
Race distribution in West Gate

- 3,73949.9%White alone
- 1,96326.2%Hispanic
- 1,24516.6%Black alone
- 2964.0%Asian alone
- 1912.5%Two or more races
- 340.5%American Indian alone
- 180.2%Other race alone
- 70.09%Native Hawaiian and Other
Pacific Islander alone
2000
2022
-
- 4,965,63770.2%White alone
- 1,376,37819.4%Black alone
- 329,5404.7%Hispanic
- 259,2773.7%Asian alone
- 114,0221.6%Two or more races
- 18,5960.3%American Indian alone
- 11,6850.2%Other race alone
- 3,3800.05%Native Hawaiian and Other
Pacific Islander alone

-
- 5,095,13058.7%White alone
- 1,594,78518.4%Black alone
- 905,75010.4%Hispanic
- 602,8816.9%Asian alone
- 406,0474.7%Two or more races
- 60,4190.7%Other race alone
- 11,7380.1%American Indian alone
- 6,8690.08%Native Hawaiian and Other
Pacific Islander alone

Income and house value in West Gate
- Median household income in 2022
- $98,111White non-Hispanic householders
- $67,143Black householders
- $103,318American Indian and Alaska Native householders
- $169,454Asian householders
- $90,472Some other race householders
- $60,571Two or more races householders
- $94,744Hispanic or Latino race householders
- Median 2022 house value
- $454,631White Non-Hispanic householders
- $300,777Black or African American householders
- $294,540Asian householders
- $310,480Some other race householders
- $279,986Two or more races householders
- $302,510Hispanic or Latino householders
Household income for White non-Hispanic householders

Household income for Black householders

Household income for American Indian and Alaska Native householders

Household income for Asian householders

Household income for Two or more races householders

Household income for Hispanic or Latino race householders

Foreign-born residents in West Gate
1,616 residents are foreign born (15.3% Latin America, 3.8% Asia).
| This city: | 21.6% |
| Virginia: | 8.1% |
Ancestries in West Gate

- 3,28246.2%Other
- 7029.9%German
- 6899.7%United States
- 5668.0%Irish
- 4606.5%English
- 2233.1%Polish
- 1712.4%Scotch-Irish
- 1552.2%Italian
- 1412.0%Scottish
- 1141.6%French
- 1141.6%Subsaharan African
- 1001.4%West Indian
- 851.2%Arab
- 791.1%Dutch
- 500.7%Welsh
- 450.6%French Canadian
- 330.5%Greek
- 330.5%Swedish
- 170.2%Swiss
- 160.2%Lithuanian
- 150.2%Russian
- 140.2%Norwegian
- 70.10%Czech

Zip codes: 20109.