Races in West Chicago, Illinois (IL) Detailed Stats
Data:
Races - White alone (%)
Races - White alone (% change since 2000)
Races - Black alone (%)
Races - Black alone (% change since 2000)
Races - American Indian alone (%)
Races - American Indian alone (% change since 2000)
Races - Asian alone (%)
Races - Asian alone (% change since 2000)
Races - Hispanic (%)
Races - Hispanic (% change since 2000)
Races - Native Hawaiian and Other Pacific Islander alone (%)
Races - Native Hawaiian and Other Pacific Islander alone (% change since 2000)
Races - Two or more races(%)
Races - Two or more races(% change since 2000)
Races - Other race alone (%)
Races - Other race alone (% change since 2000)
Racial diversity
Place of birth - Born in state of residence (%)
Place of birth - Born in state of residence (%) - White
Place of birth - Born in state of residence (%) - Black or African American
Place of birth - Born in state of residence (%) - Asian
Place of birth - Born in state of residence (%) - Hispanic or Latino
Place of birth - Born in state of residence (%) - American Indian and Alaska Native
Place of birth - Born in state of residence (%) - Multirace
Place of birth - Born in state of residence (%) - Other Race
Place of birth - Born in other state (%)
Place of birth - Born in other state (%) - White
Place of birth - Born in other state (%) - Black or African American
Place of birth - Born in other state (%) - Asian
Place of birth - Born in other state (%) - Hispanic or Latino
Place of birth - Born in other state (%) - American Indian and Alaska Native
Place of birth - Born in other state (%) - Multirace
Place of birth - Born in other state (%) - Other Race
Place of birth - Native, outside of US (%)
Place of birth - Native, outside of US (%) - White
Place of birth - Native, outside of US (%) - Black or African American
Place of birth - Native, outside of US (%) - Asian
Place of birth - Native, outside of US (%) - Hispanic or Latino
Place of birth - Native, outside of US (%) - American Indian and Alaska Native
Place of birth - Native, outside of US (%) - Multirace
Place of birth - Native, outside of US (%) - Other Race
Place of birth - Foreign born (%)
Place of birth - Foreign born (%) - White
Place of birth - Foreign born (%) - Black or African American
Place of birth - Foreign born (%) - Asian
Place of birth - Foreign born (%) - Hispanic or Latino
Place of birth - Foreign born (%) - American Indian and Alaska Native
Place of birth - Foreign born (%) - Multirace
Place of birth - Foreign born (%) - Other Race
Residents speaking English at home (%)
Residents speaking English at home - Born in the United States (%)
Residents speaking English at home - Native, born elsewhere (%)
Residents speaking English at home - Foreign born (%)
Residents speaking Spanish at home (%)
Residents speaking Spanish at home - Born in the United States (%)
Residents speaking Spanish at home - Native, born elsewhere (%)
Residents speaking Spanish at home - Foreign born (%)
Residents speaking other language at home (%)
Residents speaking other language at home - Born in the United States (%)
Residents speaking other language at home - Native, born elsewhere (%)
Residents speaking other language at home - Foreign born (%)
Marital status - Never married (%)
Marital status - Now married (%)
Marital status - Separated (%)
Marital status - Widowed (%)
Marital status - Divorced (%)
Ancestries Reported - Arab (%)
Ancestries Reported - Czech (%)
Ancestries Reported - Danish (%)
Ancestries Reported - Dutch (%)
Ancestries Reported - English (%)
Ancestries Reported - French (%)
Ancestries Reported - French Canadian (%)
Ancestries Reported - German (%)
Ancestries Reported - Greek (%)
Ancestries Reported - Hungarian (%)
Ancestries Reported - Irish (%)
Ancestries Reported - Italian (%)
Ancestries Reported - Lithuanian (%)
Ancestries Reported - Norwegian (%)
Ancestries Reported - Polish (%)
Ancestries Reported - Portuguese (%)
Ancestries Reported - Russian (%)
Ancestries Reported - Scotch-Irish (%)
Ancestries Reported - Scottish (%)
Ancestries Reported - Slovak (%)
Ancestries Reported - Subsaharan African (%)
Ancestries Reported - Swedish (%)
Ancestries Reported - Swiss (%)
Ancestries Reported - Ukrainian (%)
Ancestries Reported - United States (%)
Ancestries Reported - Welsh (%)
Ancestries Reported - West Indian (%)
Ancestries Reported - Other (%)
Geographical mobility - Same house 1 year ago (%)
Geographical mobility - Same house 1 year ago (%) - White
Geographical mobility - Same house 1 year ago (%) - Black or African American
Geographical mobility - Same house 1 year ago (%) - Asian
Geographical mobility - Same house 1 year ago (%) - Hispanic or Latino
Geographical mobility - Same house 1 year ago (%) - American Indian and Alaska Native
Geographical mobility - Same house 1 year ago (%) - Multirace
Geographical mobility - Same house 1 year ago (%) - Other Race
Geographical mobility - Moved within same county (%)
Geographical mobility - Moved within same county (%) - White
Geographical mobility - Moved within same county (%) - Black or African American
Geographical mobility - Moved within same county (%) - Asian
Geographical mobility - Moved within same county (%) - Hispanic or Latino
Geographical mobility - Moved within same county (%) - American Indian and Alaska Native
Geographical mobility - Moved within same county (%) - Multirace
Geographical mobility - Moved within same county (%) - Other Race
Geographical mobility - Moved from different county within same state (%)
Geographical mobility - Moved from different county within same state (%) - White
Geographical mobility - Moved from different county within same state (%) - Black or African American
Geographical mobility - Moved from different county within same state (%) - Asian
Geographical mobility - Moved from different county within same state (%) - Hispanic or Latino
Geographical mobility - Moved from different county within same state (%) - American Indian and Alaska Native
Geographical mobility - Moved from different county within same state (%) - Multirace
Geographical mobility - Moved from different county within same state (%) - Other Race
Geographical mobility - Moved from different state (%)
Geographical mobility - Moved from different state (%) - White
Geographical mobility - Moved from different state (%) - Black or African American
Geographical mobility - Moved from different state (%) - Asian
Geographical mobility - Moved from different state (%) - Hispanic or Latino
Geographical mobility - Moved from different state (%) - American Indian and Alaska Native
Geographical mobility - Moved from different state (%) - Multirace
Geographical mobility - Moved from different state (%) - Other Race
Geographical mobility - Moved from abroad (%)
Geographical mobility - Moved from abroad (%) - White
Geographical mobility - Moved from abroad (%) - Black or African American
Geographical mobility - Moved from abroad (%) - Asian
Geographical mobility - Moved from abroad (%) - Hispanic or Latino
Geographical mobility - Moved from abroad (%) - American Indian and Alaska Native
Geographical mobility - Moved from abroad (%) - Multirace
Geographical mobility - Moved from abroad (%) - Other Race
Place of birth for the foreign-born population - Ireland (%)
Place of birth for the foreign-born population - Denmark (%)
Place of birth for the foreign-born population - Norway (%)
Place of birth for the foreign-born population - Sweden (%)
Place of birth for the foreign-born population - United Kingdom (%)
Place of birth for the foreign-born population - England (%)
Place of birth for the foreign-born population - Scotland (%)
Place of birth for the foreign-born population - Other Northern Europe (%)
Place of birth for the foreign-born population - Austria (%)
Place of birth for the foreign-born population - Belgium (%)
Place of birth for the foreign-born population - France (%)
Place of birth for the foreign-born population - Germany (%)
Place of birth for the foreign-born population - Netherlands (%)
Place of birth for the foreign-born population - Switzerland (%)
Place of birth for the foreign-born population - Other Western Europe (%)
Place of birth for the foreign-born population - Greece (%)
Place of birth for the foreign-born population - Italy (%)
Place of birth for the foreign-born population - Portugal (%)
Place of birth for the foreign-born population - Spain (%)
Place of birth for the foreign-born population - Other Southern Europe (%)
Place of birth for the foreign-born population - Albania (%)
Place of birth for the foreign-born population - Belarus (%)
Place of birth for the foreign-born population - Bosnia and Herzegovina (%)
Place of birth for the foreign-born population - Bulgaria (%)
Place of birth for the foreign-born population - Croatia (%)
Place of birth for the foreign-born population - Czechoslovakia (%)
Place of birth for the foreign-born population - Hungary (%)
Place of birth for the foreign-born population - Latvia (%)
Place of birth for the foreign-born population - Lithuania (%)
Place of birth for the foreign-born population - North Macedonia (Macedonia) (%)
Place of birth for the foreign-born population - Moldova (%)
Place of birth for the foreign-born population - Poland (%)
Place of birth for the foreign-born population - Romania (%)
Place of birth for the foreign-born population - Russia (%)
Place of birth for the foreign-born population - Serbia (%)
Place of birth for the foreign-born population - Ukraine (%)
Place of birth for the foreign-born population - Other Eastern Europe (%)
Place of birth for the foreign-born population - China (%)
Place of birth for the foreign-born population - Hong Kong (%)
Place of birth for the foreign-born population - Taiwan (%)
Place of birth for the foreign-born population - Japan (%)
Place of birth for the foreign-born population - Korea (%)
Place of birth for the foreign-born population - Other Eastern Asia (%)
Place of birth for the foreign-born population - Afghanistan (%)
Place of birth for the foreign-born population - Bangladesh (%)
Place of birth for the foreign-born population - India (%)
Place of birth for the foreign-born population - Iran (%)
Place of birth for the foreign-born population - Kazakhstan (%)
Place of birth for the foreign-born population - Nepal (%)
Place of birth for the foreign-born population - Pakistan (%)
Place of birth for the foreign-born population - Sri Lanka (%)
Place of birth for the foreign-born population - Uzbekistan (%)
Place of birth for the foreign-born population - Other South Central Asia (%)
Place of birth for the foreign-born population - Burma (%)
Place of birth for the foreign-born population - Cambodia (%)
Place of birth for the foreign-born population - Indonesia (%)
Place of birth for the foreign-born population - Laos (%)
Place of birth for the foreign-born population - Malaysia (%)
Place of birth for the foreign-born population - Philippines (%)
Place of birth for the foreign-born population - Singapore (%)
Place of birth for the foreign-born population - Thailand (%)
Place of birth for the foreign-born population - Vietnam (%)
Place of birth for the foreign-born population - Other South Eastern Asia (%)
Place of birth for the foreign-born population - Armenia (%)
Place of birth for the foreign-born population - Iraq (%)
Place of birth for the foreign-born population - Israel (%)
Place of birth for the foreign-born population - Jordan (%)
Place of birth for the foreign-born population - Kuwait (%)
Place of birth for the foreign-born population - Lebanon (%)
Place of birth for the foreign-born population - Saudi Arabia (%)
Place of birth for the foreign-born population - Syria (%)
Place of birth for the foreign-born population - Turkey (%)
Place of birth for the foreign-born population - Yemen (%)
Place of birth for the foreign-born population - Other Western Asia (%)
Place of birth for the foreign-born population - Eritrea (%)
Place of birth for the foreign-born population - Ethiopia (%)
Place of birth for the foreign-born population - Kenya (%)
Place of birth for the foreign-born population - Somalia (%)
Place of birth for the foreign-born population - Uganda (%)
Place of birth for the foreign-born population - Zimbabwe (%)
Place of birth for the foreign-born population - Other Eastern Africa (%)
Place of birth for the foreign-born population - Cameroon (%)
Place of birth for the foreign-born population - Congo (%)
Place of birth for the foreign-born population - Democratic Republic of Congo (Zaire) (%)
Place of birth for the foreign-born population - Other Middle Africa (%)
Place of birth for the foreign-born population - Egypt (%)
Place of birth for the foreign-born population - Morocco (%)
Place of birth for the foreign-born population - Sudan (%)
Place of birth for the foreign-born population - Other Northern Africa (%)
Place of birth for the foreign-born population - South Africa (%)
Place of birth for the foreign-born population - Other Southern Africa (%)
Place of birth for the foreign-born population - Cabo Verde (%)
Place of birth for the foreign-born population - Ghana (%)
Place of birth for the foreign-born population - Liberia (%)
Place of birth for the foreign-born population - Nigeria (%)
Place of birth for the foreign-born population - Senegal (%)
Place of birth for the foreign-born population - Sierra Leone (%)
Place of birth for the foreign-born population - Other Western Africa (%)
Place of birth for the foreign-born population - Australia (%)
Place of birth for the foreign-born population - New Zealand (%)
Place of birth for the foreign-born population - Fiji (%)
Place of birth for the foreign-born population - Micronesia (%)
Place of birth for the foreign-born population - Bahamas (%)
Place of birth for the foreign-born population - Barbados (%)
Place of birth for the foreign-born population - Cuba (%)
Place of birth for the foreign-born population - Dominica (%)
Place of birth for the foreign-born population - Dominican Republic (%)
Place of birth for the foreign-born population - Grenada (%)
Place of birth for the foreign-born population - Haiti (%)
Place of birth for the foreign-born population - Jamaica (%)
Place of birth for the foreign-born population - St. Vincent and the Grenadines (%)
Place of birth for the foreign-born population - Trinidad and Tobago (%)
Place of birth for the foreign-born population - West Indies (%)
Place of birth for the foreign-born population - Other Caribbean (%)
Place of birth for the foreign-born population - Belize (%)
Place of birth for the foreign-born population - Costa Rica (%)
Place of birth for the foreign-born population - El Salvador (%)
Place of birth for the foreign-born population - Guatemala (%)
Place of birth for the foreign-born population - Honduras (%)
Place of birth for the foreign-born population - Mexico (%)
Place of birth for the foreign-born population - Nicaragua (%)
Place of birth for the foreign-born population - Panama (%)
Place of birth for the foreign-born population - Other Central America (%)
Place of birth for the foreign-born population - Argentina (%)
Place of birth for the foreign-born population - Bolivia (%)
Place of birth for the foreign-born population - Brazil (%)
Place of birth for the foreign-born population - Chile (%)
Place of birth for the foreign-born population - Colombia (%)
Place of birth for the foreign-born population - Ecuador (%)
Place of birth for the foreign-born population - Guyana (%)
Place of birth for the foreign-born population - Peru (%)
Place of birth for the foreign-born population - Uruguay (%)
Place of birth for the foreign-born population - Venezuela (%)
Place of birth for the foreign-born population - Other South America (%)
Place of birth for the foreign-born population - Canada (%)
Place of birth for the foreign-born population - Other Northern America (%)
Place of birth for the foreign-born population - Other (%)
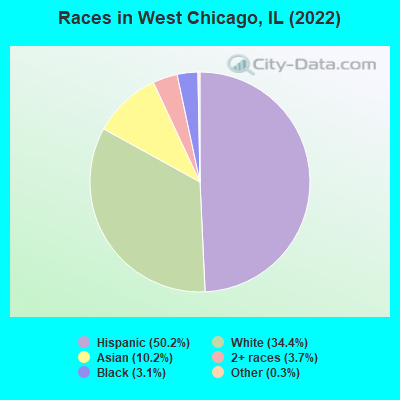
According to 2022 data, the most numerous races in West Chicago, IL are White alone (8,715 residents), Hispanic (12,744 residents), and Black alone (774 residents). 47.5% of West Chicago residents speak English at home. 33.6% of West Chicago, IL residents are foreign-born (24.6% born in Latin America, 7.4% born in Asia), which is 58.4% greater than the foreign-born rate of 14.0% across the entire state of Illinois.
Race distribution in West Chicago
2000 2022
8,424,140 67.8% White alone 1,856,152 14.9% Black alone 1,530,262 12.3% Hispanic 419,916 3.4% Asian alone 153,996 1.2% Two or more races 13,479 0.1% Other race alone 18,232 0.1% American Indian alone 3,116 0.03% Native Hawaiian and Other
7,356,301 58.5% White alone 2,299,726 18.3% Hispanic 1,660,423 13.2% Black alone 747,296 5.9% Asian alone 458,599 3.6% Two or more races 45,386 0.4% Other race alone 10,405 0.08% American Indian alone 3,896 0.03% Native Hawaiian and Other
Income and house value in West Chicago Median household income in 2022 $113,347 White non-Hispanic householders$76,677 Black householders$69,737 Asian householders$69,985 Some other race householders$74,774 Two or more races householders$71,718 Hispanic or Latino race householdersMedian 2022 house value $324,081 White Non-Hispanic householders$331,009 Black or African American householders$304,236 American Indian or Alaska Native householders $335,502 Asian householders$248,069 Some other race householders$254,060 Two or more races householders$255,184 Hispanic or Latino householders
Median age by race in West Chicago
43.6 Median age for White residents43.1 44.1 33.3 Median age for Black or African American residents40.0 26.2 28.1 Median age for American Indian / Alaska Native residents28.6 -545,253,862.6 44.5 Median age for Asian residents47.1 42.9 -593,236,714.4 Median age for Native Hawaiian / Pacific Islander residents-658,536,584.7 -576,015,108.0 28.6 Median age for Other race residents30.9 27.9 30.5 Median age for Two or more races residents33.1 26.7 48.9 Median age for White alone residents47.2 51.1 28.3 Median age for Hispanic or Latino residents30.1 27.1
Owner/renter occupied households by race in West Chicago
House owners and renters - White residents 3,256 82.6% Owner occupied686 17.4% Renter occupiedHouse owners and renters - Black or African American residents 140 41.6% Owner occupied196 58.4% Renter occupiedHouse owners and renters - American Indian / Alaska Native residents 16 100.0% Owner occupiedHouse owners and renters - Asian residents 823 86.4% Owner occupied130 13.6% Renter occupiedHouse owners and renters - Other race residents 957 53.7% Owner occupied826 46.3% Renter occupiedHouse owners and renters - Two or more races residents 579 56.4% Owner occupied446 43.6% Renter occupiedHouse owners and renters - White alone residents 2,759 84.1% Owner occupied522 15.9% Renter occupiedHouse owners and renters - Hispanic or Latino residents 1,677 59.0% Owner occupied1,163 41.0% Renter occupied
Language usage in West Chicago
English speakers - Total 47.5% of residents of West Chicago speak English at home.
44.7% of residents speak Spanish at home 5,392 49.9% Speak English very well5,422 50.1% Speak English less than very well10.5% of residents speak other language at home 1,770 69.6% Speak English very well772 30.4% Speak English less than very well
English speakers - Born in the United States 85.4% of residents of West Chicago speak English at home.
9.4% of residents speak Spanish at home 142 64.3% Speak English very well79 35.7% Speak English less than very well4.2% of residents speak other language at home 68 68.7% Speak English very well31 31.3% Speak English less than very well
English speakers - Native, born elsewhere 48.4% of residents of West Chicago speak English at home.
54.4% of residents speak Spanish at home 200 69.4% Speak English very well88 30.6% Speak English less than very well1.7% of residents speak other language at home 9 100.0% Speak English very well
English speakers - Foreign-born 10.4% of residents of West Chicago speak English at home.
71.7% of residents speak Spanish at home 1,748 29.0% Speak English very well4,275 71.0% Speak English less than very well22.0% of residents speak other language at home 1,190 64.2% Speak English very well663 35.8% Speak English less than very well
White (Caucasian) - Speak only English Native:
82.4% (8,015)Foreign-born:
9.1% (139)
White (Caucasian) - Speak another language Native:
14.4% (1,396)Foreign-born:
89.6% (1,369)
Black or African American - Speak only English Native:
79.6% (635)Foreign-born:
100.0% (105)
Black or African American - Speak another language Native:
15.6% (125)Foreign-born:
45.5% (48)
American Indian / Alaska Native - Speak another language Native:
59.7% (23)Foreign-born:
100.0% (12)
Asian - Speak only English Native:
46.9% (403)Foreign-born:
11.8% (205)
Asian - Speak another language Native:
50.3% (432)Foreign-born:
87.8% (1,524)
Other race - Speak only English Native:
6.2% (155)Foreign-born:
4.9% (256)
Other race - Speak another language Native:
87.6% (2,199)Foreign-born:
95.4% (4,978)
Two or more races - Speak only English Native:
54.9% (1,583)Foreign-born:
13.0% (166)
Two or more races - Speak another language Native:
47.0% (1,356)Foreign-born:
86.5% (1,102)
White alone - Speak only English Native:
95.8% (7,613)Foreign-born:
17.4% (74)
White alone - Speak another language Native:
4.3% (339)Foreign-born:
82.5% (351)
Hispanic or Latino - Speak only English Native:
21.1% (1,211)Foreign-born:
6.2% (395)
Hispanic or Latino - Speak another language Native:
79.8% (4,576)Foreign-born:
93.9% (5,933)
Foreign-born residents in West Chicago 8,528 residents are foreign born (24.6% Latin America , 7.4% Asia ).
This city:
33.6%Illinois:
14.1%
Marital status for residents in West Chicago Marital status - White (Caucasian) population 15 years and over
Males 33.5% Never married53.4% Now married1.7% Separated1.4% Widowed10.0% DivorcedFemales 33.3% Never married50.1% Now married0.6% Separated6.5% Widowed9.5% DivorcedWomen who gave birth in the past 12 months Now married:
73.9% (100)Unmarried:
26.1% (35)
Women who did not give birth in the past 12 months Now married:
34.5% (832)Unmarried:
65.5% (1,581)
Marital status - Black or African American population 15 years and over
Males 38.5% Never married60.0% Now married0.0% Separated0.0% Widowed1.4% DivorcedFemales 47.4% Never married46.3% Now married0.0% Separated0.0% Widowed6.2% DivorcedWomen who did not give birth in the past 12 months Now married:
46.0% (170)Unmarried:
54.0% (200)
Marital status - American Indian / Alaska Native population 15 years and over
Males 100.0% Never married0.0% Now married0.0% Separated0.0% Widowed0.0% DivorcedFemales 0.0% Never married100.0% Now married0.0% Separated0.0% Widowed0.0% DivorcedWomen who did not give birth in the past 12 months Now married:
100.0% (18)Unmarried:
0.0% (0)
Marital status - Asian population 15 years and over
Males 23.3% Never married72.9% Now married0.0% Separated1.4% Widowed2.4% DivorcedFemales 36.9% Never married52.0% Now married0.0% Separated4.9% Widowed6.2% DivorcedWomen who gave birth in the past 12 months Now married:
100.0% (6)Unmarried:
0.0% (0)
Women who did not give birth in the past 12 months Now married:
39.7% (367)Unmarried:
60.3% (557)
Marital status - Other race population 15 years and over
Males 39.9% Never married55.5% Now married1.7% Separated1.4% Widowed1.4% DivorcedFemales 35.6% Never married52.8% Now married3.1% Separated5.1% Widowed3.4% DivorcedWomen who gave birth in the past 12 months Now married:
26.0% (63)Unmarried:
74.0% (179)
Women who did not give birth in the past 12 months Now married:
52.4% (965)Unmarried:
47.6% (876)
Marital status - Two or more races population 15 years and over
Males 64.5% Never married30.1% Now married1.1% Separated0.2% Widowed4.0% DivorcedFemales 41.3% Never married30.7% Now married7.0% Separated6.1% Widowed14.8% DivorcedWomen who gave birth in the past 12 months Now married:
100.0% (7)Unmarried:
0.0% (0)
Women who did not give birth in the past 12 months Now married:
28.4% (359)Unmarried:
71.6% (906)
Marital status - White alone, not Hispanic / Latino population 15 years and over
Males 28.1% Never married58.6% Now married1.0% Separated1.7% Widowed10.6% DivorcedFemales 26.3% Never married56.8% Now married0.0% Separated8.0% Widowed8.9% DivorcedWomen who gave birth in the past 12 months Now married:
91.1% (107)Unmarried:
8.9% (10)
Women who did not give birth in the past 12 months Now married:
38.9% (617)Unmarried:
61.1% (970)
Marital status - Hispanic or Latino population 15 years and over
Males 46.4% Never married46.3% Now married2.2% Separated0.9% Widowed4.2% DivorcedFemales 42.0% Never married41.7% Now married4.1% Separated3.4% Widowed8.9% DivorcedWomen who gave birth in the past 12 months Now married:
24.2% (52)Unmarried:
75.8% (163)
Women who did not give birth in the past 12 months Now married:
39.4% (1,285)Unmarried:
60.6% (1,980)
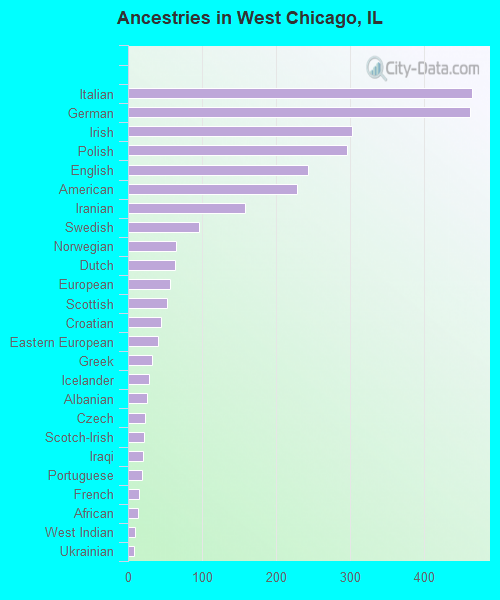
Ancestries in West Chicago
464 3.2% Italian462 3.2% German302 2.1% Irish295 2.0% Polish243 1.7% English228 1.6% American158 1.1% Iranian96 0.7% Swedish65 0.4% Norwegian64 0.4% Dutch57 0.4% European52 0.4% Scottish44 0.3% Croatian41 0.3% Eastern European33 0.2% Greek29 0.2% Icelander26 0.2% Albanian23 0.2% Czech21 0.1% Scotch-Irish20 0.1% Iraqi19 0.1% Portuguese15 0.1% French13 0.09% African10 0.07% West Indian8 0.05% Ukrainian5 0.03% Arab5 0.03% Danish5 0.03% New Zealander5 0.03% South African1 0.01% British
Geographical mobility in West Chicago Same house 1 year ago 10,741 92.7% White (Caucasian)663 66.6% Black or African American71 99.7% American Indian / Alaska Native1,998 76.7% Asian7,439 89.4% Other race4,112 94.3% Two or more races8,048 93.5% White alone, not Hispanic / Latino11,380 89.8% Hispanic or LatinoMoved within same county 276 2.4% White / Caucasian275 27.6% Black or African American307 11.8% Asian30 0.4% Other race167 3.8% Two or more races256 3.0% White alone, not Hispanic / Latino167 1.3% Hispanic or LatinoMoved within same state 578 5.0% White / Caucasian56 5.6% Black or African American219 8.4% Asian50 0.6% Other race281 3.3% White alone, not Hispanic / Latino455 3.6% Hispanic or LatinoMoved from different state 18 0.2% White / Caucasian4 0.4% Black or African American41 1.6% Asian298 3.6% Other race19 0.2% White alone, not Hispanic / Latino456 3.6% Hispanic or LatinoMoved from abroad 8 0.1% White16 1.6% Black or African American66 2.5% Asian621 7.5% Other race20 0.5% Two or more races555 4.4% Hispanic or Latino
Children Nativity (place of birth) in West Chicago
Children under 6 years - Living with two parents Both parents native 442 99.5% Native2 0.5% Foreign-bornBoth parents foreign-born 210 85.6% Native35 14.4% Foreign-bornOne native, one foreign-born parent 167 100.0% NativeChildren under 6 years - Living with one parent Native parent 217 100.0% NativeForeign-born parent 274 87.9% Native38 12.1% Foreign-bornChildren 6 to 17 years - Living with two parents Both parents native 1,453 95.6% Native67 4.4% Foreign-bornBoth parents foreign-born 1,130 68.1% Native529 31.9% Foreign-bornOne native, one foreign-born parent 411 100.0% NativeChildren 6 to 17 years - Living with one parent Native parent 188 100.0% NativeForeign-born parent 730 50.8% Native706 49.2% Foreign-born
Grandparents responsible for own grandchildren in West Chicago
Grandparents (30 to 59 years) White / Caucasian 14 9.3% Responsible for grandchildren133 90.7% Not responsible for grandchildrenAsian 7 100.0% Not responsible for grandchildrenOther race 133 36.7% Responsible for grandchildren229 63.3% Not responsible for grandchildrenWhite alone, not Hispanic / Latino 9 12.2% Responsible for grandchildren64 87.8% Not responsible for grandchildrenHispanic or Latino 37 7.9% Responsible for grandchildren429 92.1% Not responsible for grandchildrenGrandparents (60 years and over) White / Caucasian 4 6.8% Responsible for grandchildren60 93.2% Not responsible for grandchildrenAsian 81 100.0% Not responsible for grandchildrenOther race 5 3.0% Responsible for grandchildren152 97.0% Not responsible for grandchildrenWhite alone, not Hispanic / Latino 5 13.0% Responsible for grandchildren32 87.0% Not responsible for grandchildrenHispanic or Latino 7 1.4% Responsible for grandchildren526 98.6% Not responsible for grandchildren