Races in Welcome, South Carolina (SC) Detailed Stats
Data:
Races - White alone (%)
Races - White alone (% change since 2000)
Races - Black alone (%)
Races - Black alone (% change since 2000)
Races - American Indian alone (%)
Races - American Indian alone (% change since 2000)
Races - Asian alone (%)
Races - Asian alone (% change since 2000)
Races - Hispanic (%)
Races - Hispanic (% change since 2000)
Races - Native Hawaiian and Other Pacific Islander alone (%)
Races - Native Hawaiian and Other Pacific Islander alone (% change since 2000)
Races - Two or more races(%)
Races - Two or more races(% change since 2000)
Races - Other race alone (%)
Races - Other race alone (% change since 2000)
Racial diversity
Place of birth - Born in state of residence (%)
Place of birth - Born in state of residence (%) - White
Place of birth - Born in state of residence (%) - Black or African American
Place of birth - Born in state of residence (%) - Asian
Place of birth - Born in state of residence (%) - Hispanic or Latino
Place of birth - Born in state of residence (%) - American Indian and Alaska Native
Place of birth - Born in state of residence (%) - Multirace
Place of birth - Born in state of residence (%) - Other Race
Place of birth - Born in other state (%)
Place of birth - Born in other state (%) - White
Place of birth - Born in other state (%) - Black or African American
Place of birth - Born in other state (%) - Asian
Place of birth - Born in other state (%) - Hispanic or Latino
Place of birth - Born in other state (%) - American Indian and Alaska Native
Place of birth - Born in other state (%) - Multirace
Place of birth - Born in other state (%) - Other Race
Place of birth - Native, outside of US (%)
Place of birth - Native, outside of US (%) - White
Place of birth - Native, outside of US (%) - Black or African American
Place of birth - Native, outside of US (%) - Asian
Place of birth - Native, outside of US (%) - Hispanic or Latino
Place of birth - Native, outside of US (%) - American Indian and Alaska Native
Place of birth - Native, outside of US (%) - Multirace
Place of birth - Native, outside of US (%) - Other Race
Place of birth - Foreign born (%)
Place of birth - Foreign born (%) - White
Place of birth - Foreign born (%) - Black or African American
Place of birth - Foreign born (%) - Asian
Place of birth - Foreign born (%) - Hispanic or Latino
Place of birth - Foreign born (%) - American Indian and Alaska Native
Place of birth - Foreign born (%) - Multirace
Place of birth - Foreign born (%) - Other Race
Residents speaking English at home (%)
Residents speaking English at home - Born in the United States (%)
Residents speaking English at home - Native, born elsewhere (%)
Residents speaking English at home - Foreign born (%)
Residents speaking Spanish at home (%)
Residents speaking Spanish at home - Born in the United States (%)
Residents speaking Spanish at home - Native, born elsewhere (%)
Residents speaking Spanish at home - Foreign born (%)
Residents speaking other language at home (%)
Residents speaking other language at home - Born in the United States (%)
Residents speaking other language at home - Native, born elsewhere (%)
Residents speaking other language at home - Foreign born (%)
Marital status - Never married (%)
Marital status - Now married (%)
Marital status - Separated (%)
Marital status - Widowed (%)
Marital status - Divorced (%)
Ancestries Reported - Arab (%)
Ancestries Reported - Czech (%)
Ancestries Reported - Danish (%)
Ancestries Reported - Dutch (%)
Ancestries Reported - English (%)
Ancestries Reported - French (%)
Ancestries Reported - French Canadian (%)
Ancestries Reported - German (%)
Ancestries Reported - Greek (%)
Ancestries Reported - Hungarian (%)
Ancestries Reported - Irish (%)
Ancestries Reported - Italian (%)
Ancestries Reported - Lithuanian (%)
Ancestries Reported - Norwegian (%)
Ancestries Reported - Polish (%)
Ancestries Reported - Portuguese (%)
Ancestries Reported - Russian (%)
Ancestries Reported - Scotch-Irish (%)
Ancestries Reported - Scottish (%)
Ancestries Reported - Slovak (%)
Ancestries Reported - Subsaharan African (%)
Ancestries Reported - Swedish (%)
Ancestries Reported - Swiss (%)
Ancestries Reported - Ukrainian (%)
Ancestries Reported - United States (%)
Ancestries Reported - Welsh (%)
Ancestries Reported - West Indian (%)
Ancestries Reported - Other (%)
Geographical mobility - Same house 1 year ago (%)
Geographical mobility - Same house 1 year ago (%) - White
Geographical mobility - Same house 1 year ago (%) - Black or African American
Geographical mobility - Same house 1 year ago (%) - Asian
Geographical mobility - Same house 1 year ago (%) - Hispanic or Latino
Geographical mobility - Same house 1 year ago (%) - American Indian and Alaska Native
Geographical mobility - Same house 1 year ago (%) - Multirace
Geographical mobility - Same house 1 year ago (%) - Other Race
Geographical mobility - Moved within same county (%)
Geographical mobility - Moved within same county (%) - White
Geographical mobility - Moved within same county (%) - Black or African American
Geographical mobility - Moved within same county (%) - Asian
Geographical mobility - Moved within same county (%) - Hispanic or Latino
Geographical mobility - Moved within same county (%) - American Indian and Alaska Native
Geographical mobility - Moved within same county (%) - Multirace
Geographical mobility - Moved within same county (%) - Other Race
Geographical mobility - Moved from different county within same state (%)
Geographical mobility - Moved from different county within same state (%) - White
Geographical mobility - Moved from different county within same state (%) - Black or African American
Geographical mobility - Moved from different county within same state (%) - Asian
Geographical mobility - Moved from different county within same state (%) - Hispanic or Latino
Geographical mobility - Moved from different county within same state (%) - American Indian and Alaska Native
Geographical mobility - Moved from different county within same state (%) - Multirace
Geographical mobility - Moved from different county within same state (%) - Other Race
Geographical mobility - Moved from different state (%)
Geographical mobility - Moved from different state (%) - White
Geographical mobility - Moved from different state (%) - Black or African American
Geographical mobility - Moved from different state (%) - Asian
Geographical mobility - Moved from different state (%) - Hispanic or Latino
Geographical mobility - Moved from different state (%) - American Indian and Alaska Native
Geographical mobility - Moved from different state (%) - Multirace
Geographical mobility - Moved from different state (%) - Other Race
Geographical mobility - Moved from abroad (%)
Geographical mobility - Moved from abroad (%) - White
Geographical mobility - Moved from abroad (%) - Black or African American
Geographical mobility - Moved from abroad (%) - Asian
Geographical mobility - Moved from abroad (%) - Hispanic or Latino
Geographical mobility - Moved from abroad (%) - American Indian and Alaska Native
Geographical mobility - Moved from abroad (%) - Multirace
Geographical mobility - Moved from abroad (%) - Other Race
Place of birth for the foreign-born population - Ireland (%)
Place of birth for the foreign-born population - Denmark (%)
Place of birth for the foreign-born population - Norway (%)
Place of birth for the foreign-born population - Sweden (%)
Place of birth for the foreign-born population - United Kingdom (%)
Place of birth for the foreign-born population - England (%)
Place of birth for the foreign-born population - Scotland (%)
Place of birth for the foreign-born population - Other Northern Europe (%)
Place of birth for the foreign-born population - Austria (%)
Place of birth for the foreign-born population - Belgium (%)
Place of birth for the foreign-born population - France (%)
Place of birth for the foreign-born population - Germany (%)
Place of birth for the foreign-born population - Netherlands (%)
Place of birth for the foreign-born population - Switzerland (%)
Place of birth for the foreign-born population - Other Western Europe (%)
Place of birth for the foreign-born population - Greece (%)
Place of birth for the foreign-born population - Italy (%)
Place of birth for the foreign-born population - Portugal (%)
Place of birth for the foreign-born population - Spain (%)
Place of birth for the foreign-born population - Other Southern Europe (%)
Place of birth for the foreign-born population - Albania (%)
Place of birth for the foreign-born population - Belarus (%)
Place of birth for the foreign-born population - Bosnia and Herzegovina (%)
Place of birth for the foreign-born population - Bulgaria (%)
Place of birth for the foreign-born population - Croatia (%)
Place of birth for the foreign-born population - Czechoslovakia (%)
Place of birth for the foreign-born population - Hungary (%)
Place of birth for the foreign-born population - Latvia (%)
Place of birth for the foreign-born population - Lithuania (%)
Place of birth for the foreign-born population - North Macedonia (Macedonia) (%)
Place of birth for the foreign-born population - Moldova (%)
Place of birth for the foreign-born population - Poland (%)
Place of birth for the foreign-born population - Romania (%)
Place of birth for the foreign-born population - Russia (%)
Place of birth for the foreign-born population - Serbia (%)
Place of birth for the foreign-born population - Ukraine (%)
Place of birth for the foreign-born population - Other Eastern Europe (%)
Place of birth for the foreign-born population - China (%)
Place of birth for the foreign-born population - Hong Kong (%)
Place of birth for the foreign-born population - Taiwan (%)
Place of birth for the foreign-born population - Japan (%)
Place of birth for the foreign-born population - Korea (%)
Place of birth for the foreign-born population - Other Eastern Asia (%)
Place of birth for the foreign-born population - Afghanistan (%)
Place of birth for the foreign-born population - Bangladesh (%)
Place of birth for the foreign-born population - India (%)
Place of birth for the foreign-born population - Iran (%)
Place of birth for the foreign-born population - Kazakhstan (%)
Place of birth for the foreign-born population - Nepal (%)
Place of birth for the foreign-born population - Pakistan (%)
Place of birth for the foreign-born population - Sri Lanka (%)
Place of birth for the foreign-born population - Uzbekistan (%)
Place of birth for the foreign-born population - Other South Central Asia (%)
Place of birth for the foreign-born population - Burma (%)
Place of birth for the foreign-born population - Cambodia (%)
Place of birth for the foreign-born population - Indonesia (%)
Place of birth for the foreign-born population - Laos (%)
Place of birth for the foreign-born population - Malaysia (%)
Place of birth for the foreign-born population - Philippines (%)
Place of birth for the foreign-born population - Singapore (%)
Place of birth for the foreign-born population - Thailand (%)
Place of birth for the foreign-born population - Vietnam (%)
Place of birth for the foreign-born population - Other South Eastern Asia (%)
Place of birth for the foreign-born population - Armenia (%)
Place of birth for the foreign-born population - Iraq (%)
Place of birth for the foreign-born population - Israel (%)
Place of birth for the foreign-born population - Jordan (%)
Place of birth for the foreign-born population - Kuwait (%)
Place of birth for the foreign-born population - Lebanon (%)
Place of birth for the foreign-born population - Saudi Arabia (%)
Place of birth for the foreign-born population - Syria (%)
Place of birth for the foreign-born population - Turkey (%)
Place of birth for the foreign-born population - Yemen (%)
Place of birth for the foreign-born population - Other Western Asia (%)
Place of birth for the foreign-born population - Eritrea (%)
Place of birth for the foreign-born population - Ethiopia (%)
Place of birth for the foreign-born population - Kenya (%)
Place of birth for the foreign-born population - Somalia (%)
Place of birth for the foreign-born population - Uganda (%)
Place of birth for the foreign-born population - Zimbabwe (%)
Place of birth for the foreign-born population - Other Eastern Africa (%)
Place of birth for the foreign-born population - Cameroon (%)
Place of birth for the foreign-born population - Congo (%)
Place of birth for the foreign-born population - Democratic Republic of Congo (Zaire) (%)
Place of birth for the foreign-born population - Other Middle Africa (%)
Place of birth for the foreign-born population - Egypt (%)
Place of birth for the foreign-born population - Morocco (%)
Place of birth for the foreign-born population - Sudan (%)
Place of birth for the foreign-born population - Other Northern Africa (%)
Place of birth for the foreign-born population - South Africa (%)
Place of birth for the foreign-born population - Other Southern Africa (%)
Place of birth for the foreign-born population - Cabo Verde (%)
Place of birth for the foreign-born population - Ghana (%)
Place of birth for the foreign-born population - Liberia (%)
Place of birth for the foreign-born population - Nigeria (%)
Place of birth for the foreign-born population - Senegal (%)
Place of birth for the foreign-born population - Sierra Leone (%)
Place of birth for the foreign-born population - Other Western Africa (%)
Place of birth for the foreign-born population - Australia (%)
Place of birth for the foreign-born population - New Zealand (%)
Place of birth for the foreign-born population - Fiji (%)
Place of birth for the foreign-born population - Micronesia (%)
Place of birth for the foreign-born population - Bahamas (%)
Place of birth for the foreign-born population - Barbados (%)
Place of birth for the foreign-born population - Cuba (%)
Place of birth for the foreign-born population - Dominica (%)
Place of birth for the foreign-born population - Dominican Republic (%)
Place of birth for the foreign-born population - Grenada (%)
Place of birth for the foreign-born population - Haiti (%)
Place of birth for the foreign-born population - Jamaica (%)
Place of birth for the foreign-born population - St. Vincent and the Grenadines (%)
Place of birth for the foreign-born population - Trinidad and Tobago (%)
Place of birth for the foreign-born population - West Indies (%)
Place of birth for the foreign-born population - Other Caribbean (%)
Place of birth for the foreign-born population - Belize (%)
Place of birth for the foreign-born population - Costa Rica (%)
Place of birth for the foreign-born population - El Salvador (%)
Place of birth for the foreign-born population - Guatemala (%)
Place of birth for the foreign-born population - Honduras (%)
Place of birth for the foreign-born population - Mexico (%)
Place of birth for the foreign-born population - Nicaragua (%)
Place of birth for the foreign-born population - Panama (%)
Place of birth for the foreign-born population - Other Central America (%)
Place of birth for the foreign-born population - Argentina (%)
Place of birth for the foreign-born population - Bolivia (%)
Place of birth for the foreign-born population - Brazil (%)
Place of birth for the foreign-born population - Chile (%)
Place of birth for the foreign-born population - Colombia (%)
Place of birth for the foreign-born population - Ecuador (%)
Place of birth for the foreign-born population - Guyana (%)
Place of birth for the foreign-born population - Peru (%)
Place of birth for the foreign-born population - Uruguay (%)
Place of birth for the foreign-born population - Venezuela (%)
Place of birth for the foreign-born population - Other South America (%)
Place of birth for the foreign-born population - Canada (%)
Place of birth for the foreign-born population - Other Northern America (%)
Place of birth for the foreign-born population - Other (%)
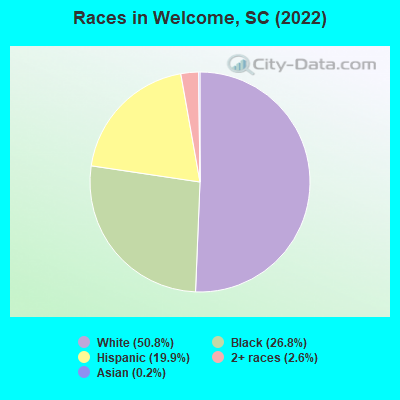
According to 2022 data, the most numerous races in Welcome, SC are White alone (3,767 residents), Black alone (1,990 residents), and Hispanic (1,473 residents). 84.9% of Welcome residents speak English at home. 10.1% of Welcome, SC residents are foreign-born (10.0% born in Latin America), which is 50.5% greater than the foreign-born rate of 5.0% across the entire state of South Carolina.
Race distribution in Welcome
2000 2022
2,652,291 66.1% White alone 1,178,486 29.4% Black alone 95,076 2.4% Hispanic 35,568 0.9% Asian alone 33,290 0.8% Two or more races 12,765 0.3% American Indian alone 3,266 0.08% Other race alone 1,270 0.03% Native Hawaiian and Other
3,301,739 62.5% White alone 1,313,290 24.9% Black alone 343,783 6.5% Hispanic 190,508 3.6% Two or more races 89,888 1.7% Asian alone 29,390 0.6% Other race alone 12,112 0.2% American Indian alone 1,924 0.04% Native Hawaiian and Other
Income and house value in Welcome Median household income in 2022 $60,497 White non-Hispanic householders$40,814 Black householders$69,769 Some other race householders$73,674 Hispanic or Latino race householdersMedian 2022 house value $178,377 White Non-Hispanic householders$220,998 Black or African American householders$179,692 Some other race householders$156,277 Two or more races householders$216,262 Hispanic or Latino householders
Median age by race in Welcome
39.8 Median age for White residents39.7 46.6 35.1 Median age for Black or African American residents38.9 36.1 -450,811,842.9 Median age for American Indian / Alaska Native residents-862,419,205.0 -446,859,902.9 -711,225,363.5 Median age for Asian residents-702,317,289.9 -723,192,019.2 -698,412,697.7 Median age for Native Hawaiian / Pacific Islander residents-551,574,375.1 -1,016,109,044.8 27.6 Median age for Other race residents28.8 30.4 53.8 Median age for Two or more races residents59.3 54.4 39.5 Median age for White alone residents39.4 49.1 27.9 Median age for Hispanic or Latino residents27.5 32.0
Owner/renter occupied households by race in Welcome
House owners and renters - White residents 1,441 77.2% Owner occupied425 22.8% Renter occupiedHouse owners and renters - Black or African American residents 240 24.1% Owner occupied757 75.9% Renter occupiedHouse owners and renters - Other race residents 384 100.0% Owner occupiedHouse owners and renters - Two or more races residents 210 99.5% Owner occupied1 0.5% Renter occupiedHouse owners and renters - White alone residents 1,451 77.8% Owner occupied414 22.2% Renter occupiedHouse owners and renters - Hispanic or Latino residents 363 93.2% Owner occupied26 6.8% Renter occupied
Language usage in Welcome
English speakers - Total 84.9% of residents of Welcome speak English at home.
14.9% of residents speak Spanish at home 676 64.6% Speak English very well371 35.4% Speak English less than very well0.4% of residents speak other language at home 24 82.8% Speak English very well5 17.2% Speak English less than very well
English speakers - Born in the United States 88.5% of residents of Welcome speak English at home.
11.2% of residents speak Spanish at home 107 68.2% Speak English very well50 31.8% Speak English less than very well1.7% of residents speak other language at home 24 100.0% Speak English very well
English speakers - Native, born elsewhere 93.0% of residents of Welcome speak English at home.
English speakers - Foreign-born 14.2% of residents of Welcome speak English at home.
80.0% of residents speak Spanish at home 290 51.5% Speak English very well273 48.5% Speak English less than very well0.7% of residents speak other language at home 5 100.0% Speak English less than very well
White (Caucasian) - Speak only English Native:
99.6% (3,638)Foreign-born:
100.0% (12)
Other race - Speak another language Native:
91.5% (476)Foreign-born:
81.7% (466)
Two or more races - Speak another language Native:
0.6% (1)Foreign-born:
100.0% (243)
White alone - Speak only English Native:
99.7% (3,603)Foreign-born:
100.0% (17)
Hispanic or Latino - Speak only English Native:
16.6% (95)Foreign-born:
14.9% (96)
Hispanic or Latino - Speak another language Native:
75.1% (428)Foreign-born:
86.9% (564)
Foreign-born residents in Welcome 749 residents are foreign born (10.0% Latin America ).
This city:
10.1%South Carolina:
5.3%
Marital status for residents in Welcome Marital status - White (Caucasian) population 15 years and over
Males 54.7% Never married29.2% Now married0.5% Separated7.1% Widowed8.5% DivorcedFemales 38.1% Never married34.0% Now married1.0% Separated14.8% Widowed12.0% DivorcedWomen who did not give birth in the past 12 months Now married:
34.9% (245)Unmarried:
65.1% (458)
Marital status - Black or African American population 15 years and over
Males 33.1% Never married26.0% Now married4.9% Separated8.3% Widowed27.8% DivorcedFemales 65.5% Never married16.8% Now married3.6% Separated8.7% Widowed5.4% DivorcedWomen who gave birth in the past 12 months Now married:
51.7% (31)Unmarried:
48.3% (29)
Women who did not give birth in the past 12 months Now married:
16.8% (128)Unmarried:
83.2% (631)
Marital status - Other race population 15 years and over
Males 33.1% Never married54.7% Now married0.0% Separated0.0% Widowed12.2% DivorcedFemales 16.3% Never married40.2% Now married0.0% Separated5.8% Widowed37.8% DivorcedWomen who gave birth in the past 12 months Now married:
97.3% (146)Unmarried:
2.7% (4)
Women who did not give birth in the past 12 months Now married:
31.9% (51)Unmarried:
68.1% (108)
Marital status - Two or more races population 15 years and over
Males 5.3% Never married94.7% Now married0.0% Separated0.0% Widowed0.0% DivorcedFemales 2.7% Never married97.3% Now married0.0% Separated0.0% Widowed0.0% DivorcedWomen who gave birth in the past 12 months Now married:
100.0% (1)Unmarried:
0.0% (0)
Women who did not give birth in the past 12 months Now married:
94.3% (108)Unmarried:
5.7% (7)
Marital status - White alone, not Hispanic / Latino population 15 years and over
Males 55.3% Never married28.4% Now married0.5% Separated7.1% Widowed8.6% DivorcedFemales 38.6% Never married33.1% Now married1.0% Separated15.0% Widowed12.2% DivorcedWomen who did not give birth in the past 12 months Now married:
32.9% (230)Unmarried:
67.1% (468)
Marital status - Hispanic or Latino population 15 years and over
Males 24.0% Never married67.2% Now married0.0% Separated0.0% Widowed8.9% DivorcedFemales 12.0% Never married55.7% Now married0.0% Separated4.3% Widowed28.0% DivorcedWomen who gave birth in the past 12 months Now married:
97.3% (119)Unmarried:
2.7% (3)
Women who did not give birth in the past 12 months Now married:
41.7% (63)Unmarried:
58.3% (88)
Ancestries in Welcome
496 11.1% American232 5.2% English171 3.8% African94 2.1% German83 1.9% European63 1.4% Italian43 1.0% Scandinavian41 0.9% Irish36 0.8% Scottish26 0.6% Romanian18 0.4% Eastern European17 0.4% French
Geographical mobility in Welcome Same house 1 year ago 3,179 85.5% White (Caucasian)1,835 92.5% Black or African American13 100.0% Asian1,127 91.7% Other race507 99.3% Two or more races3,167 85.2% White alone, not Hispanic / Latino1,256 91.8% Hispanic or LatinoMoved within same county 361 9.7% White / Caucasian63 3.2% Black or African American4 0.3% Other race356 9.6% White alone, not Hispanic / Latino4 0.3% Hispanic or LatinoMoved within same state 13 0.4% White / Caucasian60 3.0% Black or African American93 7.5% Other race13 0.4% White alone, not Hispanic / Latino178 13.0% Hispanic or LatinoMoved from different state 15 0.4% White / Caucasian53 2.7% Black or African American15 0.4% White alone, not Hispanic / LatinoMoved from abroad 46 1.2% White49 1.3% White alone, not Hispanic / Latino
Children Nativity (place of birth) in Welcome
Children under 6 years - Living with two parents Both parents native 87 100.0% NativeBoth parents foreign-born 160 100.0% NativeOne native, one foreign-born parent 168 100.0% NativeChildren under 6 years - Living with one parent Foreign-born parent 41 100.0% NativeChildren 6 to 17 years - Living with two parents Both parents native 519 100.0% NativeBoth parents foreign-born 178 100.0% NativeOne native, one foreign-born parent 51 100.0% NativeChildren 6 to 17 years - Living with one parent Native parent 620 100.0% NativeForeign-born parent 43 47.5% Native48 52.5% Foreign-born
Grandparents responsible for own grandchildren in Welcome
Grandparents (30 to 59 years) Other race 19 100.0% Not responsible for grandchildrenHispanic or Latino 23 100.0% Not responsible for grandchildren
Grandparents (60 years and over) Other race 61 100.0% Not responsible for grandchildrenHispanic or Latino 60 100.0% Not responsible for grandchildren