Races in Washougal, Washington (WA) Detailed Stats Ancestries, Foreign-born residents, place of birth
Data:
Races - White alone (%)
Races - White alone (% change since 2000)
Races - Black alone (%)
Races - Black alone (% change since 2000)
Races - American Indian alone (%)
Races - American Indian alone (% change since 2000)
Races - Asian alone (%)
Races - Asian alone (% change since 2000)
Races - Hispanic (%)
Races - Hispanic (% change since 2000)
Races - Native Hawaiian and Other Pacific Islander alone (%)
Races - Native Hawaiian and Other Pacific Islander alone (% change since 2000)
Races - Two or more races(%)
Races - Two or more races(% change since 2000)
Races - Other race alone (%)
Races - Other race alone (% change since 2000)
Racial diversity
Place of birth - Born in state of residence (%)
Place of birth - Born in state of residence (%) - White
Place of birth - Born in state of residence (%) - Black or African American
Place of birth - Born in state of residence (%) - Asian
Place of birth - Born in state of residence (%) - Hispanic or Latino
Place of birth - Born in state of residence (%) - American Indian and Alaska Native
Place of birth - Born in state of residence (%) - Multirace
Place of birth - Born in state of residence (%) - Other Race
Place of birth - Born in other state (%)
Place of birth - Born in other state (%) - White
Place of birth - Born in other state (%) - Black or African American
Place of birth - Born in other state (%) - Asian
Place of birth - Born in other state (%) - Hispanic or Latino
Place of birth - Born in other state (%) - American Indian and Alaska Native
Place of birth - Born in other state (%) - Multirace
Place of birth - Born in other state (%) - Other Race
Place of birth - Native, outside of US (%)
Place of birth - Native, outside of US (%) - White
Place of birth - Native, outside of US (%) - Black or African American
Place of birth - Native, outside of US (%) - Asian
Place of birth - Native, outside of US (%) - Hispanic or Latino
Place of birth - Native, outside of US (%) - American Indian and Alaska Native
Place of birth - Native, outside of US (%) - Multirace
Place of birth - Native, outside of US (%) - Other Race
Place of birth - Foreign born (%)
Place of birth - Foreign born (%) - White
Place of birth - Foreign born (%) - Black or African American
Place of birth - Foreign born (%) - Asian
Place of birth - Foreign born (%) - Hispanic or Latino
Place of birth - Foreign born (%) - American Indian and Alaska Native
Place of birth - Foreign born (%) - Multirace
Place of birth - Foreign born (%) - Other Race
Residents speaking English at home (%)
Residents speaking English at home - Born in the United States (%)
Residents speaking English at home - Native, born elsewhere (%)
Residents speaking English at home - Foreign born (%)
Residents speaking Spanish at home (%)
Residents speaking Spanish at home - Born in the United States (%)
Residents speaking Spanish at home - Native, born elsewhere (%)
Residents speaking Spanish at home - Foreign born (%)
Residents speaking other language at home (%)
Residents speaking other language at home - Born in the United States (%)
Residents speaking other language at home - Native, born elsewhere (%)
Residents speaking other language at home - Foreign born (%)
Marital status - Never married (%)
Marital status - Now married (%)
Marital status - Separated (%)
Marital status - Widowed (%)
Marital status - Divorced (%)
Ancestries Reported - Arab (%)
Ancestries Reported - Czech (%)
Ancestries Reported - Danish (%)
Ancestries Reported - Dutch (%)
Ancestries Reported - English (%)
Ancestries Reported - French (%)
Ancestries Reported - French Canadian (%)
Ancestries Reported - German (%)
Ancestries Reported - Greek (%)
Ancestries Reported - Hungarian (%)
Ancestries Reported - Irish (%)
Ancestries Reported - Italian (%)
Ancestries Reported - Lithuanian (%)
Ancestries Reported - Norwegian (%)
Ancestries Reported - Polish (%)
Ancestries Reported - Portuguese (%)
Ancestries Reported - Russian (%)
Ancestries Reported - Scotch-Irish (%)
Ancestries Reported - Scottish (%)
Ancestries Reported - Slovak (%)
Ancestries Reported - Subsaharan African (%)
Ancestries Reported - Swedish (%)
Ancestries Reported - Swiss (%)
Ancestries Reported - Ukrainian (%)
Ancestries Reported - United States (%)
Ancestries Reported - Welsh (%)
Ancestries Reported - West Indian (%)
Ancestries Reported - Other (%)
Geographical mobility - Same house 1 year ago (%)
Geographical mobility - Same house 1 year ago (%) - White
Geographical mobility - Same house 1 year ago (%) - Black or African American
Geographical mobility - Same house 1 year ago (%) - Asian
Geographical mobility - Same house 1 year ago (%) - Hispanic or Latino
Geographical mobility - Same house 1 year ago (%) - American Indian and Alaska Native
Geographical mobility - Same house 1 year ago (%) - Multirace
Geographical mobility - Same house 1 year ago (%) - Other Race
Geographical mobility - Moved within same county (%)
Geographical mobility - Moved within same county (%) - White
Geographical mobility - Moved within same county (%) - Black or African American
Geographical mobility - Moved within same county (%) - Asian
Geographical mobility - Moved within same county (%) - Hispanic or Latino
Geographical mobility - Moved within same county (%) - American Indian and Alaska Native
Geographical mobility - Moved within same county (%) - Multirace
Geographical mobility - Moved within same county (%) - Other Race
Geographical mobility - Moved from different county within same state (%)
Geographical mobility - Moved from different county within same state (%) - White
Geographical mobility - Moved from different county within same state (%) - Black or African American
Geographical mobility - Moved from different county within same state (%) - Asian
Geographical mobility - Moved from different county within same state (%) - Hispanic or Latino
Geographical mobility - Moved from different county within same state (%) - American Indian and Alaska Native
Geographical mobility - Moved from different county within same state (%) - Multirace
Geographical mobility - Moved from different county within same state (%) - Other Race
Geographical mobility - Moved from different state (%)
Geographical mobility - Moved from different state (%) - White
Geographical mobility - Moved from different state (%) - Black or African American
Geographical mobility - Moved from different state (%) - Asian
Geographical mobility - Moved from different state (%) - Hispanic or Latino
Geographical mobility - Moved from different state (%) - American Indian and Alaska Native
Geographical mobility - Moved from different state (%) - Multirace
Geographical mobility - Moved from different state (%) - Other Race
Geographical mobility - Moved from abroad (%)
Geographical mobility - Moved from abroad (%) - White
Geographical mobility - Moved from abroad (%) - Black or African American
Geographical mobility - Moved from abroad (%) - Asian
Geographical mobility - Moved from abroad (%) - Hispanic or Latino
Geographical mobility - Moved from abroad (%) - American Indian and Alaska Native
Geographical mobility - Moved from abroad (%) - Multirace
Geographical mobility - Moved from abroad (%) - Other Race
Place of birth for the foreign-born population - Ireland (%)
Place of birth for the foreign-born population - Denmark (%)
Place of birth for the foreign-born population - Norway (%)
Place of birth for the foreign-born population - Sweden (%)
Place of birth for the foreign-born population - United Kingdom (%)
Place of birth for the foreign-born population - England (%)
Place of birth for the foreign-born population - Scotland (%)
Place of birth for the foreign-born population - Other Northern Europe (%)
Place of birth for the foreign-born population - Austria (%)
Place of birth for the foreign-born population - Belgium (%)
Place of birth for the foreign-born population - France (%)
Place of birth for the foreign-born population - Germany (%)
Place of birth for the foreign-born population - Netherlands (%)
Place of birth for the foreign-born population - Switzerland (%)
Place of birth for the foreign-born population - Other Western Europe (%)
Place of birth for the foreign-born population - Greece (%)
Place of birth for the foreign-born population - Italy (%)
Place of birth for the foreign-born population - Portugal (%)
Place of birth for the foreign-born population - Spain (%)
Place of birth for the foreign-born population - Other Southern Europe (%)
Place of birth for the foreign-born population - Albania (%)
Place of birth for the foreign-born population - Belarus (%)
Place of birth for the foreign-born population - Bosnia and Herzegovina (%)
Place of birth for the foreign-born population - Bulgaria (%)
Place of birth for the foreign-born population - Croatia (%)
Place of birth for the foreign-born population - Czechoslovakia (%)
Place of birth for the foreign-born population - Hungary (%)
Place of birth for the foreign-born population - Latvia (%)
Place of birth for the foreign-born population - Lithuania (%)
Place of birth for the foreign-born population - North Macedonia (Macedonia) (%)
Place of birth for the foreign-born population - Moldova (%)
Place of birth for the foreign-born population - Poland (%)
Place of birth for the foreign-born population - Romania (%)
Place of birth for the foreign-born population - Russia (%)
Place of birth for the foreign-born population - Serbia (%)
Place of birth for the foreign-born population - Ukraine (%)
Place of birth for the foreign-born population - Other Eastern Europe (%)
Place of birth for the foreign-born population - China (%)
Place of birth for the foreign-born population - Hong Kong (%)
Place of birth for the foreign-born population - Taiwan (%)
Place of birth for the foreign-born population - Japan (%)
Place of birth for the foreign-born population - Korea (%)
Place of birth for the foreign-born population - Other Eastern Asia (%)
Place of birth for the foreign-born population - Afghanistan (%)
Place of birth for the foreign-born population - Bangladesh (%)
Place of birth for the foreign-born population - India (%)
Place of birth for the foreign-born population - Iran (%)
Place of birth for the foreign-born population - Kazakhstan (%)
Place of birth for the foreign-born population - Nepal (%)
Place of birth for the foreign-born population - Pakistan (%)
Place of birth for the foreign-born population - Sri Lanka (%)
Place of birth for the foreign-born population - Uzbekistan (%)
Place of birth for the foreign-born population - Other South Central Asia (%)
Place of birth for the foreign-born population - Burma (%)
Place of birth for the foreign-born population - Cambodia (%)
Place of birth for the foreign-born population - Indonesia (%)
Place of birth for the foreign-born population - Laos (%)
Place of birth for the foreign-born population - Malaysia (%)
Place of birth for the foreign-born population - Philippines (%)
Place of birth for the foreign-born population - Singapore (%)
Place of birth for the foreign-born population - Thailand (%)
Place of birth for the foreign-born population - Vietnam (%)
Place of birth for the foreign-born population - Other South Eastern Asia (%)
Place of birth for the foreign-born population - Armenia (%)
Place of birth for the foreign-born population - Iraq (%)
Place of birth for the foreign-born population - Israel (%)
Place of birth for the foreign-born population - Jordan (%)
Place of birth for the foreign-born population - Kuwait (%)
Place of birth for the foreign-born population - Lebanon (%)
Place of birth for the foreign-born population - Saudi Arabia (%)
Place of birth for the foreign-born population - Syria (%)
Place of birth for the foreign-born population - Turkey (%)
Place of birth for the foreign-born population - Yemen (%)
Place of birth for the foreign-born population - Other Western Asia (%)
Place of birth for the foreign-born population - Eritrea (%)
Place of birth for the foreign-born population - Ethiopia (%)
Place of birth for the foreign-born population - Kenya (%)
Place of birth for the foreign-born population - Somalia (%)
Place of birth for the foreign-born population - Uganda (%)
Place of birth for the foreign-born population - Zimbabwe (%)
Place of birth for the foreign-born population - Other Eastern Africa (%)
Place of birth for the foreign-born population - Cameroon (%)
Place of birth for the foreign-born population - Congo (%)
Place of birth for the foreign-born population - Democratic Republic of Congo (Zaire) (%)
Place of birth for the foreign-born population - Other Middle Africa (%)
Place of birth for the foreign-born population - Egypt (%)
Place of birth for the foreign-born population - Morocco (%)
Place of birth for the foreign-born population - Sudan (%)
Place of birth for the foreign-born population - Other Northern Africa (%)
Place of birth for the foreign-born population - South Africa (%)
Place of birth for the foreign-born population - Other Southern Africa (%)
Place of birth for the foreign-born population - Cabo Verde (%)
Place of birth for the foreign-born population - Ghana (%)
Place of birth for the foreign-born population - Liberia (%)
Place of birth for the foreign-born population - Nigeria (%)
Place of birth for the foreign-born population - Senegal (%)
Place of birth for the foreign-born population - Sierra Leone (%)
Place of birth for the foreign-born population - Other Western Africa (%)
Place of birth for the foreign-born population - Australia (%)
Place of birth for the foreign-born population - New Zealand (%)
Place of birth for the foreign-born population - Fiji (%)
Place of birth for the foreign-born population - Micronesia (%)
Place of birth for the foreign-born population - Bahamas (%)
Place of birth for the foreign-born population - Barbados (%)
Place of birth for the foreign-born population - Cuba (%)
Place of birth for the foreign-born population - Dominica (%)
Place of birth for the foreign-born population - Dominican Republic (%)
Place of birth for the foreign-born population - Grenada (%)
Place of birth for the foreign-born population - Haiti (%)
Place of birth for the foreign-born population - Jamaica (%)
Place of birth for the foreign-born population - St. Vincent and the Grenadines (%)
Place of birth for the foreign-born population - Trinidad and Tobago (%)
Place of birth for the foreign-born population - West Indies (%)
Place of birth for the foreign-born population - Other Caribbean (%)
Place of birth for the foreign-born population - Belize (%)
Place of birth for the foreign-born population - Costa Rica (%)
Place of birth for the foreign-born population - El Salvador (%)
Place of birth for the foreign-born population - Guatemala (%)
Place of birth for the foreign-born population - Honduras (%)
Place of birth for the foreign-born population - Mexico (%)
Place of birth for the foreign-born population - Nicaragua (%)
Place of birth for the foreign-born population - Panama (%)
Place of birth for the foreign-born population - Other Central America (%)
Place of birth for the foreign-born population - Argentina (%)
Place of birth for the foreign-born population - Bolivia (%)
Place of birth for the foreign-born population - Brazil (%)
Place of birth for the foreign-born population - Chile (%)
Place of birth for the foreign-born population - Colombia (%)
Place of birth for the foreign-born population - Ecuador (%)
Place of birth for the foreign-born population - Guyana (%)
Place of birth for the foreign-born population - Peru (%)
Place of birth for the foreign-born population - Uruguay (%)
Place of birth for the foreign-born population - Venezuela (%)
Place of birth for the foreign-born population - Other South America (%)
Place of birth for the foreign-born population - Canada (%)
Place of birth for the foreign-born population - Other Northern America (%)
Place of birth for the foreign-born population - Other (%)
Latest news about races in Washougal, WA collected exclusively by city-data.com from local newspapers, TV, and radio stations
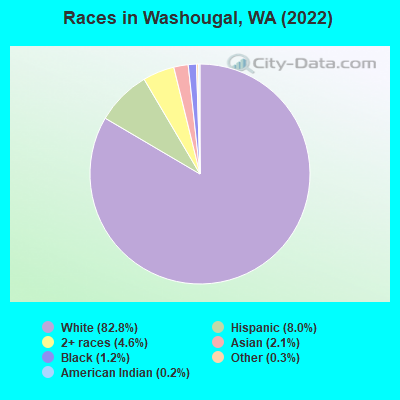
According to 2022 data, the most numerous races in Washougal, WA are White alone (14,281 residents), Hispanic (1,382 residents), and Asian alone (355 residents). 93.2% of Washougal residents speak English at home. 3.5% of Washougal, WA residents are foreign-born (1.2% born in Latin America, 1.1% born in Europe, 0.8% born in Asia), which is 332.0% less than the foreign-born rate of 15.0% across the entire state of Washington.
Race distribution in Washougal
2000
2022
4,652,490 78.9% White alone
441,509 7.5% Hispanic
319,401 5.4% Asian alone
184,631 3.1% Black alone
175,926 3.0% Two or more races
85,396 1.4% American Indian alone
22,779 0.4% Native Hawaiian and Other Pacific Islander alone
11,989 0.2% Other race alone
4,941,456 63.5% White alone
1,093,313 14.0% Hispanic
755,832 9.7% Asian alone
523,448 6.7% Two or more races
299,537 3.8% Black alone
69,024 0.9% American Indian alone
52,231 0.7% Native Hawaiian and Other Pacific Islander alone
50,945 0.7% Other race alone
Income and house value in Washougal Median household income in 2022 $94,958 White non-Hispanic householders
$75,348 Black householders
over $200,000 Asian householders
$86,625 Some other race householders
$97,010 Two or more races householders
$144,104 Hispanic or Latino race householders
Median 2022 house value $567,027 White Non-Hispanic householders
$685,579 Asian householders
$685,579 Some other race householders
$572,511 Two or more races householders
$378,018 Hispanic or Latino householders
Median age by race in Washougal
40.5 Median age for White residents40.7 Males40.6 Females20.2 Median age for Black or African American residents15.5 Males60.9 Females57.5 Median age for American Indian / Alaska Native residents38.7 Males-640,557,005.5 Females33.6 Median age for Asian residents20.0 Males33.1 Females-779,279,278.5 Median age for Native Hawaiian / Pacific Islander residents-779,310,344.0 Males-928,017,717.8 Females37.3 Median age for Other race residents33.5 Males57.3 Females30.8 Median age for Two or more races residents30.9 Males35.1 Females40.1 Median age for White alone residents39.9 Males40.3 Females32.5 Median age for Hispanic or Latino residents29.2 Males35.0 Females
Owner/renter occupied households by race in Washougal
House owners and renters - White residents 4,168 76.7% Owner occupied1,265 23.3% Renter occupiedHouse owners and renters - Black or African American residents 5 10.3% Owner occupied43 89.7% Renter occupiedHouse owners and renters - American Indian / Alaska Native residents 7 57.5% Owner occupied5 42.5% Renter occupiedHouse owners and renters - Asian residents 91 92.4% Owner occupied7 7.6% Renter occupiedHouse owners and renters - Other race residents 134 80.0% Owner occupied33 20.0% Renter occupiedHouse owners and renters - Two or more races residents 546 85.1% Owner occupied96 14.9% Renter occupiedHouse owners and renters - White alone residents 4,104 75.8% Owner occupied1,313 24.2% Renter occupiedHouse owners and renters - Hispanic or Latino residents 303 77.3% Owner occupied89 22.7% Renter occupied
Language usage in Washougal
English speakers - Total 93.2% of residents of Washougal speak English at home.
4.8% of residents speak Spanish at home 688 87.1% Speak English very well102 12.9% Speak English less than very well2.6% of residents speak other language at home 399 91.9% Speak English very well35 8.1% Speak English less than very well
English speakers - Born in the United States 93.4% of residents of Washougal speak English at home.
4.7% of residents speak Spanish at home 494 99.6% Speak English very well2 0.4% Speak English less than very well1.6% of residents speak other language at home 165 100.0% Speak English very well
English speakers - Native, born elsewhere 83.6% of residents of Washougal speak English at home.
3.5% of residents speak Spanish at home 8 100.0% Speak English very well8.8% of residents speak other language at home 20 100.0% Speak English very well
English speakers - Foreign-born 40.6% of residents of Washougal speak English at home.
38.1% of residents speak Spanish at home 114 53.8% Speak English very well98 46.2% Speak English less than very well27.0% of residents speak other language at home 131 87.3% Speak English very well19 12.7% Speak English less than very well
White (Caucasian) - Speak only English Native:
98.2% (13,418)Foreign-born:
78.6% (167)
White (Caucasian) - Speak another language Native:
2.0% (277)Foreign-born:
34.6% (74)
Asian - Speak only English Native:
43.5% (89)Foreign-born:
40.7% (59)
Asian - Speak another language Native:
58.1% (119)Foreign-born:
63.8% (92)
Other race - Speak only English Native:
73.0% (163)Foreign-born:
3.1% (4)
Other race - Speak another language Native:
31.0% (69)Foreign-born:
96.8% (119)
Two or more races - Speak another language Native:
35.5% (489)Foreign-born:
100.0% (63)
White alone - Speak only English Native:
97.6% (13,189)Foreign-born:
77.4% (166)
White alone - Speak another language Native:
2.2% (292)Foreign-born:
29.7% (64)
Hispanic or Latino - Speak only English Native:
62.9% (705)Foreign-born:
4.3% (9)
Hispanic or Latino - Speak another language Native:
37.0% (415)Foreign-born:
99.5% (206)
Foreign-born residents in Washougal 599 residents are foreign born (1.2% Latin America , 1.1% Europe , 0.8% Asia ).
This city:
3.5%Washington:
14.9%
Marital status for residents in Washougal Marital status - White (Caucasian) population 15 years and over
Males 28.2% Never married54.2% Now married1.7% Separated2.0% Widowed13.9% DivorcedFemales 27.9% Never married51.1% Now married0.7% Separated9.5% Widowed10.8% DivorcedWomen who gave birth in the past 12 months Now married:
90.8% (106)Unmarried:
9.2% (11)
Women who did not give birth in the past 12 months Now married:
47.8% (1,692)Unmarried:
52.2% (1,846)
Marital status - Black or African American population 15 years and over
Males 44.2% Never married51.9% Now married0.0% Separated0.0% Widowed3.9% DivorcedFemales 44.7% Never married55.3% Now married0.0% Separated0.0% Widowed0.0% DivorcedWomen who did not give birth in the past 12 months Now married:
0.0% (0)Unmarried:
100.0% (21)
Marital status - American Indian / Alaska Native population 15 years and over
Males 0.0% Never married30.8% Now married0.0% Separated0.0% Widowed69.2% DivorcedFemales 0.0% Never married100.0% Now married0.0% Separated0.0% Widowed0.0% DivorcedMarital status - Asian population 15 years and over
Males 38.7% Never married61.3% Now married0.0% Separated0.0% Widowed0.0% DivorcedFemales 43.8% Never married53.4% Now married0.0% Separated0.0% Widowed2.9% DivorcedWomen who did not give birth in the past 12 months Now married:
38.9% (62)Unmarried:
61.1% (97)
Marital status - Other race population 15 years and over
Males 45.5% Never married40.7% Now married0.0% Separated0.0% Widowed13.8% DivorcedFemales 13.0% Never married65.2% Now married0.0% Separated16.7% Widowed5.1% DivorcedWomen who did not give birth in the past 12 months Now married:
63.5% (35)Unmarried:
36.5% (20)
Marital status - Two or more races population 15 years and over
Males 61.9% Never married28.2% Now married3.2% Separated0.0% Widowed6.7% DivorcedFemales 22.0% Never married48.2% Now married0.0% Separated18.6% Widowed11.2% DivorcedWomen who did not give birth in the past 12 months Now married:
62.4% (230)Unmarried:
37.6% (138)
Marital status - White alone, not Hispanic / Latino population 15 years and over
Males 27.0% Never married54.8% Now married1.7% Separated2.1% Widowed14.3% DivorcedFemales 27.1% Never married51.8% Now married0.7% Separated9.7% Widowed10.6% DivorcedWomen who gave birth in the past 12 months Now married:
90.8% (110)Unmarried:
9.2% (11)
Women who did not give birth in the past 12 months Now married:
48.8% (1,720)Unmarried:
51.2% (1,805)
Marital status - Hispanic or Latino population 15 years and over
Males 63.3% Never married34.4% Now married0.0% Separated0.0% Widowed2.3% DivorcedFemales 29.6% Never married52.3% Now married0.0% Separated7.0% Widowed11.1% DivorcedWomen who did not give birth in the past 12 months Now married:
48.2% (136)Unmarried:
51.8% (146)
Ancestries in Washougal
931 13.1% German
912 12.8% English
607 8.5% American
538 7.6% European
430 6.0% Irish
308 4.3% French Canadian
291 4.1% Norwegian
160 2.2% Scandinavian
71 1.0% Czech
62 0.9% Italian
55 0.8% Russian
48 0.7% Polish
47 0.7% British
47 0.7% Portuguese
43 0.6% Croatian
41 0.6% Canadian
36 0.5% Slovak
35 0.5% Scotch-Irish
34 0.5% Swedish
33 0.5% Scottish
29 0.4% Northern European
26 0.4% Danish
25 0.4% Eastern European
19 0.3% African
18 0.3% Lithuanian
16 0.2% Yugoslavian
15 0.2% Belgian
13 0.2% French
13 0.2% Welsh
7 0.10% Serbian
5 0.07% Dutch
2 0.03% Pennsylvania German
Geographical mobility in Washougal
Same house 1 year ago 11,965 84.0% White (Caucasian)
195 91.0% Black or African American
52 100.0% American Indian / Alaska Native
258 72.6% Asian
302 86.4% Other race
1,464 88.7% Two or more races
12,032 84.7% White alone, not Hispanic / Latino
1,016 74.2% Hispanic or Latino
Moved within same county 1,173 8.2% White / Caucasian
15 4.3% Asian
36 10.3% Other race
71 4.3% Two or more races
1,173 8.3% White alone, not Hispanic / Latino
110 8.0% Hispanic or Latino
Moved within same state 116 0.8% White / Caucasian
3 1.6% Black or African American
14 4.0% Other race
126 0.9% White alone, not Hispanic / Latino
Moved from different state 991 7.0% White / Caucasian
92 25.8% Asian
150 9.1% Two or more races
820 5.8% White alone, not Hispanic / Latino
212 15.4% Hispanic or Latino
Moved from abroad 27 0.2% White
16 0.1% White alone, not Hispanic / Latino
Children Nativity (place of birth) in Washougal
Children under 6 years - Living with two parents Both parents native 534 100.0% NativeOne native, one foreign-born parent 56 100.0% NativeChildren under 6 years - Living with one parent Native parent 335 100.0% NativeForeign-born parent 9 100.0% NativeChildren 6 to 17 years - Living with two parents Both parents native 1,684 100.0% NativeBoth parents foreign-born 76 100.0% NativeOne native, one foreign-born parent 122 94.7% Native7 5.3% Foreign-bornChildren 6 to 17 years - Living with one parent Native parent 579 100.0% NativeForeign-born parent 6 52.5% Native6 47.5% Foreign-born
Grandparents responsible for own grandchildren in Washougal
Grandparents (30 to 59 years) White / Caucasian 37 42.3% Responsible for grandchildren50 57.7% Not responsible for grandchildrenWhite alone, not Hispanic / Latino 37 38.3% Responsible for grandchildren59 61.7% Not responsible for grandchildrenGrandparents (60 years and over) White / Caucasian 51 32.0% Responsible for grandchildren108 68.0% Not responsible for grandchildrenWhite alone, not Hispanic / Latino 54 32.2% Responsible for grandchildren113 67.8% Not responsible for grandchildren