Races in Wallingford Center, Connecticut (CT) Detailed Stats
Data:
Races - White alone (%)
Races - White alone (% change since 2000)
Races - Black alone (%)
Races - Black alone (% change since 2000)
Races - American Indian alone (%)
Races - American Indian alone (% change since 2000)
Races - Asian alone (%)
Races - Asian alone (% change since 2000)
Races - Hispanic (%)
Races - Hispanic (% change since 2000)
Races - Native Hawaiian and Other Pacific Islander alone (%)
Races - Native Hawaiian and Other Pacific Islander alone (% change since 2000)
Races - Two or more races(%)
Races - Two or more races(% change since 2000)
Races - Other race alone (%)
Races - Other race alone (% change since 2000)
Racial diversity
Place of birth - Born in state of residence (%)
Place of birth - Born in state of residence (%) - White
Place of birth - Born in state of residence (%) - Black or African American
Place of birth - Born in state of residence (%) - Asian
Place of birth - Born in state of residence (%) - Hispanic or Latino
Place of birth - Born in state of residence (%) - American Indian and Alaska Native
Place of birth - Born in state of residence (%) - Multirace
Place of birth - Born in state of residence (%) - Other Race
Place of birth - Born in other state (%)
Place of birth - Born in other state (%) - White
Place of birth - Born in other state (%) - Black or African American
Place of birth - Born in other state (%) - Asian
Place of birth - Born in other state (%) - Hispanic or Latino
Place of birth - Born in other state (%) - American Indian and Alaska Native
Place of birth - Born in other state (%) - Multirace
Place of birth - Born in other state (%) - Other Race
Place of birth - Native, outside of US (%)
Place of birth - Native, outside of US (%) - White
Place of birth - Native, outside of US (%) - Black or African American
Place of birth - Native, outside of US (%) - Asian
Place of birth - Native, outside of US (%) - Hispanic or Latino
Place of birth - Native, outside of US (%) - American Indian and Alaska Native
Place of birth - Native, outside of US (%) - Multirace
Place of birth - Native, outside of US (%) - Other Race
Place of birth - Foreign born (%)
Place of birth - Foreign born (%) - White
Place of birth - Foreign born (%) - Black or African American
Place of birth - Foreign born (%) - Asian
Place of birth - Foreign born (%) - Hispanic or Latino
Place of birth - Foreign born (%) - American Indian and Alaska Native
Place of birth - Foreign born (%) - Multirace
Place of birth - Foreign born (%) - Other Race
Residents speaking English at home (%)
Residents speaking English at home - Born in the United States (%)
Residents speaking English at home - Native, born elsewhere (%)
Residents speaking English at home - Foreign born (%)
Residents speaking Spanish at home (%)
Residents speaking Spanish at home - Born in the United States (%)
Residents speaking Spanish at home - Native, born elsewhere (%)
Residents speaking Spanish at home - Foreign born (%)
Residents speaking other language at home (%)
Residents speaking other language at home - Born in the United States (%)
Residents speaking other language at home - Native, born elsewhere (%)
Residents speaking other language at home - Foreign born (%)
Marital status - Never married (%)
Marital status - Now married (%)
Marital status - Separated (%)
Marital status - Widowed (%)
Marital status - Divorced (%)
Ancestries Reported - Arab (%)
Ancestries Reported - Czech (%)
Ancestries Reported - Danish (%)
Ancestries Reported - Dutch (%)
Ancestries Reported - English (%)
Ancestries Reported - French (%)
Ancestries Reported - French Canadian (%)
Ancestries Reported - German (%)
Ancestries Reported - Greek (%)
Ancestries Reported - Hungarian (%)
Ancestries Reported - Irish (%)
Ancestries Reported - Italian (%)
Ancestries Reported - Lithuanian (%)
Ancestries Reported - Norwegian (%)
Ancestries Reported - Polish (%)
Ancestries Reported - Portuguese (%)
Ancestries Reported - Russian (%)
Ancestries Reported - Scotch-Irish (%)
Ancestries Reported - Scottish (%)
Ancestries Reported - Slovak (%)
Ancestries Reported - Subsaharan African (%)
Ancestries Reported - Swedish (%)
Ancestries Reported - Swiss (%)
Ancestries Reported - Ukrainian (%)
Ancestries Reported - United States (%)
Ancestries Reported - Welsh (%)
Ancestries Reported - West Indian (%)
Ancestries Reported - Other (%)
Geographical mobility - Same house 1 year ago (%)
Geographical mobility - Same house 1 year ago (%) - White
Geographical mobility - Same house 1 year ago (%) - Black or African American
Geographical mobility - Same house 1 year ago (%) - Asian
Geographical mobility - Same house 1 year ago (%) - Hispanic or Latino
Geographical mobility - Same house 1 year ago (%) - American Indian and Alaska Native
Geographical mobility - Same house 1 year ago (%) - Multirace
Geographical mobility - Same house 1 year ago (%) - Other Race
Geographical mobility - Moved within same county (%)
Geographical mobility - Moved within same county (%) - White
Geographical mobility - Moved within same county (%) - Black or African American
Geographical mobility - Moved within same county (%) - Asian
Geographical mobility - Moved within same county (%) - Hispanic or Latino
Geographical mobility - Moved within same county (%) - American Indian and Alaska Native
Geographical mobility - Moved within same county (%) - Multirace
Geographical mobility - Moved within same county (%) - Other Race
Geographical mobility - Moved from different county within same state (%)
Geographical mobility - Moved from different county within same state (%) - White
Geographical mobility - Moved from different county within same state (%) - Black or African American
Geographical mobility - Moved from different county within same state (%) - Asian
Geographical mobility - Moved from different county within same state (%) - Hispanic or Latino
Geographical mobility - Moved from different county within same state (%) - American Indian and Alaska Native
Geographical mobility - Moved from different county within same state (%) - Multirace
Geographical mobility - Moved from different county within same state (%) - Other Race
Geographical mobility - Moved from different state (%)
Geographical mobility - Moved from different state (%) - White
Geographical mobility - Moved from different state (%) - Black or African American
Geographical mobility - Moved from different state (%) - Asian
Geographical mobility - Moved from different state (%) - Hispanic or Latino
Geographical mobility - Moved from different state (%) - American Indian and Alaska Native
Geographical mobility - Moved from different state (%) - Multirace
Geographical mobility - Moved from different state (%) - Other Race
Geographical mobility - Moved from abroad (%)
Geographical mobility - Moved from abroad (%) - White
Geographical mobility - Moved from abroad (%) - Black or African American
Geographical mobility - Moved from abroad (%) - Asian
Geographical mobility - Moved from abroad (%) - Hispanic or Latino
Geographical mobility - Moved from abroad (%) - American Indian and Alaska Native
Geographical mobility - Moved from abroad (%) - Multirace
Geographical mobility - Moved from abroad (%) - Other Race
Place of birth for the foreign-born population - Ireland (%)
Place of birth for the foreign-born population - Denmark (%)
Place of birth for the foreign-born population - Norway (%)
Place of birth for the foreign-born population - Sweden (%)
Place of birth for the foreign-born population - United Kingdom (%)
Place of birth for the foreign-born population - England (%)
Place of birth for the foreign-born population - Scotland (%)
Place of birth for the foreign-born population - Other Northern Europe (%)
Place of birth for the foreign-born population - Austria (%)
Place of birth for the foreign-born population - Belgium (%)
Place of birth for the foreign-born population - France (%)
Place of birth for the foreign-born population - Germany (%)
Place of birth for the foreign-born population - Netherlands (%)
Place of birth for the foreign-born population - Switzerland (%)
Place of birth for the foreign-born population - Other Western Europe (%)
Place of birth for the foreign-born population - Greece (%)
Place of birth for the foreign-born population - Italy (%)
Place of birth for the foreign-born population - Portugal (%)
Place of birth for the foreign-born population - Spain (%)
Place of birth for the foreign-born population - Other Southern Europe (%)
Place of birth for the foreign-born population - Albania (%)
Place of birth for the foreign-born population - Belarus (%)
Place of birth for the foreign-born population - Bosnia and Herzegovina (%)
Place of birth for the foreign-born population - Bulgaria (%)
Place of birth for the foreign-born population - Croatia (%)
Place of birth for the foreign-born population - Czechoslovakia (%)
Place of birth for the foreign-born population - Hungary (%)
Place of birth for the foreign-born population - Latvia (%)
Place of birth for the foreign-born population - Lithuania (%)
Place of birth for the foreign-born population - North Macedonia (Macedonia) (%)
Place of birth for the foreign-born population - Moldova (%)
Place of birth for the foreign-born population - Poland (%)
Place of birth for the foreign-born population - Romania (%)
Place of birth for the foreign-born population - Russia (%)
Place of birth for the foreign-born population - Serbia (%)
Place of birth for the foreign-born population - Ukraine (%)
Place of birth for the foreign-born population - Other Eastern Europe (%)
Place of birth for the foreign-born population - China (%)
Place of birth for the foreign-born population - Hong Kong (%)
Place of birth for the foreign-born population - Taiwan (%)
Place of birth for the foreign-born population - Japan (%)
Place of birth for the foreign-born population - Korea (%)
Place of birth for the foreign-born population - Other Eastern Asia (%)
Place of birth for the foreign-born population - Afghanistan (%)
Place of birth for the foreign-born population - Bangladesh (%)
Place of birth for the foreign-born population - India (%)
Place of birth for the foreign-born population - Iran (%)
Place of birth for the foreign-born population - Kazakhstan (%)
Place of birth for the foreign-born population - Nepal (%)
Place of birth for the foreign-born population - Pakistan (%)
Place of birth for the foreign-born population - Sri Lanka (%)
Place of birth for the foreign-born population - Uzbekistan (%)
Place of birth for the foreign-born population - Other South Central Asia (%)
Place of birth for the foreign-born population - Burma (%)
Place of birth for the foreign-born population - Cambodia (%)
Place of birth for the foreign-born population - Indonesia (%)
Place of birth for the foreign-born population - Laos (%)
Place of birth for the foreign-born population - Malaysia (%)
Place of birth for the foreign-born population - Philippines (%)
Place of birth for the foreign-born population - Singapore (%)
Place of birth for the foreign-born population - Thailand (%)
Place of birth for the foreign-born population - Vietnam (%)
Place of birth for the foreign-born population - Other South Eastern Asia (%)
Place of birth for the foreign-born population - Armenia (%)
Place of birth for the foreign-born population - Iraq (%)
Place of birth for the foreign-born population - Israel (%)
Place of birth for the foreign-born population - Jordan (%)
Place of birth for the foreign-born population - Kuwait (%)
Place of birth for the foreign-born population - Lebanon (%)
Place of birth for the foreign-born population - Saudi Arabia (%)
Place of birth for the foreign-born population - Syria (%)
Place of birth for the foreign-born population - Turkey (%)
Place of birth for the foreign-born population - Yemen (%)
Place of birth for the foreign-born population - Other Western Asia (%)
Place of birth for the foreign-born population - Eritrea (%)
Place of birth for the foreign-born population - Ethiopia (%)
Place of birth for the foreign-born population - Kenya (%)
Place of birth for the foreign-born population - Somalia (%)
Place of birth for the foreign-born population - Uganda (%)
Place of birth for the foreign-born population - Zimbabwe (%)
Place of birth for the foreign-born population - Other Eastern Africa (%)
Place of birth for the foreign-born population - Cameroon (%)
Place of birth for the foreign-born population - Congo (%)
Place of birth for the foreign-born population - Democratic Republic of Congo (Zaire) (%)
Place of birth for the foreign-born population - Other Middle Africa (%)
Place of birth for the foreign-born population - Egypt (%)
Place of birth for the foreign-born population - Morocco (%)
Place of birth for the foreign-born population - Sudan (%)
Place of birth for the foreign-born population - Other Northern Africa (%)
Place of birth for the foreign-born population - South Africa (%)
Place of birth for the foreign-born population - Other Southern Africa (%)
Place of birth for the foreign-born population - Cabo Verde (%)
Place of birth for the foreign-born population - Ghana (%)
Place of birth for the foreign-born population - Liberia (%)
Place of birth for the foreign-born population - Nigeria (%)
Place of birth for the foreign-born population - Senegal (%)
Place of birth for the foreign-born population - Sierra Leone (%)
Place of birth for the foreign-born population - Other Western Africa (%)
Place of birth for the foreign-born population - Australia (%)
Place of birth for the foreign-born population - New Zealand (%)
Place of birth for the foreign-born population - Fiji (%)
Place of birth for the foreign-born population - Micronesia (%)
Place of birth for the foreign-born population - Bahamas (%)
Place of birth for the foreign-born population - Barbados (%)
Place of birth for the foreign-born population - Cuba (%)
Place of birth for the foreign-born population - Dominica (%)
Place of birth for the foreign-born population - Dominican Republic (%)
Place of birth for the foreign-born population - Grenada (%)
Place of birth for the foreign-born population - Haiti (%)
Place of birth for the foreign-born population - Jamaica (%)
Place of birth for the foreign-born population - St. Vincent and the Grenadines (%)
Place of birth for the foreign-born population - Trinidad and Tobago (%)
Place of birth for the foreign-born population - West Indies (%)
Place of birth for the foreign-born population - Other Caribbean (%)
Place of birth for the foreign-born population - Belize (%)
Place of birth for the foreign-born population - Costa Rica (%)
Place of birth for the foreign-born population - El Salvador (%)
Place of birth for the foreign-born population - Guatemala (%)
Place of birth for the foreign-born population - Honduras (%)
Place of birth for the foreign-born population - Mexico (%)
Place of birth for the foreign-born population - Nicaragua (%)
Place of birth for the foreign-born population - Panama (%)
Place of birth for the foreign-born population - Other Central America (%)
Place of birth for the foreign-born population - Argentina (%)
Place of birth for the foreign-born population - Bolivia (%)
Place of birth for the foreign-born population - Brazil (%)
Place of birth for the foreign-born population - Chile (%)
Place of birth for the foreign-born population - Colombia (%)
Place of birth for the foreign-born population - Ecuador (%)
Place of birth for the foreign-born population - Guyana (%)
Place of birth for the foreign-born population - Peru (%)
Place of birth for the foreign-born population - Uruguay (%)
Place of birth for the foreign-born population - Venezuela (%)
Place of birth for the foreign-born population - Other South America (%)
Place of birth for the foreign-born population - Canada (%)
Place of birth for the foreign-born population - Other Northern America (%)
Place of birth for the foreign-born population - Other (%)
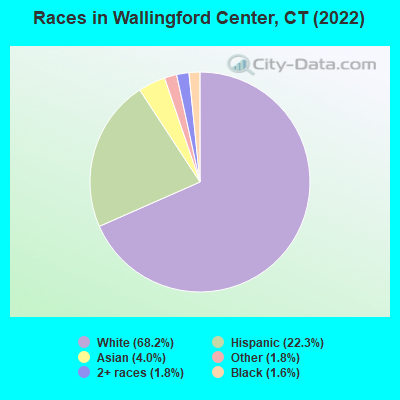
According to 2022 data, the most numerous races in Wallingford Center, CT are White alone (12,832 residents), Hispanic (4,198 residents), and Black alone (304 residents). 76.2% of Wallingford Center residents speak English at home. 16.8% of Wallingford Center, CT residents are foreign-born (10.5% born in Latin America, 2.9% born in Asia, 2.3% born in Europe), which is 10.6% greater than the foreign-born rate of 15.0% across the entire state of Connecticut.
Race distribution in Wallingford Center
2000 2022
2,638,845 77.5% White alone 320,323 9.4% Hispanic 295,571 8.7% Black alone 81,564 2.4% Asian alone 52,896 1.6% Two or more races 8,141 0.2% Other race alone 7,267 0.2% American Indian alone 958 0.03% Native Hawaiian and Other
2,246,913 62.0% White alone 658,978 18.2% Hispanic 353,973 9.8% Black alone 172,929 4.8% Asian alone 159,631 4.4% Two or more races 29,761 0.8% Other race alone 3,428 0.09% American Indian alone 592 0.02% Native Hawaiian and Other
Income and house value in Wallingford Center Median household income in 2022 $78,602 White non-Hispanic householders$48,197 Black householders$135,990 Asian householders$124,729 Some other race householders$99,670 Two or more races householders$101,892 Hispanic or Latino race householdersMedian 2022 house value $305,306 White Non-Hispanic householders$222,232 Black or African American householders $296,028 Asian householders$205,575 Some other race householders$395,337 Two or more races householders$266,510 Hispanic or Latino householders
Median age by race in Wallingford Center
45.3 Median age for White residents43.2 49.3 47.7 Median age for Black or African American residents52.1 29.9 -742,173,111.6 Median age for American Indian / Alaska Native residents-701,030,927.1 -704,477,611.2 36.9 Median age for Asian residents36.1 39.6 -641,269,840.6 Median age for Native Hawaiian / Pacific Islander residents-414,239,481.8 -691,588,784.4 27.4 Median age for Other race residents26.9 27.3 28.8 Median age for Two or more races residents27.5 29.0 47.8 Median age for White alone residents43.4 51.6 27.0 Median age for Hispanic or Latino residents27.4 25.5
Owner/renter occupied households by race in Wallingford Center
House owners and renters - White residents 4,075 61.5% Owner occupied2,552 38.5% Renter occupiedHouse owners and renters - Black or African American residents 30 25.3% Owner occupied89 74.7% Renter occupiedHouse owners and renters - Asian residents 226 80.8% Owner occupied54 19.2% Renter occupiedHouse owners and renters - Other race residents 474 79.2% Owner occupied125 20.8% Renter occupiedHouse owners and renters - Two or more races residents 298 52.8% Owner occupied266 47.2% Renter occupiedHouse owners and renters - White alone residents 4,037 62.0% Owner occupied2,474 38.0% Renter occupiedHouse owners and renters - Hispanic or Latino residents 637 53.6% Owner occupied551 46.4% Renter occupied
Language usage in Wallingford Center
English speakers - Total 76.2% of residents of Wallingford Center speak English at home.
17.4% of residents speak Spanish at home 1,534 49.2% Speak English very well1,581 50.8% Speak English less than very well6.6% of residents speak other language at home 829 70.3% Speak English very well350 29.7% Speak English less than very well
English speakers - Born in the United States 90.8% of residents of Wallingford Center speak English at home.
5.2% of residents speak Spanish at home 127 71.8% Speak English very well50 28.2% Speak English less than very well3.6% of residents speak other language at home 108 87.8% Speak English very well15 12.2% Speak English less than very well
English speakers - Native, born elsewhere 20.1% of residents of Wallingford Center speak English at home.
78.2% of residents speak Spanish at home 170 73.9% Speak English very well60 26.1% Speak English less than very well
English speakers - Foreign-born 11.5% of residents of Wallingford Center speak English at home.
62.7% of residents speak Spanish at home 525 26.8% Speak English very well1,431 73.2% Speak English less than very well27.1% of residents speak other language at home 554 65.4% Speak English very well293 34.6% Speak English less than very well
White (Caucasian) - Speak only English Native:
96.5% (11,900)Foreign-born:
25.5% (192)
White (Caucasian) - Speak another language Native:
4.0% (494)Foreign-born:
73.5% (553)
Black or African American - Speak only English Native:
99.1% (239)Foreign-born:
62.6% (44)
Asian - Speak only English Native:
81.3% (179)Foreign-born:
16.2% (88)
Asian - Speak another language Native:
20.1% (44)Foreign-born:
83.7% (455)
Other race - Speak only English Native:
43.9% (392)Foreign-born:
0.5% (6)
Other race - Speak another language Native:
57.2% (510)Foreign-born:
100.0% (1,271)
Two or more races - Speak another language Native:
54.1% (480)Foreign-born:
100.0% (671)
White alone - Speak only English Native:
97.4% (11,621)Foreign-born:
38.6% (198)
White alone - Speak another language Native:
2.6% (305)Foreign-born:
61.6% (317)
Hispanic or Latino - Speak only English Native:
35.6% (621)Foreign-born:
0.3% (5)
Hispanic or Latino - Speak another language Native:
64.0% (1,116)Foreign-born:
100.0% (1,934)
Foreign-born residents in Wallingford Center 3,158 residents are foreign born (10.5% Latin America , 2.9% Asia , 2.3% Europe ).
This city:
16.8%Connecticut:
15.0%
Marital status for residents in Wallingford Center Marital status - White (Caucasian) population 15 years and over
Males 35.2% Never married47.2% Now married2.5% Separated5.5% Widowed9.7% DivorcedFemales 28.9% Never married39.7% Now married2.1% Separated10.6% Widowed18.7% DivorcedWomen who gave birth in the past 12 months Now married:
80.8% (54)Unmarried:
19.2% (13)
Women who did not give birth in the past 12 months Now married:
43.7% (1,295)Unmarried:
56.3% (1,670)
Marital status - Black or African American population 15 years and over
Males 72.2% Never married24.7% Now married3.1% Separated0.0% Widowed0.0% DivorcedFemales 79.1% Never married5.2% Now married0.0% Separated15.7% Widowed0.0% DivorcedWomen who did not give birth in the past 12 months Now married:
6.5% (7)Unmarried:
93.5% (98)
Marital status - Asian population 15 years and over
Males 33.4% Never married66.6% Now married0.0% Separated0.0% Widowed0.0% DivorcedFemales 18.1% Never married78.4% Now married0.0% Separated0.0% Widowed3.4% DivorcedWomen who did not give birth in the past 12 months Now married:
77.7% (168)Unmarried:
22.3% (48)
Marital status - Other race population 15 years and over
Males 21.9% Never married77.1% Now married0.1% Separated0.0% Widowed0.9% DivorcedFemales 37.7% Never married57.0% Now married0.0% Separated5.2% Widowed0.0% DivorcedWomen who did not give birth in the past 12 months Now married:
60.2% (467)Unmarried:
39.8% (309)
Marital status - Two or more races population 15 years and over
Males 31.7% Never married44.3% Now married8.3% Separated7.6% Widowed8.1% DivorcedFemales 38.7% Never married37.3% Now married0.0% Separated0.0% Widowed24.0% DivorcedWomen who did not give birth in the past 12 months Now married:
44.0% (151)Unmarried:
56.0% (193)
Marital status - White alone, not Hispanic / Latino population 15 years and over
Males 35.2% Never married45.8% Now married2.7% Separated5.9% Widowed10.4% DivorcedFemales 26.8% Never married40.0% Now married1.7% Separated11.3% Widowed20.1% DivorcedWomen who gave birth in the past 12 months Now married:
80.8% (57)Unmarried:
19.2% (14)
Women who did not give birth in the past 12 months Now married:
44.6% (1,190)Unmarried:
55.4% (1,479)
Marital status - Hispanic or Latino population 15 years and over
Males 25.0% Never married66.9% Now married2.3% Separated2.6% Widowed3.2% DivorcedFemales 39.1% Never married48.6% Now married2.7% Separated3.8% Widowed5.8% DivorcedWomen who did not give birth in the past 12 months Now married:
53.8% (603)Unmarried:
46.2% (518)
Ancestries in Wallingford Center
1,929 20.1% Italian1,358 14.1% Irish440 4.6% Polish330 3.4% English247 2.6% German167 1.7% Portuguese131 1.4% American120 1.2% French Canadian108 1.1% Dutch102 1.1% Russian97 1.0% Greek77 0.8% French76 0.8% Scottish57 0.6% Welsh49 0.5% Yugoslavian37 0.4% Hungarian36 0.4% Jamaican32 0.3% European31 0.3% Brazilian26 0.3% Swedish24 0.2% Eastern European21 0.2% Ukrainian19 0.2% Guyanese19 0.2% Haitian15 0.2% Ghanaian14 0.1% Canadian12 0.1% Turkish11 0.1% Czechoslovakian8 0.08% Lebanese8 0.08% Armenian8 0.08% Scotch-Irish5 0.05% African4 0.04% Lithuanian2 0.02% Trinidadian and Tobagonian
Geographical mobility in Wallingford Center Same house 1 year ago 12,076 89.0% White (Caucasian)278 89.0% Black or African American2 94.8% American Indian / Alaska Native533 69.3% Asian1,148 47.3% Other race1,262 81.5% Two or more races11,265 88.2% White alone, not Hispanic / Latino2,805 67.7% Hispanic or LatinoMoved within same county 834 6.2% White / Caucasian23 7.4% Black or African American176 22.9% Asian868 35.8% Other race214 13.9% Two or more races893 7.0% White alone, not Hispanic / Latino1,006 24.3% Hispanic or LatinoMoved within same state 228 1.7% White / Caucasian2 0.7% Black or African American3 0.1% Other race239 1.9% White alone, not Hispanic / Latino3 0.1% Hispanic or LatinoMoved from different state 307 2.3% White / Caucasian12 1.5% Asian33 2.1% Two or more races242 1.9% White alone, not Hispanic / Latino79 1.9% Hispanic or LatinoMoved from abroad 8 0.1% White10 0.7% Two or more races8 0.1% White alone, not Hispanic / Latino
Children Nativity (place of birth) in Wallingford Center
Children under 6 years - Living with two parents Both parents native 439 100.0% NativeBoth parents foreign-born 167 100.0% NativeOne native, one foreign-born parent 119 100.0% NativeChildren under 6 years - Living with one parent Native parent 311 100.0% NativeForeign-born parent 11 16.8% Native53 83.2% Foreign-bornChildren 6 to 17 years - Living with two parents Both parents native 1,046 100.0% NativeBoth parents foreign-born 395 87.7% Native55 12.3% Foreign-bornOne native, one foreign-born parent 110 100.0% NativeChildren 6 to 17 years - Living with one parent Native parent 395 100.0% NativeForeign-born parent 61 54.0% Native52 46.0% Foreign-born
Grandparents responsible for own grandchildren in Wallingford Center
Grandparents (30 to 59 years) White / Caucasian 6 100.0% Not responsible for grandchildrenWhite alone, not Hispanic / Latino 8 100.0% Not responsible for grandchildren
Grandparents (60 years and over) White / Caucasian 56 100.0% Not responsible for grandchildrenWhite alone, not Hispanic / Latino 59 100.0% Not responsible for grandchildren