Races in Wakefield-Peacedale, Rhode Island (RI) Detailed Stats
Data:
Races - White alone (%)
Races - White alone (% change since 2000)
Races - Black alone (%)
Races - Black alone (% change since 2000)
Races - American Indian alone (%)
Races - American Indian alone (% change since 2000)
Races - Asian alone (%)
Races - Asian alone (% change since 2000)
Races - Hispanic (%)
Races - Hispanic (% change since 2000)
Races - Native Hawaiian and Other Pacific Islander alone (%)
Races - Native Hawaiian and Other Pacific Islander alone (% change since 2000)
Races - Two or more races(%)
Races - Two or more races(% change since 2000)
Races - Other race alone (%)
Races - Other race alone (% change since 2000)
Racial diversity
Place of birth - Born in state of residence (%)
Place of birth - Born in state of residence (%) - White
Place of birth - Born in state of residence (%) - Black or African American
Place of birth - Born in state of residence (%) - Asian
Place of birth - Born in state of residence (%) - Hispanic or Latino
Place of birth - Born in state of residence (%) - American Indian and Alaska Native
Place of birth - Born in state of residence (%) - Multirace
Place of birth - Born in state of residence (%) - Other Race
Place of birth - Born in other state (%)
Place of birth - Born in other state (%) - White
Place of birth - Born in other state (%) - Black or African American
Place of birth - Born in other state (%) - Asian
Place of birth - Born in other state (%) - Hispanic or Latino
Place of birth - Born in other state (%) - American Indian and Alaska Native
Place of birth - Born in other state (%) - Multirace
Place of birth - Born in other state (%) - Other Race
Place of birth - Native, outside of US (%)
Place of birth - Native, outside of US (%) - White
Place of birth - Native, outside of US (%) - Black or African American
Place of birth - Native, outside of US (%) - Asian
Place of birth - Native, outside of US (%) - Hispanic or Latino
Place of birth - Native, outside of US (%) - American Indian and Alaska Native
Place of birth - Native, outside of US (%) - Multirace
Place of birth - Native, outside of US (%) - Other Race
Place of birth - Foreign born (%)
Place of birth - Foreign born (%) - White
Place of birth - Foreign born (%) - Black or African American
Place of birth - Foreign born (%) - Asian
Place of birth - Foreign born (%) - Hispanic or Latino
Place of birth - Foreign born (%) - American Indian and Alaska Native
Place of birth - Foreign born (%) - Multirace
Place of birth - Foreign born (%) - Other Race
Residents speaking English at home (%)
Residents speaking English at home - Born in the United States (%)
Residents speaking English at home - Native, born elsewhere (%)
Residents speaking English at home - Foreign born (%)
Residents speaking Spanish at home (%)
Residents speaking Spanish at home - Born in the United States (%)
Residents speaking Spanish at home - Native, born elsewhere (%)
Residents speaking Spanish at home - Foreign born (%)
Residents speaking other language at home (%)
Residents speaking other language at home - Born in the United States (%)
Residents speaking other language at home - Native, born elsewhere (%)
Residents speaking other language at home - Foreign born (%)
Marital status - Never married (%)
Marital status - Now married (%)
Marital status - Separated (%)
Marital status - Widowed (%)
Marital status - Divorced (%)
Ancestries Reported - Arab (%)
Ancestries Reported - Czech (%)
Ancestries Reported - Danish (%)
Ancestries Reported - Dutch (%)
Ancestries Reported - English (%)
Ancestries Reported - French (%)
Ancestries Reported - French Canadian (%)
Ancestries Reported - German (%)
Ancestries Reported - Greek (%)
Ancestries Reported - Hungarian (%)
Ancestries Reported - Irish (%)
Ancestries Reported - Italian (%)
Ancestries Reported - Lithuanian (%)
Ancestries Reported - Norwegian (%)
Ancestries Reported - Polish (%)
Ancestries Reported - Portuguese (%)
Ancestries Reported - Russian (%)
Ancestries Reported - Scotch-Irish (%)
Ancestries Reported - Scottish (%)
Ancestries Reported - Slovak (%)
Ancestries Reported - Subsaharan African (%)
Ancestries Reported - Swedish (%)
Ancestries Reported - Swiss (%)
Ancestries Reported - Ukrainian (%)
Ancestries Reported - United States (%)
Ancestries Reported - Welsh (%)
Ancestries Reported - West Indian (%)
Ancestries Reported - Other (%)
Geographical mobility - Same house 1 year ago (%)
Geographical mobility - Same house 1 year ago (%) - White
Geographical mobility - Same house 1 year ago (%) - Black or African American
Geographical mobility - Same house 1 year ago (%) - Asian
Geographical mobility - Same house 1 year ago (%) - Hispanic or Latino
Geographical mobility - Same house 1 year ago (%) - American Indian and Alaska Native
Geographical mobility - Same house 1 year ago (%) - Multirace
Geographical mobility - Same house 1 year ago (%) - Other Race
Geographical mobility - Moved within same county (%)
Geographical mobility - Moved within same county (%) - White
Geographical mobility - Moved within same county (%) - Black or African American
Geographical mobility - Moved within same county (%) - Asian
Geographical mobility - Moved within same county (%) - Hispanic or Latino
Geographical mobility - Moved within same county (%) - American Indian and Alaska Native
Geographical mobility - Moved within same county (%) - Multirace
Geographical mobility - Moved within same county (%) - Other Race
Geographical mobility - Moved from different county within same state (%)
Geographical mobility - Moved from different county within same state (%) - White
Geographical mobility - Moved from different county within same state (%) - Black or African American
Geographical mobility - Moved from different county within same state (%) - Asian
Geographical mobility - Moved from different county within same state (%) - Hispanic or Latino
Geographical mobility - Moved from different county within same state (%) - American Indian and Alaska Native
Geographical mobility - Moved from different county within same state (%) - Multirace
Geographical mobility - Moved from different county within same state (%) - Other Race
Geographical mobility - Moved from different state (%)
Geographical mobility - Moved from different state (%) - White
Geographical mobility - Moved from different state (%) - Black or African American
Geographical mobility - Moved from different state (%) - Asian
Geographical mobility - Moved from different state (%) - Hispanic or Latino
Geographical mobility - Moved from different state (%) - American Indian and Alaska Native
Geographical mobility - Moved from different state (%) - Multirace
Geographical mobility - Moved from different state (%) - Other Race
Geographical mobility - Moved from abroad (%)
Geographical mobility - Moved from abroad (%) - White
Geographical mobility - Moved from abroad (%) - Black or African American
Geographical mobility - Moved from abroad (%) - Asian
Geographical mobility - Moved from abroad (%) - Hispanic or Latino
Geographical mobility - Moved from abroad (%) - American Indian and Alaska Native
Geographical mobility - Moved from abroad (%) - Multirace
Geographical mobility - Moved from abroad (%) - Other Race
Place of birth for the foreign-born population - Ireland (%)
Place of birth for the foreign-born population - Denmark (%)
Place of birth for the foreign-born population - Norway (%)
Place of birth for the foreign-born population - Sweden (%)
Place of birth for the foreign-born population - United Kingdom (%)
Place of birth for the foreign-born population - England (%)
Place of birth for the foreign-born population - Scotland (%)
Place of birth for the foreign-born population - Other Northern Europe (%)
Place of birth for the foreign-born population - Austria (%)
Place of birth for the foreign-born population - Belgium (%)
Place of birth for the foreign-born population - France (%)
Place of birth for the foreign-born population - Germany (%)
Place of birth for the foreign-born population - Netherlands (%)
Place of birth for the foreign-born population - Switzerland (%)
Place of birth for the foreign-born population - Other Western Europe (%)
Place of birth for the foreign-born population - Greece (%)
Place of birth for the foreign-born population - Italy (%)
Place of birth for the foreign-born population - Portugal (%)
Place of birth for the foreign-born population - Spain (%)
Place of birth for the foreign-born population - Other Southern Europe (%)
Place of birth for the foreign-born population - Albania (%)
Place of birth for the foreign-born population - Belarus (%)
Place of birth for the foreign-born population - Bosnia and Herzegovina (%)
Place of birth for the foreign-born population - Bulgaria (%)
Place of birth for the foreign-born population - Croatia (%)
Place of birth for the foreign-born population - Czechoslovakia (%)
Place of birth for the foreign-born population - Hungary (%)
Place of birth for the foreign-born population - Latvia (%)
Place of birth for the foreign-born population - Lithuania (%)
Place of birth for the foreign-born population - North Macedonia (Macedonia) (%)
Place of birth for the foreign-born population - Moldova (%)
Place of birth for the foreign-born population - Poland (%)
Place of birth for the foreign-born population - Romania (%)
Place of birth for the foreign-born population - Russia (%)
Place of birth for the foreign-born population - Serbia (%)
Place of birth for the foreign-born population - Ukraine (%)
Place of birth for the foreign-born population - Other Eastern Europe (%)
Place of birth for the foreign-born population - China (%)
Place of birth for the foreign-born population - Hong Kong (%)
Place of birth for the foreign-born population - Taiwan (%)
Place of birth for the foreign-born population - Japan (%)
Place of birth for the foreign-born population - Korea (%)
Place of birth for the foreign-born population - Other Eastern Asia (%)
Place of birth for the foreign-born population - Afghanistan (%)
Place of birth for the foreign-born population - Bangladesh (%)
Place of birth for the foreign-born population - India (%)
Place of birth for the foreign-born population - Iran (%)
Place of birth for the foreign-born population - Kazakhstan (%)
Place of birth for the foreign-born population - Nepal (%)
Place of birth for the foreign-born population - Pakistan (%)
Place of birth for the foreign-born population - Sri Lanka (%)
Place of birth for the foreign-born population - Uzbekistan (%)
Place of birth for the foreign-born population - Other South Central Asia (%)
Place of birth for the foreign-born population - Burma (%)
Place of birth for the foreign-born population - Cambodia (%)
Place of birth for the foreign-born population - Indonesia (%)
Place of birth for the foreign-born population - Laos (%)
Place of birth for the foreign-born population - Malaysia (%)
Place of birth for the foreign-born population - Philippines (%)
Place of birth for the foreign-born population - Singapore (%)
Place of birth for the foreign-born population - Thailand (%)
Place of birth for the foreign-born population - Vietnam (%)
Place of birth for the foreign-born population - Other South Eastern Asia (%)
Place of birth for the foreign-born population - Armenia (%)
Place of birth for the foreign-born population - Iraq (%)
Place of birth for the foreign-born population - Israel (%)
Place of birth for the foreign-born population - Jordan (%)
Place of birth for the foreign-born population - Kuwait (%)
Place of birth for the foreign-born population - Lebanon (%)
Place of birth for the foreign-born population - Saudi Arabia (%)
Place of birth for the foreign-born population - Syria (%)
Place of birth for the foreign-born population - Turkey (%)
Place of birth for the foreign-born population - Yemen (%)
Place of birth for the foreign-born population - Other Western Asia (%)
Place of birth for the foreign-born population - Eritrea (%)
Place of birth for the foreign-born population - Ethiopia (%)
Place of birth for the foreign-born population - Kenya (%)
Place of birth for the foreign-born population - Somalia (%)
Place of birth for the foreign-born population - Uganda (%)
Place of birth for the foreign-born population - Zimbabwe (%)
Place of birth for the foreign-born population - Other Eastern Africa (%)
Place of birth for the foreign-born population - Cameroon (%)
Place of birth for the foreign-born population - Congo (%)
Place of birth for the foreign-born population - Democratic Republic of Congo (Zaire) (%)
Place of birth for the foreign-born population - Other Middle Africa (%)
Place of birth for the foreign-born population - Egypt (%)
Place of birth for the foreign-born population - Morocco (%)
Place of birth for the foreign-born population - Sudan (%)
Place of birth for the foreign-born population - Other Northern Africa (%)
Place of birth for the foreign-born population - South Africa (%)
Place of birth for the foreign-born population - Other Southern Africa (%)
Place of birth for the foreign-born population - Cabo Verde (%)
Place of birth for the foreign-born population - Ghana (%)
Place of birth for the foreign-born population - Liberia (%)
Place of birth for the foreign-born population - Nigeria (%)
Place of birth for the foreign-born population - Senegal (%)
Place of birth for the foreign-born population - Sierra Leone (%)
Place of birth for the foreign-born population - Other Western Africa (%)
Place of birth for the foreign-born population - Australia (%)
Place of birth for the foreign-born population - New Zealand (%)
Place of birth for the foreign-born population - Fiji (%)
Place of birth for the foreign-born population - Micronesia (%)
Place of birth for the foreign-born population - Bahamas (%)
Place of birth for the foreign-born population - Barbados (%)
Place of birth for the foreign-born population - Cuba (%)
Place of birth for the foreign-born population - Dominica (%)
Place of birth for the foreign-born population - Dominican Republic (%)
Place of birth for the foreign-born population - Grenada (%)
Place of birth for the foreign-born population - Haiti (%)
Place of birth for the foreign-born population - Jamaica (%)
Place of birth for the foreign-born population - St. Vincent and the Grenadines (%)
Place of birth for the foreign-born population - Trinidad and Tobago (%)
Place of birth for the foreign-born population - West Indies (%)
Place of birth for the foreign-born population - Other Caribbean (%)
Place of birth for the foreign-born population - Belize (%)
Place of birth for the foreign-born population - Costa Rica (%)
Place of birth for the foreign-born population - El Salvador (%)
Place of birth for the foreign-born population - Guatemala (%)
Place of birth for the foreign-born population - Honduras (%)
Place of birth for the foreign-born population - Mexico (%)
Place of birth for the foreign-born population - Nicaragua (%)
Place of birth for the foreign-born population - Panama (%)
Place of birth for the foreign-born population - Other Central America (%)
Place of birth for the foreign-born population - Argentina (%)
Place of birth for the foreign-born population - Bolivia (%)
Place of birth for the foreign-born population - Brazil (%)
Place of birth for the foreign-born population - Chile (%)
Place of birth for the foreign-born population - Colombia (%)
Place of birth for the foreign-born population - Ecuador (%)
Place of birth for the foreign-born population - Guyana (%)
Place of birth for the foreign-born population - Peru (%)
Place of birth for the foreign-born population - Uruguay (%)
Place of birth for the foreign-born population - Venezuela (%)
Place of birth for the foreign-born population - Other South America (%)
Place of birth for the foreign-born population - Canada (%)
Place of birth for the foreign-born population - Other Northern America (%)
Place of birth for the foreign-born population - Other (%)
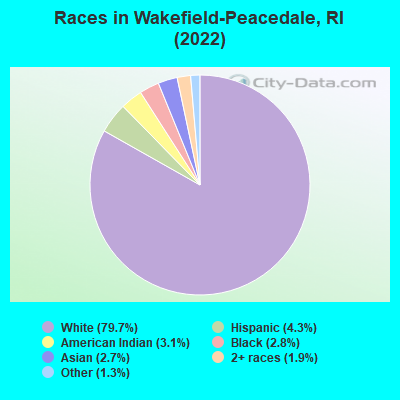
According to 2022 data, the most numerous races in Wakefield-Peacedale, RI are White alone (7,926 residents), Hispanic (424 residents), and Two or more races (184 residents). 94.4% of Wakefield-Peacedale residents speak English at home. 4.0% of Wakefield-Peacedale, RI residents are foreign-born (2.1% born in Asia, 1.1% born in Europe), which is 251.8% less than the foreign-born rate of 14.0% across the entire state of Rhode Island.
Race distribution in Wakefield-Peacedale
2000 2022
858,433 81.9% White alone 90,820 8.7% Hispanic 41,922 4.0% Black alone 23,416 2.2% Asian alone 20,816 2.0% Two or more races 8,411 0.8% Other race alone 4,181 0.4% American Indian alone 320 0.03% Native Hawaiian and Other
745,825 68.2% White alone 191,979 17.6% Hispanic 56,738 5.2% Two or more races 51,326 4.7% Black alone 37,234 3.4% Asian alone 9,514 0.9% Other race alone 978 0.09% American Indian alone 140 0.01% Native Hawaiian and Other
Income and house value in Wakefield-Peacedale Median household income in 2022 $98,696 White non-Hispanic householders$102,424 Black householders$37,846 American Indian and Alaska Native householdersover $200,000 Asian householders$100,450 Some other race householders$14,479 Two or more races householders$133,824 Hispanic or Latino race householdersMedian 2022 house value $476,958 White Non-Hispanic householders$431,743 Black or African American householders$389,039 American Indian or Alaska Native householders $527,825 Asian householders$510,241 Some other race householders$346,336 Two or more races householders$510,241 Hispanic or Latino householders
Median age by race in Wakefield-Peacedale
42.6 Median age for White residents37.4 47.7 36.6 Median age for Black or African American residents38.5 27.2 30.4 Median age for American Indian / Alaska Native residents8.4 37.5 87.6 Median age for Asian residents50.0 95.5 25.9 Median age for Other race residents27.8 25.1 24.3 Median age for Two or more races residents37.8 23.6 41.8 Median age for White alone residents36.7 46.8 33.7 Median age for Hispanic or Latino residents26.5 45.1
Owner/renter occupied households by race in Wakefield-Peacedale
House owners and renters - White residents 2,534 80.3% Owner occupied620 19.7% Renter occupiedHouse owners and renters - Black or African American residents 130 100.0% Renter occupiedHouse owners and renters - American Indian / Alaska Native residents 45 61.9% Owner occupied28 38.1% Renter occupiedHouse owners and renters - Asian residents 201 72.7% Owner occupied75 27.3% Renter occupiedHouse owners and renters - Other race residents 36 100.0% Renter occupiedHouse owners and renters - Two or more races residents 56 100.0% Owner occupiedHouse owners and renters - White alone residents 2,487 79.3% Owner occupied649 20.7% Renter occupiedHouse owners and renters - Hispanic or Latino residents 51 59.4% Owner occupied35 40.6% Renter occupied
Language usage in Wakefield-Peacedale
English speakers - Total 94.4% of residents of Wakefield-Peacedale speak English at home.
1.4% of residents speak Spanish at home 76 59.8% Speak English very well51 40.2% Speak English less than very well4.1% of residents speak other language at home 367 95.8% Speak English very well16 4.2% Speak English less than very well
English speakers - Born in the United States 99.0% of residents of Wakefield-Peacedale speak English at home.
1.7% of residents speak Spanish at home 43 67.2% Speak English very well21 32.8% Speak English less than very well0.3% of residents speak other language at home 2 16.7% Speak English very well10 83.3% Speak English less than very well
All residents speak only English at home
English speakers - Foreign-born 27.3% of residents of Wakefield-Peacedale speak English at home.
71.5% of residents speak other language at home 289 99.3% Speak English very well2 0.7% Speak English less than very well
White (Caucasian) - Speak only English Native:
100.0% (7,439)Foreign-born:
70.5% (54)
White (Caucasian) - Speak another language Native:
1.9% (143)Foreign-born:
33.4% (26)
Black or African American - Speak only English Native:
99.8% (286)Foreign-born:
100.0% (9)
Asian - Speak only English Native:
100.0% (21)Foreign-born:
8.3% (20)
Other race - Speak another language Native:
16.4% (27)Foreign-born:
99.5% (44)
White alone - Speak only English Native:
98.2% (7,326)Foreign-born:
52.2% (58)
White alone - Speak another language Native:
2.1% (156)Foreign-born:
38.1% (42)
Foreign-born residents in Wakefield-Peacedale 390 residents are foreign born (2.1% Asia , 1.1% Europe ).
This city:
4.0%Rhode Island:
100.0%
Marital status for residents in Wakefield-Peacedale Marital status - White (Caucasian) population 15 years and over
Males 38.6% Never married45.5% Now married1.0% Separated2.1% Widowed12.9% DivorcedFemales 27.3% Never married45.4% Now married0.5% Separated12.7% Widowed14.1% DivorcedWomen who gave birth in the past 12 months Now married:
0.0% (0)Unmarried:
90.2% (1)
Women who did not give birth in the past 12 months Now married:
40.1% (639)Unmarried:
59.9% (953)
Marital status - Black or African American population 15 years and over
Males 50.7% Never married0.0% Now married0.0% Separated0.0% Widowed49.3% DivorcedFemales 100.0% Never married0.0% Now married0.0% Separated0.0% Widowed0.0% DivorcedWomen who did not give birth in the past 12 months Now married:
0.0% (0)Unmarried:
100.0% (48)
Marital status - American Indian / Alaska Native population 15 years and over
Males 7.7% Never married92.3% Now married0.0% Separated0.0% Widowed0.0% DivorcedFemales 71.2% Never married21.0% Now married0.0% Separated7.8% Widowed0.0% DivorcedWomen who did not give birth in the past 12 months Now married:
22.8% (45)Unmarried:
77.2% (152)
Marital status - Asian population 15 years and over
Males 35.3% Never married64.7% Now married0.0% Separated0.0% Widowed0.0% DivorcedFemales 15.1% Never married84.9% Now married0.0% Separated0.0% Widowed0.0% DivorcedWomen who did not give birth in the past 12 months Now married:
15.8% (3)Unmarried:
84.2% (15)
Marital status - Other race population 15 years and over
Males 23.1% Never married76.9% Now married0.0% Separated0.0% Widowed0.0% DivorcedFemales 64.1% Never married9.4% Now married0.0% Separated0.0% Widowed26.5% DivorcedWomen who did not give birth in the past 12 months Now married:
0.0% (0)Unmarried:
100.0% (108)
Marital status - Two or more races population 15 years and over
Males 80.6% Never married0.0% Now married19.4% Separated0.0% Widowed0.0% DivorcedFemales 90.5% Never married5.1% Now married0.0% Separated4.4% Widowed0.0% DivorcedWomen who did not give birth in the past 12 months Now married:
0.0% (0)Unmarried:
100.0% (350)
Marital status - White alone, not Hispanic / Latino population 15 years and over
Males 38.7% Never married46.5% Now married1.0% Separated2.2% Widowed11.6% DivorcedFemales 27.8% Never married45.5% Now married0.5% Separated12.9% Widowed13.3% DivorcedWomen who did not give birth in the past 12 months Now married:
40.2% (661)Unmarried:
59.8% (983)
Marital status - Hispanic or Latino population 15 years and over
Males 45.5% Never married15.2% Now married0.0% Separated0.0% Widowed39.4% DivorcedFemales 56.3% Never married21.2% Now married0.0% Separated0.0% Widowed22.5% DivorcedWomen who gave birth in the past 12 months Now married:
0.0% (0)Unmarried:
100.0% (1)
Women who did not give birth in the past 12 months Now married:
15.1% (24)Unmarried:
84.9% (134)
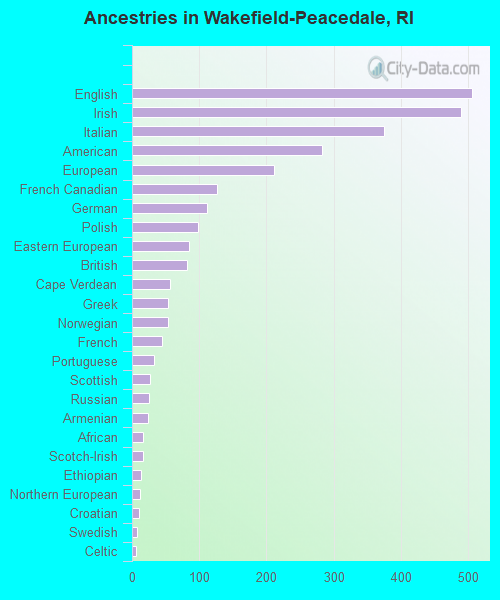
Ancestries in Wakefield-Peacedale
506 12.7% English490 12.3% Irish375 9.4% Italian283 7.1% American212 5.3% European127 3.2% French Canadian111 2.8% German98 2.5% Polish85 2.1% Eastern European82 2.1% British57 1.4% Cape Verdean54 1.4% Greek54 1.4% Norwegian44 1.1% French32 0.8% Portuguese27 0.7% Scottish26 0.7% Russian24 0.6% Armenian17 0.4% African16 0.4% Scotch-Irish13 0.3% Ethiopian12 0.3% Northern European11 0.3% Croatian7 0.2% Swedish6 0.2% Celtic
Children Nativity (place of birth) in Wakefield-Peacedale
Children under 6 years - Living with two parents Both parents native 329 100.0% NativeChildren under 6 years - Living with one parent Native parent 284 100.0% Native
Children 6 to 17 years - Living with two parents Both parents native 715 97.9% Native16 2.1% Foreign-bornChildren 6 to 17 years - Living with one parent Native parent 401 100.0% Native
Grandparents responsible for own grandchildren in Wakefield-Peacedale
Grandparents (30 to 59 years) White / Caucasian 4 4.3% Responsible for grandchildren99 95.7% Not responsible for grandchildrenBlack or African American 51 100.0% Responsible for grandchildrenAmerican Indian / Alaska Native 34 100.0% Responsible for grandchildrenTwo or more races 49 100.0% Responsible for grandchildrenWhite alone, not Hispanic / Latino 4 9.1% Responsible for grandchildren42 90.9% Not responsible for grandchildrenHispanic or Latino 43 62.9% Responsible for grandchildren25 37.1% Not responsible for grandchildrenGrandparents (60 years and over) White / Caucasian 34 30.0% Responsible for grandchildren79 70.0% Not responsible for grandchildrenAmerican Indian / Alaska Native 31 100.0% Responsible for grandchildrenWhite alone, not Hispanic / Latino 35 29.7% Responsible for grandchildren84 70.3% Not responsible for grandchildren