Races in Waco, Texas (TX) Detailed Stats
Data:
Races - White alone (%)
Races - White alone (% change since 2000)
Races - Black alone (%)
Races - Black alone (% change since 2000)
Races - American Indian alone (%)
Races - American Indian alone (% change since 2000)
Races - Asian alone (%)
Races - Asian alone (% change since 2000)
Races - Hispanic (%)
Races - Hispanic (% change since 2000)
Races - Native Hawaiian and Other Pacific Islander alone (%)
Races - Native Hawaiian and Other Pacific Islander alone (% change since 2000)
Races - Two or more races(%)
Races - Two or more races(% change since 2000)
Races - Other race alone (%)
Races - Other race alone (% change since 2000)
Racial diversity
Place of birth - Born in state of residence (%)
Place of birth - Born in state of residence (%) - White
Place of birth - Born in state of residence (%) - Black or African American
Place of birth - Born in state of residence (%) - Asian
Place of birth - Born in state of residence (%) - Hispanic or Latino
Place of birth - Born in state of residence (%) - American Indian and Alaska Native
Place of birth - Born in state of residence (%) - Multirace
Place of birth - Born in state of residence (%) - Other Race
Place of birth - Born in other state (%)
Place of birth - Born in other state (%) - White
Place of birth - Born in other state (%) - Black or African American
Place of birth - Born in other state (%) - Asian
Place of birth - Born in other state (%) - Hispanic or Latino
Place of birth - Born in other state (%) - American Indian and Alaska Native
Place of birth - Born in other state (%) - Multirace
Place of birth - Born in other state (%) - Other Race
Place of birth - Native, outside of US (%)
Place of birth - Native, outside of US (%) - White
Place of birth - Native, outside of US (%) - Black or African American
Place of birth - Native, outside of US (%) - Asian
Place of birth - Native, outside of US (%) - Hispanic or Latino
Place of birth - Native, outside of US (%) - American Indian and Alaska Native
Place of birth - Native, outside of US (%) - Multirace
Place of birth - Native, outside of US (%) - Other Race
Place of birth - Foreign born (%)
Place of birth - Foreign born (%) - White
Place of birth - Foreign born (%) - Black or African American
Place of birth - Foreign born (%) - Asian
Place of birth - Foreign born (%) - Hispanic or Latino
Place of birth - Foreign born (%) - American Indian and Alaska Native
Place of birth - Foreign born (%) - Multirace
Place of birth - Foreign born (%) - Other Race
Residents speaking English at home (%)
Residents speaking English at home - Born in the United States (%)
Residents speaking English at home - Native, born elsewhere (%)
Residents speaking English at home - Foreign born (%)
Residents speaking Spanish at home (%)
Residents speaking Spanish at home - Born in the United States (%)
Residents speaking Spanish at home - Native, born elsewhere (%)
Residents speaking Spanish at home - Foreign born (%)
Residents speaking other language at home (%)
Residents speaking other language at home - Born in the United States (%)
Residents speaking other language at home - Native, born elsewhere (%)
Residents speaking other language at home - Foreign born (%)
Marital status - Never married (%)
Marital status - Now married (%)
Marital status - Separated (%)
Marital status - Widowed (%)
Marital status - Divorced (%)
Ancestries Reported - Arab (%)
Ancestries Reported - Czech (%)
Ancestries Reported - Danish (%)
Ancestries Reported - Dutch (%)
Ancestries Reported - English (%)
Ancestries Reported - French (%)
Ancestries Reported - French Canadian (%)
Ancestries Reported - German (%)
Ancestries Reported - Greek (%)
Ancestries Reported - Hungarian (%)
Ancestries Reported - Irish (%)
Ancestries Reported - Italian (%)
Ancestries Reported - Lithuanian (%)
Ancestries Reported - Norwegian (%)
Ancestries Reported - Polish (%)
Ancestries Reported - Portuguese (%)
Ancestries Reported - Russian (%)
Ancestries Reported - Scotch-Irish (%)
Ancestries Reported - Scottish (%)
Ancestries Reported - Slovak (%)
Ancestries Reported - Subsaharan African (%)
Ancestries Reported - Swedish (%)
Ancestries Reported - Swiss (%)
Ancestries Reported - Ukrainian (%)
Ancestries Reported - United States (%)
Ancestries Reported - Welsh (%)
Ancestries Reported - West Indian (%)
Ancestries Reported - Other (%)
Geographical mobility - Same house 1 year ago (%)
Geographical mobility - Same house 1 year ago (%) - White
Geographical mobility - Same house 1 year ago (%) - Black or African American
Geographical mobility - Same house 1 year ago (%) - Asian
Geographical mobility - Same house 1 year ago (%) - Hispanic or Latino
Geographical mobility - Same house 1 year ago (%) - American Indian and Alaska Native
Geographical mobility - Same house 1 year ago (%) - Multirace
Geographical mobility - Same house 1 year ago (%) - Other Race
Geographical mobility - Moved within same county (%)
Geographical mobility - Moved within same county (%) - White
Geographical mobility - Moved within same county (%) - Black or African American
Geographical mobility - Moved within same county (%) - Asian
Geographical mobility - Moved within same county (%) - Hispanic or Latino
Geographical mobility - Moved within same county (%) - American Indian and Alaska Native
Geographical mobility - Moved within same county (%) - Multirace
Geographical mobility - Moved within same county (%) - Other Race
Geographical mobility - Moved from different county within same state (%)
Geographical mobility - Moved from different county within same state (%) - White
Geographical mobility - Moved from different county within same state (%) - Black or African American
Geographical mobility - Moved from different county within same state (%) - Asian
Geographical mobility - Moved from different county within same state (%) - Hispanic or Latino
Geographical mobility - Moved from different county within same state (%) - American Indian and Alaska Native
Geographical mobility - Moved from different county within same state (%) - Multirace
Geographical mobility - Moved from different county within same state (%) - Other Race
Geographical mobility - Moved from different state (%)
Geographical mobility - Moved from different state (%) - White
Geographical mobility - Moved from different state (%) - Black or African American
Geographical mobility - Moved from different state (%) - Asian
Geographical mobility - Moved from different state (%) - Hispanic or Latino
Geographical mobility - Moved from different state (%) - American Indian and Alaska Native
Geographical mobility - Moved from different state (%) - Multirace
Geographical mobility - Moved from different state (%) - Other Race
Geographical mobility - Moved from abroad (%)
Geographical mobility - Moved from abroad (%) - White
Geographical mobility - Moved from abroad (%) - Black or African American
Geographical mobility - Moved from abroad (%) - Asian
Geographical mobility - Moved from abroad (%) - Hispanic or Latino
Geographical mobility - Moved from abroad (%) - American Indian and Alaska Native
Geographical mobility - Moved from abroad (%) - Multirace
Geographical mobility - Moved from abroad (%) - Other Race
Place of birth for the foreign-born population - Ireland (%)
Place of birth for the foreign-born population - Denmark (%)
Place of birth for the foreign-born population - Norway (%)
Place of birth for the foreign-born population - Sweden (%)
Place of birth for the foreign-born population - United Kingdom (%)
Place of birth for the foreign-born population - England (%)
Place of birth for the foreign-born population - Scotland (%)
Place of birth for the foreign-born population - Other Northern Europe (%)
Place of birth for the foreign-born population - Austria (%)
Place of birth for the foreign-born population - Belgium (%)
Place of birth for the foreign-born population - France (%)
Place of birth for the foreign-born population - Germany (%)
Place of birth for the foreign-born population - Netherlands (%)
Place of birth for the foreign-born population - Switzerland (%)
Place of birth for the foreign-born population - Other Western Europe (%)
Place of birth for the foreign-born population - Greece (%)
Place of birth for the foreign-born population - Italy (%)
Place of birth for the foreign-born population - Portugal (%)
Place of birth for the foreign-born population - Spain (%)
Place of birth for the foreign-born population - Other Southern Europe (%)
Place of birth for the foreign-born population - Albania (%)
Place of birth for the foreign-born population - Belarus (%)
Place of birth for the foreign-born population - Bosnia and Herzegovina (%)
Place of birth for the foreign-born population - Bulgaria (%)
Place of birth for the foreign-born population - Croatia (%)
Place of birth for the foreign-born population - Czechoslovakia (%)
Place of birth for the foreign-born population - Hungary (%)
Place of birth for the foreign-born population - Latvia (%)
Place of birth for the foreign-born population - Lithuania (%)
Place of birth for the foreign-born population - North Macedonia (Macedonia) (%)
Place of birth for the foreign-born population - Moldova (%)
Place of birth for the foreign-born population - Poland (%)
Place of birth for the foreign-born population - Romania (%)
Place of birth for the foreign-born population - Russia (%)
Place of birth for the foreign-born population - Serbia (%)
Place of birth for the foreign-born population - Ukraine (%)
Place of birth for the foreign-born population - Other Eastern Europe (%)
Place of birth for the foreign-born population - China (%)
Place of birth for the foreign-born population - Hong Kong (%)
Place of birth for the foreign-born population - Taiwan (%)
Place of birth for the foreign-born population - Japan (%)
Place of birth for the foreign-born population - Korea (%)
Place of birth for the foreign-born population - Other Eastern Asia (%)
Place of birth for the foreign-born population - Afghanistan (%)
Place of birth for the foreign-born population - Bangladesh (%)
Place of birth for the foreign-born population - India (%)
Place of birth for the foreign-born population - Iran (%)
Place of birth for the foreign-born population - Kazakhstan (%)
Place of birth for the foreign-born population - Nepal (%)
Place of birth for the foreign-born population - Pakistan (%)
Place of birth for the foreign-born population - Sri Lanka (%)
Place of birth for the foreign-born population - Uzbekistan (%)
Place of birth for the foreign-born population - Other South Central Asia (%)
Place of birth for the foreign-born population - Burma (%)
Place of birth for the foreign-born population - Cambodia (%)
Place of birth for the foreign-born population - Indonesia (%)
Place of birth for the foreign-born population - Laos (%)
Place of birth for the foreign-born population - Malaysia (%)
Place of birth for the foreign-born population - Philippines (%)
Place of birth for the foreign-born population - Singapore (%)
Place of birth for the foreign-born population - Thailand (%)
Place of birth for the foreign-born population - Vietnam (%)
Place of birth for the foreign-born population - Other South Eastern Asia (%)
Place of birth for the foreign-born population - Armenia (%)
Place of birth for the foreign-born population - Iraq (%)
Place of birth for the foreign-born population - Israel (%)
Place of birth for the foreign-born population - Jordan (%)
Place of birth for the foreign-born population - Kuwait (%)
Place of birth for the foreign-born population - Lebanon (%)
Place of birth for the foreign-born population - Saudi Arabia (%)
Place of birth for the foreign-born population - Syria (%)
Place of birth for the foreign-born population - Turkey (%)
Place of birth for the foreign-born population - Yemen (%)
Place of birth for the foreign-born population - Other Western Asia (%)
Place of birth for the foreign-born population - Eritrea (%)
Place of birth for the foreign-born population - Ethiopia (%)
Place of birth for the foreign-born population - Kenya (%)
Place of birth for the foreign-born population - Somalia (%)
Place of birth for the foreign-born population - Uganda (%)
Place of birth for the foreign-born population - Zimbabwe (%)
Place of birth for the foreign-born population - Other Eastern Africa (%)
Place of birth for the foreign-born population - Cameroon (%)
Place of birth for the foreign-born population - Congo (%)
Place of birth for the foreign-born population - Democratic Republic of Congo (Zaire) (%)
Place of birth for the foreign-born population - Other Middle Africa (%)
Place of birth for the foreign-born population - Egypt (%)
Place of birth for the foreign-born population - Morocco (%)
Place of birth for the foreign-born population - Sudan (%)
Place of birth for the foreign-born population - Other Northern Africa (%)
Place of birth for the foreign-born population - South Africa (%)
Place of birth for the foreign-born population - Other Southern Africa (%)
Place of birth for the foreign-born population - Cabo Verde (%)
Place of birth for the foreign-born population - Ghana (%)
Place of birth for the foreign-born population - Liberia (%)
Place of birth for the foreign-born population - Nigeria (%)
Place of birth for the foreign-born population - Senegal (%)
Place of birth for the foreign-born population - Sierra Leone (%)
Place of birth for the foreign-born population - Other Western Africa (%)
Place of birth for the foreign-born population - Australia (%)
Place of birth for the foreign-born population - New Zealand (%)
Place of birth for the foreign-born population - Fiji (%)
Place of birth for the foreign-born population - Micronesia (%)
Place of birth for the foreign-born population - Bahamas (%)
Place of birth for the foreign-born population - Barbados (%)
Place of birth for the foreign-born population - Cuba (%)
Place of birth for the foreign-born population - Dominica (%)
Place of birth for the foreign-born population - Dominican Republic (%)
Place of birth for the foreign-born population - Grenada (%)
Place of birth for the foreign-born population - Haiti (%)
Place of birth for the foreign-born population - Jamaica (%)
Place of birth for the foreign-born population - St. Vincent and the Grenadines (%)
Place of birth for the foreign-born population - Trinidad and Tobago (%)
Place of birth for the foreign-born population - West Indies (%)
Place of birth for the foreign-born population - Other Caribbean (%)
Place of birth for the foreign-born population - Belize (%)
Place of birth for the foreign-born population - Costa Rica (%)
Place of birth for the foreign-born population - El Salvador (%)
Place of birth for the foreign-born population - Guatemala (%)
Place of birth for the foreign-born population - Honduras (%)
Place of birth for the foreign-born population - Mexico (%)
Place of birth for the foreign-born population - Nicaragua (%)
Place of birth for the foreign-born population - Panama (%)
Place of birth for the foreign-born population - Other Central America (%)
Place of birth for the foreign-born population - Argentina (%)
Place of birth for the foreign-born population - Bolivia (%)
Place of birth for the foreign-born population - Brazil (%)
Place of birth for the foreign-born population - Chile (%)
Place of birth for the foreign-born population - Colombia (%)
Place of birth for the foreign-born population - Ecuador (%)
Place of birth for the foreign-born population - Guyana (%)
Place of birth for the foreign-born population - Peru (%)
Place of birth for the foreign-born population - Uruguay (%)
Place of birth for the foreign-born population - Venezuela (%)
Place of birth for the foreign-born population - Other South America (%)
Place of birth for the foreign-born population - Canada (%)
Place of birth for the foreign-born population - Other Northern America (%)
Place of birth for the foreign-born population - Other (%)
Latest news about races in Waco, TX collected exclusively by city-data.com from local newspapers, TV, and radio stations
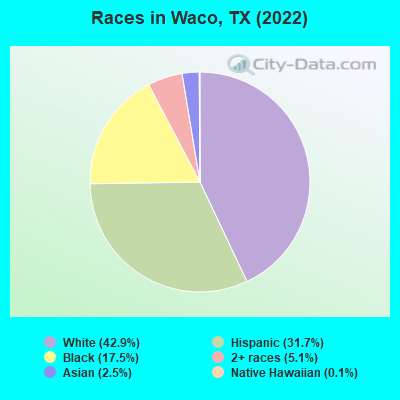
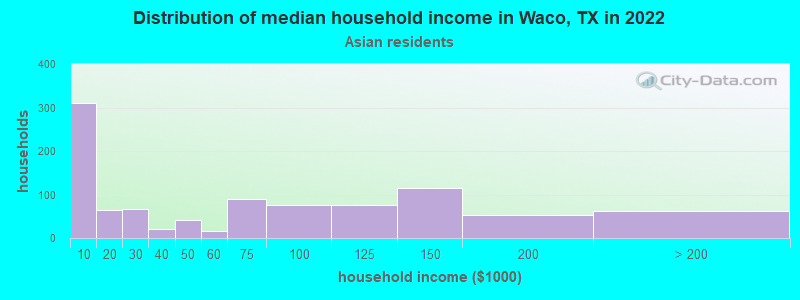
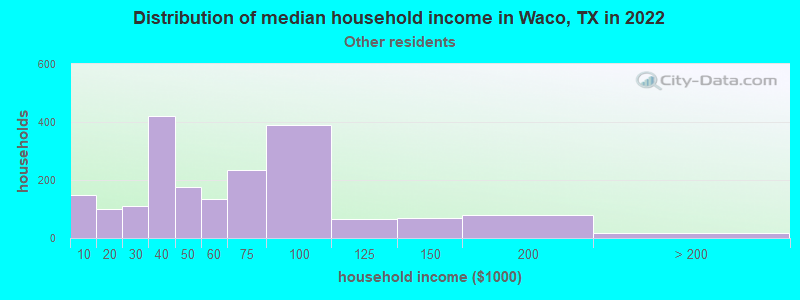
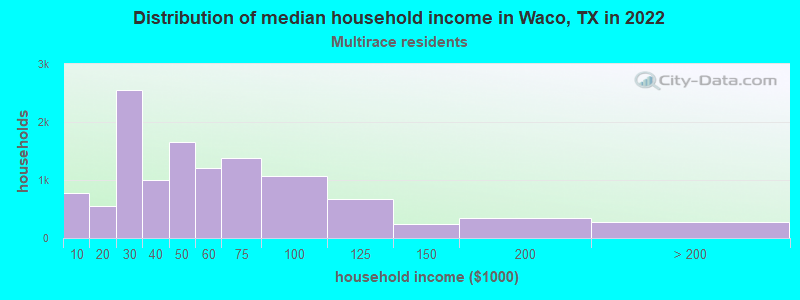
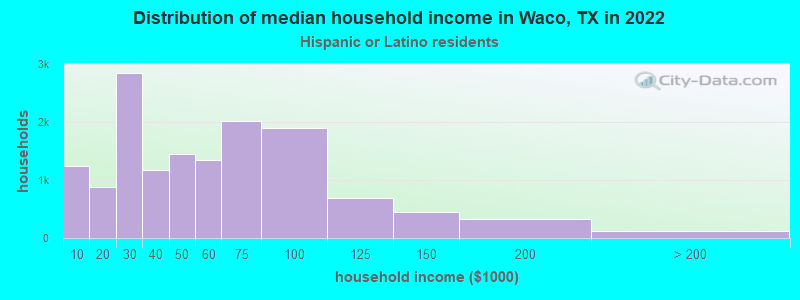
According to 2022 data, the most numerous races in Waco, TX are Hispanic (45,690 residents), White alone (61,764 residents), and Black alone (25,163 residents). 78.0% of Waco residents speak English at home. 10.2% of Waco, TX residents are foreign-born (7.6% born in Latin America, 1.3% born in Asia), which is 66.4% less than the foreign-born rate of 17.0% across the entire state of Texas.
Race distribution in Waco
2000 2022
58,096 51.1% White alone 26,885 23.6% Hispanic 25,477 22.4% Black alone 1,542 1.4% Asian alone 1,294 1.1% Two or more races 307 0.3% American Indian alone 82 0.07% Other race alone 43 0.04% Native Hawaiian and Other
61,764 42.9% White alone 45,690 31.7% Hispanic 25,163 17.5% Black alone 7,400 5.1% Two or more races 3,626 2.5% Asian alone 215 0.1% Native Hawaiian and Other 129 0.09% American Indian alone
2000 2022
10,933,313 52.4% White alone 6,669,666 32.0% Hispanic 2,364,255 11.3% Black alone 554,445 2.7% Asian alone 230,567 1.1% Two or more races 68,859 0.3% American Indian alone 19,958 0.10% Other race alone 10,757 0.05% Native Hawaiian and Other
12,070,642 40.2% Hispanic 11,683,430 38.9% White alone 3,508,706 11.7% Black alone 1,608,173 5.4% Asian alone 956,560 3.2% Two or more races 125,763 0.4% Other race alone 47,023 0.2% American Indian alone 29,275 0.10% Native Hawaiian and Other
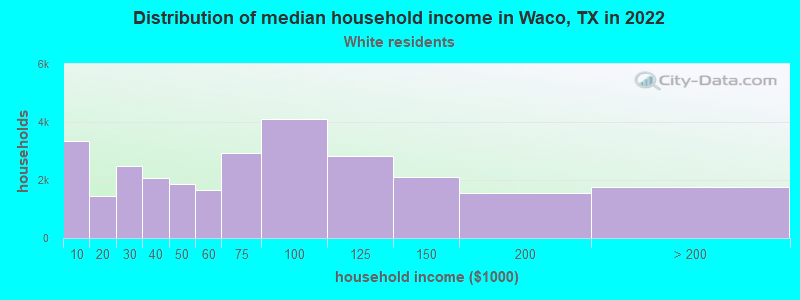
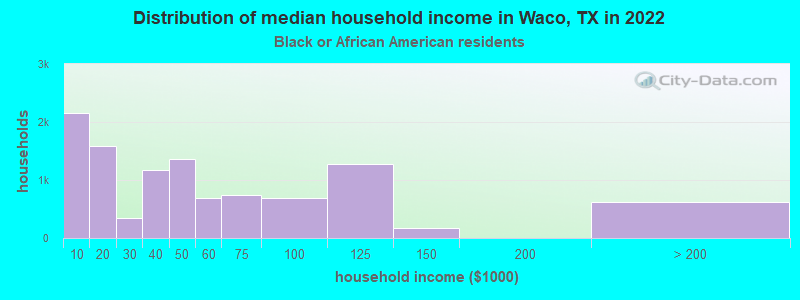
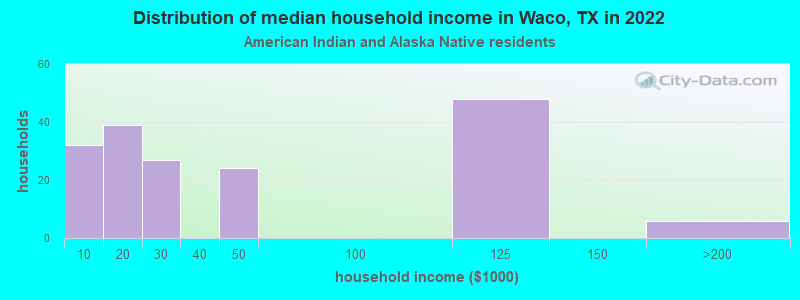
Income and house value in Waco Median household income in 2022 $67,212 White non-Hispanic householders$40,724 Black householders$49,759 Asian householders$61,103 Some other race householders$42,341 Two or more races householders$48,523 Hispanic or Latino race householdersMedian 2022 house value $278,680 White Non-Hispanic householders$135,989 Black or African American householders$184,078 American Indian or Alaska Native householders $134,412 Asian householders$139,931 Some other race householders$168,706 Two or more races householders$139,143 Hispanic or Latino householders
Median age by race in Waco
32.9 Median age for White residents32.4 33.8 29.2 Median age for Black or African American residents27.3 34.3 34.5 Median age for American Indian / Alaska Native residents17.6 55.2 29.8 Median age for Asian residents25.7 34.7 -666,666,666.0 Median age for Native Hawaiian / Pacific Islander residents-666,666,666.0 -666,666,666.0 33.1 Median age for Other race residents32.4 35.1 23.6 Median age for Two or more races residents22.0 27.3 34.8 Median age for White alone residents34.0 35.4 25.2 Median age for Hispanic or Latino residents23.9 28.3
Owner/renter occupied households by race in Waco
House owners and renters - White residents 14,863 52.8% Owner occupied13,289 47.2% Renter occupiedHouse owners and renters - Black or African American residents 2,600 24.0% Owner occupied8,214 76.0% Renter occupiedHouse owners and renters - American Indian / Alaska Native residents 127 71.6% Owner occupied50 28.4% Renter occupiedHouse owners and renters - Asian residents 467 55.3% Owner occupied378 44.7% Renter occupiedHouse owners and renters - Native Hawaiian / Pacific Islander residents 19 100.0% Renter occupiedHouse owners and renters - Other race residents 1,148 63.9% Owner occupied648 36.1% Renter occupiedHouse owners and renters - Two or more races residents 5,974 51.1% Owner occupied5,728 48.9% Renter occupiedHouse owners and renters - White alone residents 14,060 53.2% Owner occupied12,355 46.8% Renter occupiedHouse owners and renters - Hispanic or Latino residents 6,989 48.5% Owner occupied7,429 51.5% Renter occupied
Language usage in Waco
English speakers - Total 78.0% of residents of Waco speak English at home.
18.4% of residents speak Spanish at home 11,224 44.8% Speak English very well13,808 55.2% Speak English less than very well3.6% of residents speak other language at home 2,277 45.9% Speak English very well2,684 54.1% Speak English less than very well
English speakers - Born in the United States 94.2% of residents of Waco speak English at home.
3.4% of residents speak Spanish at home 782 68.9% Speak English very well353 31.1% Speak English less than very well2.4% of residents speak other language at home 343 43.5% Speak English very well445 56.5% Speak English less than very well
English speakers - Native, born elsewhere 61.5% of residents of Waco speak English at home.
30.8% of residents speak Spanish at home 350 100.0% Speak English less than very well7.7% of residents speak other language at home 87 100.0% Speak English very well
English speakers - Foreign-born 9.3% of residents of Waco speak English at home.
71.1% of residents speak Spanish at home 2,051 19.4% Speak English very well8,533 80.6% Speak English less than very well19.6% of residents speak other language at home 909 31.2% Speak English very well2,004 68.8% Speak English less than very well
White (Caucasian) - Speak only English Native:
93.7% (59,627)Foreign-born:
35.7% (781)
White (Caucasian) - Speak another language Native:
6.3% (3,989)Foreign-born:
64.3% (1,409)
Black or African American - Speak only English Native:
99.2% (25,848)Foreign-born:
53.1% (377)
Black or African American - Speak another language Native:
0.8% (220)Foreign-born:
43.5% (309)
American Indian / Alaska Native - Speak only English Native:
63.5% (346)Foreign-born:
82.1% (15)
American Indian / Alaska Native - Speak another language Native:
32.1% (175)Foreign-born:
29.7% (5)
Asian - Speak only English Native:
20.9% (260)Foreign-born:
15.3% (375)
Asian - Speak another language Native:
79.1% (983)Foreign-born:
84.7% (2,082)
Native Hawaiian / Pacific Islander - Speak another language Native:
45.6% (20)Foreign-born:
100.0% (11)
Other race - Speak another language Native:
43.5% (1,429)Foreign-born:
100.0% (2,290)
Two or more races - Speak only English Native:
67.3% (18,991)Foreign-born:
0.8% (58)
Two or more races - Speak another language Native:
32.7% (9,237)Foreign-born:
99.2% (7,058)
White alone - Speak only English Native:
97.7% (58,824)Foreign-born:
74.7% (493)
White alone - Speak another language Native:
2.3% (1,401)Foreign-born:
79.4% (524)
Hispanic or Latino - Speak another language Native:
42.2% (13,544)Foreign-born:
100.0% (10,584)
Foreign-born residents in Waco 14,675 residents are foreign born (7.6% Latin America , 1.3% Asia ).
This city:
10.2%Texas:
17.1%
Marital status for residents in Waco Marital status - White (Caucasian) population 15 years and over
Males 43.3% Never married49.3% Now married0.0% Separated1.8% Widowed5.6% DivorcedFemales 37.2% Never married44.4% Now married1.1% Separated6.9% Widowed10.3% DivorcedWomen who gave birth in the past 12 months Now married:
100.0% (604)Unmarried:
0.0% (0)
Women who did not give birth in the past 12 months Now married:
36.7% (7,236)Unmarried:
63.3% (12,490)
Marital status - Black or African American population 15 years and over
Males 54.0% Never married30.9% Now married2.9% Separated2.3% Widowed9.8% DivorcedFemales 55.7% Never married29.3% Now married0.5% Separated1.7% Widowed12.8% DivorcedWomen who gave birth in the past 12 months Now married:
33.1% (103)Unmarried:
66.9% (208)
Women who did not give birth in the past 12 months Now married:
15.5% (1,220)Unmarried:
84.5% (6,652)
Marital status - American Indian / Alaska Native population 15 years and over
Males 60.4% Never married37.6% Now married0.0% Separated0.0% Widowed2.0% DivorcedFemales 11.0% Never married60.4% Now married0.0% Separated28.6% Widowed0.0% DivorcedWomen who gave birth in the past 12 months Now married:
66.7% (14)Unmarried:
33.3% (7)
Women who did not give birth in the past 12 months Now married:
68.0% (73)Unmarried:
32.0% (34)
Marital status - Asian population 15 years and over
Males 58.2% Never married41.8% Now married0.0% Separated0.0% Widowed0.0% DivorcedFemales 47.5% Never married41.9% Now married0.0% Separated6.0% Widowed4.5% DivorcedWomen who gave birth in the past 12 months Now married:
100.0% (97)Unmarried:
0.0% (0)
Women who did not give birth in the past 12 months Now married:
32.1% (358)Unmarried:
67.9% (757)
Marital status - Native Hawaiian / Pacific Islander population 15 years and over
Males 23.1% Never married76.9% Now married0.0% Separated0.0% Widowed0.0% DivorcedFemales 100.0% Never married0.0% Now married0.0% Separated0.0% Widowed0.0% DivorcedMarital status - Other race population 15 years and over
Males 40.0% Never married51.3% Now married0.4% Separated1.0% Widowed7.3% DivorcedFemales 47.3% Never married44.0% Now married2.7% Separated1.3% Widowed4.7% DivorcedWomen who gave birth in the past 12 months Now married:
100.0% (79)Unmarried:
0.0% (0)
Women who did not give birth in the past 12 months Now married:
35.2% (453)Unmarried:
64.8% (833)
Marital status - Two or more races population 15 years and over
Males 50.7% Never married39.2% Now married1.7% Separated3.3% Widowed5.1% DivorcedFemales 43.7% Never married39.0% Now married5.3% Separated7.5% Widowed4.5% DivorcedWomen who gave birth in the past 12 months Now married:
30.2% (122)Unmarried:
69.8% (282)
Women who did not give birth in the past 12 months Now married:
38.5% (3,857)Unmarried:
61.5% (6,162)
Marital status - White alone, not Hispanic / Latino population 15 years and over
Males 40.8% Never married51.0% Now married0.0% Separated2.0% Widowed6.2% DivorcedFemales 36.6% Never married44.3% Now married1.2% Separated6.9% Widowed10.9% DivorcedWomen who gave birth in the past 12 months Now married:
100.0% (544)Unmarried:
0.0% (0)
Women who did not give birth in the past 12 months Now married:
36.5% (6,521)Unmarried:
63.5% (11,329)
Marital status - Hispanic or Latino population 15 years and over
Males 53.2% Never married39.1% Now married1.3% Separated2.3% Widowed4.1% DivorcedFemales 46.3% Never married38.2% Now married4.2% Separated7.0% Widowed4.3% DivorcedWomen who gave birth in the past 12 months Now married:
47.6% (256)Unmarried:
52.4% (282)
Women who did not give birth in the past 12 months Now married:
33.8% (4,275)Unmarried:
66.2% (8,370)
Ancestries in Waco
6,240 7.2% German5,012 5.8% English3,099 3.6% Irish3,077 3.5% American1,333 1.5% Italian859 1.0% European855 1.0% Scottish699 0.8% Czech595 0.7% African473 0.5% Scotch-Irish440 0.5% French411 0.5% Norwegian358 0.4% Nigerian323 0.4% Polish260 0.3% Liberian226 0.3% Dutch224 0.3% Welsh220 0.3% Swedish196 0.2% British181 0.2% French Canadian148 0.2% British West Indian126 0.1% Greek99 0.1% Finnish70 0.08% Icelander48 0.06% Danish47 0.05% Lebanese46 0.05% Scandinavian40 0.05% Romanian40 0.05% Czechoslovakian31 0.04% Haitian30 0.03% Egyptian30 0.03% Jamaican29 0.03% Portuguese29 0.03% Slovak28 0.03% Northern European23 0.03% Armenian23 0.03% Palestinian21 0.02% Austrian21 0.02% Turkish15 0.02% Hungarian15 0.02% Yugoslavian13 0.01% Lithuanian13 0.01% Ghanaian12 0.01% Celtic12 0.01% Syrian12 0.01% Swiss11 0.01% Canadian10 0.01% Ukrainian9 0.01% Jordanian9 0.01% West Indian8 0.01% Eastern European8 0.01% Carpatho Rusyn7 0.01% Pennsylvania German7 0.01% Cape Verdean
Geographical mobility in Waco Same house 1 year ago 50,324 73.6% White (Caucasian)19,956 74.0% Black or African American572 95.4% American Indian / Alaska Native1,997 67.3% Asian16 29.7% Native Hawaiian / Pacific Islander5,461 89.3% Other race31,344 84.0% Two or more races45,104 73.3% White alone, not Hispanic / Latino37,430 83.0% Hispanic or LatinoMoved within same county 8,602 12.6% White / Caucasian3,871 14.3% Black or African American8 1.4% American Indian / Alaska Native151 5.1% Asian364 6.0% Other race3,978 10.7% Two or more races7,469 12.1% White alone, not Hispanic / Latino5,806 12.9% Hispanic or LatinoMoved within same state 5,693 8.3% White / Caucasian1,734 6.4% Black or African American15 2.6% American Indian / Alaska Native275 9.3% Asian12 21.0% Native Hawaiian / Pacific Islander166 2.7% Other race551 1.5% Two or more races5,437 8.8% White alone, not Hispanic / Latino1,055 2.3% Hispanic or LatinoMoved from different state 3,642 5.3% White / Caucasian842 3.1% Black or African American282 9.5% Asian56 100.0% Native Hawaiian / Pacific Islander110 1.8% Other race1,425 3.8% Two or more races3,380 5.5% White alone, not Hispanic / Latino802 1.8% Hispanic or LatinoMoved from abroad 119 0.2% White576 2.1% Black or African American8 1.3% American Indian / Alaska Native342 11.5% Asian3 0.1% Other race119 0.2% White alone, not Hispanic / Latino
Children Nativity (place of birth) in Waco
Children under 6 years - Living with two parents Both parents native 4,589 100.0% NativeBoth parents foreign-born 544 86.4% Native85 13.6% Foreign-bornOne native, one foreign-born parent 475 100.0% NativeChildren under 6 years - Living with one parent Native parent 4,703 99.9% Native5 0.1% Foreign-bornForeign-born parent 297 100.0% NativeChildren 6 to 17 years - Living with two parents Both parents native 8,835 99.9% Native8 0.1% Foreign-bornBoth parents foreign-born 1,962 88.7% Native249 11.3% Foreign-bornOne native, one foreign-born parent 519 100.0% NativeChildren 6 to 17 years - Living with one parent Native parent 5,663 100.0% NativeForeign-born parent 2,193 60.5% Native1,432 39.5% Foreign-born
Grandparents responsible for own grandchildren in Waco
Grandparents (30 to 59 years) White / Caucasian 193 38.8% Responsible for grandchildren304 61.2% Not responsible for grandchildrenBlack or African American 194 59.8% Responsible for grandchildren130 40.2% Not responsible for grandchildrenAmerican Indian / Alaska Native 5 100.0% Not responsible for grandchildrenAsian 13 100.0% Not responsible for grandchildrenOther race 53 69.7% Responsible for grandchildren23 30.3% Not responsible for grandchildrenTwo or more races 87 24.1% Responsible for grandchildren272 75.9% Not responsible for grandchildrenWhite alone, not Hispanic / Latino 98 46.8% Responsible for grandchildren112 53.2% Not responsible for grandchildrenHispanic or Latino 280 39.9% Responsible for grandchildren421 60.1% Not responsible for grandchildrenGrandparents (60 years and over) White / Caucasian 454 55.9% Responsible for grandchildren358 44.1% Not responsible for grandchildrenBlack or African American 180 89.5% Responsible for grandchildren21 10.5% Not responsible for grandchildrenAsian 38 100.0% Not responsible for grandchildrenOther race 23 73.6% Responsible for grandchildren8 26.4% Not responsible for grandchildrenTwo or more races 83 32.9% Responsible for grandchildren170 67.1% Not responsible for grandchildrenWhite alone, not Hispanic / Latino 432 67.7% Responsible for grandchildren206 32.3% Not responsible for grandchildrenHispanic or Latino 109 27.1% Responsible for grandchildren293 72.9% Not responsible for grandchildren