Races in Vienna, Virginia (VA) Detailed Stats
Data:
Races - White alone (%)
Races - White alone (% change since 2000)
Races - Black alone (%)
Races - Black alone (% change since 2000)
Races - American Indian alone (%)
Races - American Indian alone (% change since 2000)
Races - Asian alone (%)
Races - Asian alone (% change since 2000)
Races - Hispanic (%)
Races - Hispanic (% change since 2000)
Races - Native Hawaiian and Other Pacific Islander alone (%)
Races - Native Hawaiian and Other Pacific Islander alone (% change since 2000)
Races - Two or more races(%)
Races - Two or more races(% change since 2000)
Races - Other race alone (%)
Races - Other race alone (% change since 2000)
Racial diversity
Place of birth - Born in state of residence (%)
Place of birth - Born in state of residence (%) - White
Place of birth - Born in state of residence (%) - Black or African American
Place of birth - Born in state of residence (%) - Asian
Place of birth - Born in state of residence (%) - Hispanic or Latino
Place of birth - Born in state of residence (%) - American Indian and Alaska Native
Place of birth - Born in state of residence (%) - Multirace
Place of birth - Born in state of residence (%) - Other Race
Place of birth - Born in other state (%)
Place of birth - Born in other state (%) - White
Place of birth - Born in other state (%) - Black or African American
Place of birth - Born in other state (%) - Asian
Place of birth - Born in other state (%) - Hispanic or Latino
Place of birth - Born in other state (%) - American Indian and Alaska Native
Place of birth - Born in other state (%) - Multirace
Place of birth - Born in other state (%) - Other Race
Place of birth - Native, outside of US (%)
Place of birth - Native, outside of US (%) - White
Place of birth - Native, outside of US (%) - Black or African American
Place of birth - Native, outside of US (%) - Asian
Place of birth - Native, outside of US (%) - Hispanic or Latino
Place of birth - Native, outside of US (%) - American Indian and Alaska Native
Place of birth - Native, outside of US (%) - Multirace
Place of birth - Native, outside of US (%) - Other Race
Place of birth - Foreign born (%)
Place of birth - Foreign born (%) - White
Place of birth - Foreign born (%) - Black or African American
Place of birth - Foreign born (%) - Asian
Place of birth - Foreign born (%) - Hispanic or Latino
Place of birth - Foreign born (%) - American Indian and Alaska Native
Place of birth - Foreign born (%) - Multirace
Place of birth - Foreign born (%) - Other Race
Residents speaking English at home (%)
Residents speaking English at home - Born in the United States (%)
Residents speaking English at home - Native, born elsewhere (%)
Residents speaking English at home - Foreign born (%)
Residents speaking Spanish at home (%)
Residents speaking Spanish at home - Born in the United States (%)
Residents speaking Spanish at home - Native, born elsewhere (%)
Residents speaking Spanish at home - Foreign born (%)
Residents speaking other language at home (%)
Residents speaking other language at home - Born in the United States (%)
Residents speaking other language at home - Native, born elsewhere (%)
Residents speaking other language at home - Foreign born (%)
Marital status - Never married (%)
Marital status - Now married (%)
Marital status - Separated (%)
Marital status - Widowed (%)
Marital status - Divorced (%)
Ancestries Reported - Arab (%)
Ancestries Reported - Czech (%)
Ancestries Reported - Danish (%)
Ancestries Reported - Dutch (%)
Ancestries Reported - English (%)
Ancestries Reported - French (%)
Ancestries Reported - French Canadian (%)
Ancestries Reported - German (%)
Ancestries Reported - Greek (%)
Ancestries Reported - Hungarian (%)
Ancestries Reported - Irish (%)
Ancestries Reported - Italian (%)
Ancestries Reported - Lithuanian (%)
Ancestries Reported - Norwegian (%)
Ancestries Reported - Polish (%)
Ancestries Reported - Portuguese (%)
Ancestries Reported - Russian (%)
Ancestries Reported - Scotch-Irish (%)
Ancestries Reported - Scottish (%)
Ancestries Reported - Slovak (%)
Ancestries Reported - Subsaharan African (%)
Ancestries Reported - Swedish (%)
Ancestries Reported - Swiss (%)
Ancestries Reported - Ukrainian (%)
Ancestries Reported - United States (%)
Ancestries Reported - Welsh (%)
Ancestries Reported - West Indian (%)
Ancestries Reported - Other (%)
Geographical mobility - Same house 1 year ago (%)
Geographical mobility - Same house 1 year ago (%) - White
Geographical mobility - Same house 1 year ago (%) - Black or African American
Geographical mobility - Same house 1 year ago (%) - Asian
Geographical mobility - Same house 1 year ago (%) - Hispanic or Latino
Geographical mobility - Same house 1 year ago (%) - American Indian and Alaska Native
Geographical mobility - Same house 1 year ago (%) - Multirace
Geographical mobility - Same house 1 year ago (%) - Other Race
Geographical mobility - Moved within same county (%)
Geographical mobility - Moved within same county (%) - White
Geographical mobility - Moved within same county (%) - Black or African American
Geographical mobility - Moved within same county (%) - Asian
Geographical mobility - Moved within same county (%) - Hispanic or Latino
Geographical mobility - Moved within same county (%) - American Indian and Alaska Native
Geographical mobility - Moved within same county (%) - Multirace
Geographical mobility - Moved within same county (%) - Other Race
Geographical mobility - Moved from different county within same state (%)
Geographical mobility - Moved from different county within same state (%) - White
Geographical mobility - Moved from different county within same state (%) - Black or African American
Geographical mobility - Moved from different county within same state (%) - Asian
Geographical mobility - Moved from different county within same state (%) - Hispanic or Latino
Geographical mobility - Moved from different county within same state (%) - American Indian and Alaska Native
Geographical mobility - Moved from different county within same state (%) - Multirace
Geographical mobility - Moved from different county within same state (%) - Other Race
Geographical mobility - Moved from different state (%)
Geographical mobility - Moved from different state (%) - White
Geographical mobility - Moved from different state (%) - Black or African American
Geographical mobility - Moved from different state (%) - Asian
Geographical mobility - Moved from different state (%) - Hispanic or Latino
Geographical mobility - Moved from different state (%) - American Indian and Alaska Native
Geographical mobility - Moved from different state (%) - Multirace
Geographical mobility - Moved from different state (%) - Other Race
Geographical mobility - Moved from abroad (%)
Geographical mobility - Moved from abroad (%) - White
Geographical mobility - Moved from abroad (%) - Black or African American
Geographical mobility - Moved from abroad (%) - Asian
Geographical mobility - Moved from abroad (%) - Hispanic or Latino
Geographical mobility - Moved from abroad (%) - American Indian and Alaska Native
Geographical mobility - Moved from abroad (%) - Multirace
Geographical mobility - Moved from abroad (%) - Other Race
Place of birth for the foreign-born population - Ireland (%)
Place of birth for the foreign-born population - Denmark (%)
Place of birth for the foreign-born population - Norway (%)
Place of birth for the foreign-born population - Sweden (%)
Place of birth for the foreign-born population - United Kingdom (%)
Place of birth for the foreign-born population - England (%)
Place of birth for the foreign-born population - Scotland (%)
Place of birth for the foreign-born population - Other Northern Europe (%)
Place of birth for the foreign-born population - Austria (%)
Place of birth for the foreign-born population - Belgium (%)
Place of birth for the foreign-born population - France (%)
Place of birth for the foreign-born population - Germany (%)
Place of birth for the foreign-born population - Netherlands (%)
Place of birth for the foreign-born population - Switzerland (%)
Place of birth for the foreign-born population - Other Western Europe (%)
Place of birth for the foreign-born population - Greece (%)
Place of birth for the foreign-born population - Italy (%)
Place of birth for the foreign-born population - Portugal (%)
Place of birth for the foreign-born population - Spain (%)
Place of birth for the foreign-born population - Other Southern Europe (%)
Place of birth for the foreign-born population - Albania (%)
Place of birth for the foreign-born population - Belarus (%)
Place of birth for the foreign-born population - Bosnia and Herzegovina (%)
Place of birth for the foreign-born population - Bulgaria (%)
Place of birth for the foreign-born population - Croatia (%)
Place of birth for the foreign-born population - Czechoslovakia (%)
Place of birth for the foreign-born population - Hungary (%)
Place of birth for the foreign-born population - Latvia (%)
Place of birth for the foreign-born population - Lithuania (%)
Place of birth for the foreign-born population - North Macedonia (Macedonia) (%)
Place of birth for the foreign-born population - Moldova (%)
Place of birth for the foreign-born population - Poland (%)
Place of birth for the foreign-born population - Romania (%)
Place of birth for the foreign-born population - Russia (%)
Place of birth for the foreign-born population - Serbia (%)
Place of birth for the foreign-born population - Ukraine (%)
Place of birth for the foreign-born population - Other Eastern Europe (%)
Place of birth for the foreign-born population - China (%)
Place of birth for the foreign-born population - Hong Kong (%)
Place of birth for the foreign-born population - Taiwan (%)
Place of birth for the foreign-born population - Japan (%)
Place of birth for the foreign-born population - Korea (%)
Place of birth for the foreign-born population - Other Eastern Asia (%)
Place of birth for the foreign-born population - Afghanistan (%)
Place of birth for the foreign-born population - Bangladesh (%)
Place of birth for the foreign-born population - India (%)
Place of birth for the foreign-born population - Iran (%)
Place of birth for the foreign-born population - Kazakhstan (%)
Place of birth for the foreign-born population - Nepal (%)
Place of birth for the foreign-born population - Pakistan (%)
Place of birth for the foreign-born population - Sri Lanka (%)
Place of birth for the foreign-born population - Uzbekistan (%)
Place of birth for the foreign-born population - Other South Central Asia (%)
Place of birth for the foreign-born population - Burma (%)
Place of birth for the foreign-born population - Cambodia (%)
Place of birth for the foreign-born population - Indonesia (%)
Place of birth for the foreign-born population - Laos (%)
Place of birth for the foreign-born population - Malaysia (%)
Place of birth for the foreign-born population - Philippines (%)
Place of birth for the foreign-born population - Singapore (%)
Place of birth for the foreign-born population - Thailand (%)
Place of birth for the foreign-born population - Vietnam (%)
Place of birth for the foreign-born population - Other South Eastern Asia (%)
Place of birth for the foreign-born population - Armenia (%)
Place of birth for the foreign-born population - Iraq (%)
Place of birth for the foreign-born population - Israel (%)
Place of birth for the foreign-born population - Jordan (%)
Place of birth for the foreign-born population - Kuwait (%)
Place of birth for the foreign-born population - Lebanon (%)
Place of birth for the foreign-born population - Saudi Arabia (%)
Place of birth for the foreign-born population - Syria (%)
Place of birth for the foreign-born population - Turkey (%)
Place of birth for the foreign-born population - Yemen (%)
Place of birth for the foreign-born population - Other Western Asia (%)
Place of birth for the foreign-born population - Eritrea (%)
Place of birth for the foreign-born population - Ethiopia (%)
Place of birth for the foreign-born population - Kenya (%)
Place of birth for the foreign-born population - Somalia (%)
Place of birth for the foreign-born population - Uganda (%)
Place of birth for the foreign-born population - Zimbabwe (%)
Place of birth for the foreign-born population - Other Eastern Africa (%)
Place of birth for the foreign-born population - Cameroon (%)
Place of birth for the foreign-born population - Congo (%)
Place of birth for the foreign-born population - Democratic Republic of Congo (Zaire) (%)
Place of birth for the foreign-born population - Other Middle Africa (%)
Place of birth for the foreign-born population - Egypt (%)
Place of birth for the foreign-born population - Morocco (%)
Place of birth for the foreign-born population - Sudan (%)
Place of birth for the foreign-born population - Other Northern Africa (%)
Place of birth for the foreign-born population - South Africa (%)
Place of birth for the foreign-born population - Other Southern Africa (%)
Place of birth for the foreign-born population - Cabo Verde (%)
Place of birth for the foreign-born population - Ghana (%)
Place of birth for the foreign-born population - Liberia (%)
Place of birth for the foreign-born population - Nigeria (%)
Place of birth for the foreign-born population - Senegal (%)
Place of birth for the foreign-born population - Sierra Leone (%)
Place of birth for the foreign-born population - Other Western Africa (%)
Place of birth for the foreign-born population - Australia (%)
Place of birth for the foreign-born population - New Zealand (%)
Place of birth for the foreign-born population - Fiji (%)
Place of birth for the foreign-born population - Micronesia (%)
Place of birth for the foreign-born population - Bahamas (%)
Place of birth for the foreign-born population - Barbados (%)
Place of birth for the foreign-born population - Cuba (%)
Place of birth for the foreign-born population - Dominica (%)
Place of birth for the foreign-born population - Dominican Republic (%)
Place of birth for the foreign-born population - Grenada (%)
Place of birth for the foreign-born population - Haiti (%)
Place of birth for the foreign-born population - Jamaica (%)
Place of birth for the foreign-born population - St. Vincent and the Grenadines (%)
Place of birth for the foreign-born population - Trinidad and Tobago (%)
Place of birth for the foreign-born population - West Indies (%)
Place of birth for the foreign-born population - Other Caribbean (%)
Place of birth for the foreign-born population - Belize (%)
Place of birth for the foreign-born population - Costa Rica (%)
Place of birth for the foreign-born population - El Salvador (%)
Place of birth for the foreign-born population - Guatemala (%)
Place of birth for the foreign-born population - Honduras (%)
Place of birth for the foreign-born population - Mexico (%)
Place of birth for the foreign-born population - Nicaragua (%)
Place of birth for the foreign-born population - Panama (%)
Place of birth for the foreign-born population - Other Central America (%)
Place of birth for the foreign-born population - Argentina (%)
Place of birth for the foreign-born population - Bolivia (%)
Place of birth for the foreign-born population - Brazil (%)
Place of birth for the foreign-born population - Chile (%)
Place of birth for the foreign-born population - Colombia (%)
Place of birth for the foreign-born population - Ecuador (%)
Place of birth for the foreign-born population - Guyana (%)
Place of birth for the foreign-born population - Peru (%)
Place of birth for the foreign-born population - Uruguay (%)
Place of birth for the foreign-born population - Venezuela (%)
Place of birth for the foreign-born population - Other South America (%)
Place of birth for the foreign-born population - Canada (%)
Place of birth for the foreign-born population - Other Northern America (%)
Place of birth for the foreign-born population - Other (%)
Latest news about races in Vienna, VA collected exclusively by city-data.com from local newspapers, TV, and radio stations
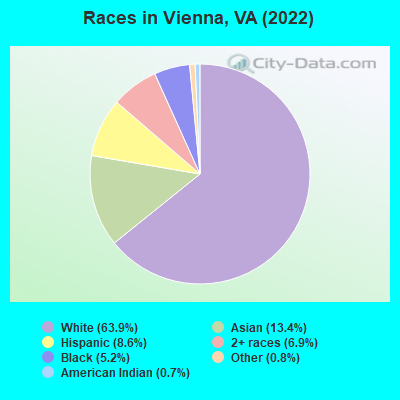
According to 2022 data, the most numerous races in Vienna, VA are White alone (10,423 residents), Black alone (850 residents), and Hispanic (1,396 residents). 76.3% of Vienna residents speak English at home. 22.4% of Vienna, VA residents are foreign-born (12.6% born in Asia, 4.0% born in Europe, 2.8% born in Africa, 2.2% born in Latin America), which is 46.5% greater than the foreign-born rate of 12.0% across the entire state of Virginia.
Race distribution in Vienna
2000 2022
4,965,637 70.2% White alone 1,376,378 19.4% Black alone 329,540 4.7% Hispanic 259,277 3.7% Asian alone 114,022 1.6% Two or more races 18,596 0.3% American Indian alone 11,685 0.2% Other race alone 3,380 0.05% Native Hawaiian and Other
5,095,130 58.7% White alone 1,594,785 18.4% Black alone 905,750 10.4% Hispanic 602,881 6.9% Asian alone 406,047 4.7% Two or more races 60,419 0.7% Other race alone 11,738 0.1% American Indian alone 6,869 0.08% Native Hawaiian and Other
Income and house value in Vienna Median household income in 2022 over $200,000 White non-Hispanic householders$64,853 Black householdersover $200,000 American Indian and Alaska Native householdersover $200,000 Asian householders$101,243 Some other race householdersover $200,000 Two or more races householdersover $200,000 Hispanic or Latino race householdersMedian 2022 house value $958,528 White Non-Hispanic householders$908,493 Black or African American householders $966,798 Asian householders$944,055 Some other race householders$966,385 Two or more races householders$959,769 Hispanic or Latino householders
Median age by race in Vienna
45.3 Median age for White residents45.5 44.8 37.4 Median age for Black or African American residents13.0 43.2 37.9 Median age for American Indian / Alaska Native residents80.0 18.6 43.3 Median age for Asian residents44.6 42.0 -666,666,666.0 Median age for Native Hawaiian / Pacific Islander residents-558,791,801.0 -584,518,166.9 41.5 Median age for Other race residents41.7 43.1 17.4 Median age for Two or more races residents22.6 13.8 45.2 Median age for White alone residents46.0 44.4 37.4 Median age for Hispanic or Latino residents39.8 36.8
Owner/renter occupied households by race in Vienna
House owners and renters - White residents 3,321 87.3% Owner occupied481 12.7% Renter occupiedHouse owners and renters - Black or African American residents 142 47.2% Owner occupied159 52.8% Renter occupiedHouse owners and renters - American Indian / Alaska Native residents 58 100.0% Owner occupiedHouse owners and renters - Asian residents 689 92.0% Owner occupied60 8.0% Renter occupiedHouse owners and renters - Other race residents 48 56.0% Owner occupied38 44.0% Renter occupiedHouse owners and renters - Two or more races residents 308 79.1% Owner occupied81 20.9% Renter occupiedHouse owners and renters - White alone residents 3,330 88.2% Owner occupied445 11.8% Renter occupiedHouse owners and renters - Hispanic or Latino residents 257 69.4% Owner occupied113 30.6% Renter occupied
Language usage in Vienna
English speakers - Total 76.3% of residents of Vienna speak English at home.
3.8% of residents speak Spanish at home 391 66.8% Speak English very well194 33.2% Speak English less than very well20.5% of residents speak other language at home 2,206 70.5% Speak English very well924 29.5% Speak English less than very well
English speakers - Born in the United States 93.3% of residents of Vienna speak English at home.
2.3% of residents speak Spanish at home 159 95.8% Speak English very well7 4.2% Speak English less than very well4.1% of residents speak other language at home 279 95.9% Speak English very well12 4.1% Speak English less than very well
English speakers - Native, born elsewhere 83.0% of residents of Vienna speak English at home.
6.7% of residents speak Spanish at home 28 100.0% Speak English very well8.4% of residents speak other language at home 35 100.0% Speak English very well
English speakers - Foreign-born 22.4% of residents of Vienna speak English at home.
9.7% of residents speak Spanish at home 157 45.8% Speak English very well186 54.2% Speak English less than very well68.8% of residents speak other language at home 1,543 63.2% Speak English very well900 36.8% Speak English less than very well
White (Caucasian) - Speak only English Native:
96.3% (8,631)Foreign-born:
35.2% (357)
White (Caucasian) - Speak another language Native:
4.5% (402)Foreign-born:
68.3% (692)
Black or African American - Speak only English Native:
94.9% (421)Foreign-born:
12.7% (49)
Black or African American - Speak another language Native:
3.7% (16)Foreign-born:
84.6% (329)
Asian - Speak only English Native:
68.1% (422)Foreign-born:
19.7% (277)
Asian - Speak another language Native:
30.2% (187)Foreign-born:
81.2% (1,143)
Other race - Speak another language Native:
37.2% (90)Foreign-born:
98.2% (111)
Two or more races - Speak only English Native:
89.2% (1,114)Foreign-born:
23.4% (65)
Two or more races - Speak another language Native:
9.7% (121)Foreign-born:
76.4% (212)
White alone - Speak only English Native:
95.4% (8,483)Foreign-born:
30.8% (352)
White alone - Speak another language Native:
4.7% (418)Foreign-born:
69.6% (795)
Hispanic or Latino - Speak only English Native:
75.4% (527)Foreign-born:
16.6% (69)
Hispanic or Latino - Speak another language Native:
29.7% (208)Foreign-born:
83.6% (349)
Foreign-born residents in Vienna 3,655 residents are foreign born (12.6% Asia , 4.0% Europe , 2.8% Africa , 2.2% Latin America ).
This city:
22.4%Virginia:
12.6%
Marital status for residents in Vienna Marital status - White (Caucasian) population 15 years and over
Males 24.7% Never married65.8% Now married0.5% Separated2.0% Widowed6.9% DivorcedFemales 20.4% Never married62.8% Now married1.9% Separated6.9% Widowed7.9% DivorcedWomen who gave birth in the past 12 months Now married:
100.0% (61)Unmarried:
0.0% (0)
Women who did not give birth in the past 12 months Now married:
55.6% (1,053)Unmarried:
44.4% (840)
Marital status - Black or African American population 15 years and over
Males 12.1% Never married66.8% Now married0.0% Separated0.0% Widowed21.1% DivorcedFemales 41.3% Never married39.0% Now married11.0% Separated4.3% Widowed4.3% DivorcedWomen who did not give birth in the past 12 months Now married:
57.3% (124)Unmarried:
42.7% (93)
Marital status - American Indian / Alaska Native population 15 years and over
Males 17.8% Never married82.2% Now married0.0% Separated0.0% Widowed0.0% DivorcedFemales 87.2% Never married12.8% Now married0.0% Separated0.0% Widowed0.0% DivorcedWomen who did not give birth in the past 12 months Now married:
12.8% (5)Unmarried:
87.2% (36)
Marital status - Asian population 15 years and over
Males 12.9% Never married76.9% Now married2.7% Separated0.0% Widowed7.5% DivorcedFemales 17.3% Never married75.5% Now married0.0% Separated1.6% Widowed5.7% DivorcedWomen who gave birth in the past 12 months Now married:
100.0% (26)Unmarried:
0.0% (0)
Women who did not give birth in the past 12 months Now married:
75.9% (412)Unmarried:
24.1% (131)
Marital status - Other race population 15 years and over
Males 15.8% Never married84.2% Now married0.0% Separated0.0% Widowed0.0% DivorcedFemales 27.0% Never married49.4% Now married0.0% Separated23.6% Widowed0.0% DivorcedWomen who gave birth in the past 12 months Now married:
100.0% (7)Unmarried:
0.0% (0)
Women who did not give birth in the past 12 months Now married:
58.6% (42)Unmarried:
41.4% (29)
Marital status - Two or more races population 15 years and over
Males 32.3% Never married52.6% Now married3.4% Separated0.0% Widowed11.7% DivorcedFemales 33.1% Never married49.7% Now married0.0% Separated4.4% Widowed12.7% DivorcedWomen who gave birth in the past 12 months Now married:
100.0% (21)Unmarried:
0.0% (0)
Women who did not give birth in the past 12 months Now married:
38.6% (118)Unmarried:
61.4% (187)
Marital status - White alone, not Hispanic / Latino population 15 years and over
Males 24.1% Never married66.5% Now married0.6% Separated2.1% Widowed6.7% DivorcedFemales 19.3% Never married64.6% Now married1.8% Separated6.8% Widowed7.4% DivorcedWomen who gave birth in the past 12 months Now married:
100.0% (67)Unmarried:
0.0% (0)
Women who did not give birth in the past 12 months Now married:
57.6% (1,095)Unmarried:
42.4% (805)
Marital status - Hispanic or Latino population 15 years and over
Males 22.0% Never married71.5% Now married0.6% Separated0.9% Widowed5.0% DivorcedFemales 26.7% Never married47.7% Now married2.9% Separated10.5% Widowed12.2% DivorcedWomen who did not give birth in the past 12 months Now married:
51.2% (126)Unmarried:
48.8% (120)
Ancestries in Vienna
664 8.5% English495 6.3% European493 6.3% Irish438 5.6% American402 5.1% German253 3.2% Iranian231 3.0% Greek227 2.9% Italian146 1.9% British138 1.8% Sudanese132 1.7% Armenian107 1.4% Somali81 1.0% Scottish74 0.9% African72 0.9% Afghan71 0.9% French65 0.8% Russian63 0.8% Cypriot62 0.8% Scotch-Irish61 0.8% Eastern European55 0.7% French Canadian51 0.7% Austrian50 0.6% Albanian50 0.6% Iraqi41 0.5% Ukrainian38 0.5% Polish34 0.4% Arab33 0.4% Dutch29 0.4% Syrian28 0.4% Czechoslovakian27 0.3% Lithuanian25 0.3% Danish24 0.3% Portuguese23 0.3% Lebanese18 0.2% Hungarian18 0.2% Slovak17 0.2% Egyptian16 0.2% Czech13 0.2% Norwegian13 0.2% Ghanaian12 0.2% Welsh11 0.1% Scandinavian8 0.1% Finnish8 0.1% Ethiopian7 0.09% Swedish2 0.03% Jordanian2 0.03% Haitian1 0.01% Canadian1 0.01% Swiss
Geographical mobility in Vienna Same house 1 year ago 8,880 86.1% White (Caucasian)856 100.0% Black or African American95 96.1% American Indian / Alaska Native1,967 91.9% Asian344 97.5% Other race1,524 76.9% Two or more races9,034 87.0% White alone, not Hispanic / Latino1,127 80.6% Hispanic or LatinoMoved within same county 558 5.4% White / Caucasian67 3.1% Asian6 1.6% Other race368 18.6% Two or more races549 5.3% White alone, not Hispanic / Latino101 7.2% Hispanic or LatinoMoved within same state 155 1.5% White / Caucasian38 1.8% Asian134 1.3% White alone, not Hispanic / Latino31 2.2% Hispanic or LatinoMoved from different state 401 3.9% White / Caucasian14 4.1% Other race74 3.7% Two or more races427 4.1% White alone, not Hispanic / Latino11 0.8% Hispanic or LatinoMoved from abroad 274 2.7% White76 3.5% Asian50 2.5% Two or more races209 2.0% White alone, not Hispanic / Latino129 9.2% Hispanic or Latino
Children Nativity (place of birth) in Vienna
Children under 6 years - Living with two parents Both parents native 520 100.0% NativeBoth parents foreign-born 233 73.2% Native85 26.8% Foreign-bornOne native, one foreign-born parent 213 100.0% NativeChildren under 6 years - Living with one parent Native parent 55 100.0% NativeForeign-born parent 10 71.1% Native4 28.9% Foreign-bornChildren 6 to 17 years - Living with two parents Both parents native 1,745 99.0% Native17 1.0% Foreign-bornBoth parents foreign-born 563 77.5% Native164 22.5% Foreign-bornOne native, one foreign-born parent 431 99.4% Native2 0.6% Foreign-bornChildren 6 to 17 years - Living with one parent Native parent 213 93.7% Native14 6.3% Foreign-bornForeign-born parent 116 68.0% Native55 32.0% Foreign-born
Grandparents responsible for own grandchildren in Vienna
Grandparents (30 to 59 years) White / Caucasian 7 100.0% Not responsible for grandchildrenWhite alone, not Hispanic / Latino 9 100.0% Not responsible for grandchildrenHispanic or Latino 6 100.0% Not responsible for grandchildrenGrandparents (60 years and over) White / Caucasian 18 24.1% Responsible for grandchildren58 75.9% Not responsible for grandchildrenWhite alone, not Hispanic / Latino 20 23.7% Responsible for grandchildren65 76.3% Not responsible for grandchildren