Races in Vidalia, Georgia (GA) Detailed Stats
Data:
Races - White alone (%)
Races - White alone (% change since 2000)
Races - Black alone (%)
Races - Black alone (% change since 2000)
Races - American Indian alone (%)
Races - American Indian alone (% change since 2000)
Races - Asian alone (%)
Races - Asian alone (% change since 2000)
Races - Hispanic (%)
Races - Hispanic (% change since 2000)
Races - Native Hawaiian and Other Pacific Islander alone (%)
Races - Native Hawaiian and Other Pacific Islander alone (% change since 2000)
Races - Two or more races(%)
Races - Two or more races(% change since 2000)
Races - Other race alone (%)
Races - Other race alone (% change since 2000)
Racial diversity
Place of birth - Born in state of residence (%)
Place of birth - Born in state of residence (%) - White
Place of birth - Born in state of residence (%) - Black or African American
Place of birth - Born in state of residence (%) - Asian
Place of birth - Born in state of residence (%) - Hispanic or Latino
Place of birth - Born in state of residence (%) - American Indian and Alaska Native
Place of birth - Born in state of residence (%) - Multirace
Place of birth - Born in state of residence (%) - Other Race
Place of birth - Born in other state (%)
Place of birth - Born in other state (%) - White
Place of birth - Born in other state (%) - Black or African American
Place of birth - Born in other state (%) - Asian
Place of birth - Born in other state (%) - Hispanic or Latino
Place of birth - Born in other state (%) - American Indian and Alaska Native
Place of birth - Born in other state (%) - Multirace
Place of birth - Born in other state (%) - Other Race
Place of birth - Native, outside of US (%)
Place of birth - Native, outside of US (%) - White
Place of birth - Native, outside of US (%) - Black or African American
Place of birth - Native, outside of US (%) - Asian
Place of birth - Native, outside of US (%) - Hispanic or Latino
Place of birth - Native, outside of US (%) - American Indian and Alaska Native
Place of birth - Native, outside of US (%) - Multirace
Place of birth - Native, outside of US (%) - Other Race
Place of birth - Foreign born (%)
Place of birth - Foreign born (%) - White
Place of birth - Foreign born (%) - Black or African American
Place of birth - Foreign born (%) - Asian
Place of birth - Foreign born (%) - Hispanic or Latino
Place of birth - Foreign born (%) - American Indian and Alaska Native
Place of birth - Foreign born (%) - Multirace
Place of birth - Foreign born (%) - Other Race
Residents speaking English at home (%)
Residents speaking English at home - Born in the United States (%)
Residents speaking English at home - Native, born elsewhere (%)
Residents speaking English at home - Foreign born (%)
Residents speaking Spanish at home (%)
Residents speaking Spanish at home - Born in the United States (%)
Residents speaking Spanish at home - Native, born elsewhere (%)
Residents speaking Spanish at home - Foreign born (%)
Residents speaking other language at home (%)
Residents speaking other language at home - Born in the United States (%)
Residents speaking other language at home - Native, born elsewhere (%)
Residents speaking other language at home - Foreign born (%)
Marital status - Never married (%)
Marital status - Now married (%)
Marital status - Separated (%)
Marital status - Widowed (%)
Marital status - Divorced (%)
Ancestries Reported - Arab (%)
Ancestries Reported - Czech (%)
Ancestries Reported - Danish (%)
Ancestries Reported - Dutch (%)
Ancestries Reported - English (%)
Ancestries Reported - French (%)
Ancestries Reported - French Canadian (%)
Ancestries Reported - German (%)
Ancestries Reported - Greek (%)
Ancestries Reported - Hungarian (%)
Ancestries Reported - Irish (%)
Ancestries Reported - Italian (%)
Ancestries Reported - Lithuanian (%)
Ancestries Reported - Norwegian (%)
Ancestries Reported - Polish (%)
Ancestries Reported - Portuguese (%)
Ancestries Reported - Russian (%)
Ancestries Reported - Scotch-Irish (%)
Ancestries Reported - Scottish (%)
Ancestries Reported - Slovak (%)
Ancestries Reported - Subsaharan African (%)
Ancestries Reported - Swedish (%)
Ancestries Reported - Swiss (%)
Ancestries Reported - Ukrainian (%)
Ancestries Reported - United States (%)
Ancestries Reported - Welsh (%)
Ancestries Reported - West Indian (%)
Ancestries Reported - Other (%)
Geographical mobility - Same house 1 year ago (%)
Geographical mobility - Same house 1 year ago (%) - White
Geographical mobility - Same house 1 year ago (%) - Black or African American
Geographical mobility - Same house 1 year ago (%) - Asian
Geographical mobility - Same house 1 year ago (%) - Hispanic or Latino
Geographical mobility - Same house 1 year ago (%) - American Indian and Alaska Native
Geographical mobility - Same house 1 year ago (%) - Multirace
Geographical mobility - Same house 1 year ago (%) - Other Race
Geographical mobility - Moved within same county (%)
Geographical mobility - Moved within same county (%) - White
Geographical mobility - Moved within same county (%) - Black or African American
Geographical mobility - Moved within same county (%) - Asian
Geographical mobility - Moved within same county (%) - Hispanic or Latino
Geographical mobility - Moved within same county (%) - American Indian and Alaska Native
Geographical mobility - Moved within same county (%) - Multirace
Geographical mobility - Moved within same county (%) - Other Race
Geographical mobility - Moved from different county within same state (%)
Geographical mobility - Moved from different county within same state (%) - White
Geographical mobility - Moved from different county within same state (%) - Black or African American
Geographical mobility - Moved from different county within same state (%) - Asian
Geographical mobility - Moved from different county within same state (%) - Hispanic or Latino
Geographical mobility - Moved from different county within same state (%) - American Indian and Alaska Native
Geographical mobility - Moved from different county within same state (%) - Multirace
Geographical mobility - Moved from different county within same state (%) - Other Race
Geographical mobility - Moved from different state (%)
Geographical mobility - Moved from different state (%) - White
Geographical mobility - Moved from different state (%) - Black or African American
Geographical mobility - Moved from different state (%) - Asian
Geographical mobility - Moved from different state (%) - Hispanic or Latino
Geographical mobility - Moved from different state (%) - American Indian and Alaska Native
Geographical mobility - Moved from different state (%) - Multirace
Geographical mobility - Moved from different state (%) - Other Race
Geographical mobility - Moved from abroad (%)
Geographical mobility - Moved from abroad (%) - White
Geographical mobility - Moved from abroad (%) - Black or African American
Geographical mobility - Moved from abroad (%) - Asian
Geographical mobility - Moved from abroad (%) - Hispanic or Latino
Geographical mobility - Moved from abroad (%) - American Indian and Alaska Native
Geographical mobility - Moved from abroad (%) - Multirace
Geographical mobility - Moved from abroad (%) - Other Race
Place of birth for the foreign-born population - Ireland (%)
Place of birth for the foreign-born population - Denmark (%)
Place of birth for the foreign-born population - Norway (%)
Place of birth for the foreign-born population - Sweden (%)
Place of birth for the foreign-born population - United Kingdom (%)
Place of birth for the foreign-born population - England (%)
Place of birth for the foreign-born population - Scotland (%)
Place of birth for the foreign-born population - Other Northern Europe (%)
Place of birth for the foreign-born population - Austria (%)
Place of birth for the foreign-born population - Belgium (%)
Place of birth for the foreign-born population - France (%)
Place of birth for the foreign-born population - Germany (%)
Place of birth for the foreign-born population - Netherlands (%)
Place of birth for the foreign-born population - Switzerland (%)
Place of birth for the foreign-born population - Other Western Europe (%)
Place of birth for the foreign-born population - Greece (%)
Place of birth for the foreign-born population - Italy (%)
Place of birth for the foreign-born population - Portugal (%)
Place of birth for the foreign-born population - Spain (%)
Place of birth for the foreign-born population - Other Southern Europe (%)
Place of birth for the foreign-born population - Albania (%)
Place of birth for the foreign-born population - Belarus (%)
Place of birth for the foreign-born population - Bosnia and Herzegovina (%)
Place of birth for the foreign-born population - Bulgaria (%)
Place of birth for the foreign-born population - Croatia (%)
Place of birth for the foreign-born population - Czechoslovakia (%)
Place of birth for the foreign-born population - Hungary (%)
Place of birth for the foreign-born population - Latvia (%)
Place of birth for the foreign-born population - Lithuania (%)
Place of birth for the foreign-born population - North Macedonia (Macedonia) (%)
Place of birth for the foreign-born population - Moldova (%)
Place of birth for the foreign-born population - Poland (%)
Place of birth for the foreign-born population - Romania (%)
Place of birth for the foreign-born population - Russia (%)
Place of birth for the foreign-born population - Serbia (%)
Place of birth for the foreign-born population - Ukraine (%)
Place of birth for the foreign-born population - Other Eastern Europe (%)
Place of birth for the foreign-born population - China (%)
Place of birth for the foreign-born population - Hong Kong (%)
Place of birth for the foreign-born population - Taiwan (%)
Place of birth for the foreign-born population - Japan (%)
Place of birth for the foreign-born population - Korea (%)
Place of birth for the foreign-born population - Other Eastern Asia (%)
Place of birth for the foreign-born population - Afghanistan (%)
Place of birth for the foreign-born population - Bangladesh (%)
Place of birth for the foreign-born population - India (%)
Place of birth for the foreign-born population - Iran (%)
Place of birth for the foreign-born population - Kazakhstan (%)
Place of birth for the foreign-born population - Nepal (%)
Place of birth for the foreign-born population - Pakistan (%)
Place of birth for the foreign-born population - Sri Lanka (%)
Place of birth for the foreign-born population - Uzbekistan (%)
Place of birth for the foreign-born population - Other South Central Asia (%)
Place of birth for the foreign-born population - Burma (%)
Place of birth for the foreign-born population - Cambodia (%)
Place of birth for the foreign-born population - Indonesia (%)
Place of birth for the foreign-born population - Laos (%)
Place of birth for the foreign-born population - Malaysia (%)
Place of birth for the foreign-born population - Philippines (%)
Place of birth for the foreign-born population - Singapore (%)
Place of birth for the foreign-born population - Thailand (%)
Place of birth for the foreign-born population - Vietnam (%)
Place of birth for the foreign-born population - Other South Eastern Asia (%)
Place of birth for the foreign-born population - Armenia (%)
Place of birth for the foreign-born population - Iraq (%)
Place of birth for the foreign-born population - Israel (%)
Place of birth for the foreign-born population - Jordan (%)
Place of birth for the foreign-born population - Kuwait (%)
Place of birth for the foreign-born population - Lebanon (%)
Place of birth for the foreign-born population - Saudi Arabia (%)
Place of birth for the foreign-born population - Syria (%)
Place of birth for the foreign-born population - Turkey (%)
Place of birth for the foreign-born population - Yemen (%)
Place of birth for the foreign-born population - Other Western Asia (%)
Place of birth for the foreign-born population - Eritrea (%)
Place of birth for the foreign-born population - Ethiopia (%)
Place of birth for the foreign-born population - Kenya (%)
Place of birth for the foreign-born population - Somalia (%)
Place of birth for the foreign-born population - Uganda (%)
Place of birth for the foreign-born population - Zimbabwe (%)
Place of birth for the foreign-born population - Other Eastern Africa (%)
Place of birth for the foreign-born population - Cameroon (%)
Place of birth for the foreign-born population - Congo (%)
Place of birth for the foreign-born population - Democratic Republic of Congo (Zaire) (%)
Place of birth for the foreign-born population - Other Middle Africa (%)
Place of birth for the foreign-born population - Egypt (%)
Place of birth for the foreign-born population - Morocco (%)
Place of birth for the foreign-born population - Sudan (%)
Place of birth for the foreign-born population - Other Northern Africa (%)
Place of birth for the foreign-born population - South Africa (%)
Place of birth for the foreign-born population - Other Southern Africa (%)
Place of birth for the foreign-born population - Cabo Verde (%)
Place of birth for the foreign-born population - Ghana (%)
Place of birth for the foreign-born population - Liberia (%)
Place of birth for the foreign-born population - Nigeria (%)
Place of birth for the foreign-born population - Senegal (%)
Place of birth for the foreign-born population - Sierra Leone (%)
Place of birth for the foreign-born population - Other Western Africa (%)
Place of birth for the foreign-born population - Australia (%)
Place of birth for the foreign-born population - New Zealand (%)
Place of birth for the foreign-born population - Fiji (%)
Place of birth for the foreign-born population - Micronesia (%)
Place of birth for the foreign-born population - Bahamas (%)
Place of birth for the foreign-born population - Barbados (%)
Place of birth for the foreign-born population - Cuba (%)
Place of birth for the foreign-born population - Dominica (%)
Place of birth for the foreign-born population - Dominican Republic (%)
Place of birth for the foreign-born population - Grenada (%)
Place of birth for the foreign-born population - Haiti (%)
Place of birth for the foreign-born population - Jamaica (%)
Place of birth for the foreign-born population - St. Vincent and the Grenadines (%)
Place of birth for the foreign-born population - Trinidad and Tobago (%)
Place of birth for the foreign-born population - West Indies (%)
Place of birth for the foreign-born population - Other Caribbean (%)
Place of birth for the foreign-born population - Belize (%)
Place of birth for the foreign-born population - Costa Rica (%)
Place of birth for the foreign-born population - El Salvador (%)
Place of birth for the foreign-born population - Guatemala (%)
Place of birth for the foreign-born population - Honduras (%)
Place of birth for the foreign-born population - Mexico (%)
Place of birth for the foreign-born population - Nicaragua (%)
Place of birth for the foreign-born population - Panama (%)
Place of birth for the foreign-born population - Other Central America (%)
Place of birth for the foreign-born population - Argentina (%)
Place of birth for the foreign-born population - Bolivia (%)
Place of birth for the foreign-born population - Brazil (%)
Place of birth for the foreign-born population - Chile (%)
Place of birth for the foreign-born population - Colombia (%)
Place of birth for the foreign-born population - Ecuador (%)
Place of birth for the foreign-born population - Guyana (%)
Place of birth for the foreign-born population - Peru (%)
Place of birth for the foreign-born population - Uruguay (%)
Place of birth for the foreign-born population - Venezuela (%)
Place of birth for the foreign-born population - Other South America (%)
Place of birth for the foreign-born population - Canada (%)
Place of birth for the foreign-born population - Other Northern America (%)
Place of birth for the foreign-born population - Other (%)
Latest news about races in Vidalia, GA collected exclusively by city-data.com from local newspapers, TV, and radio stations
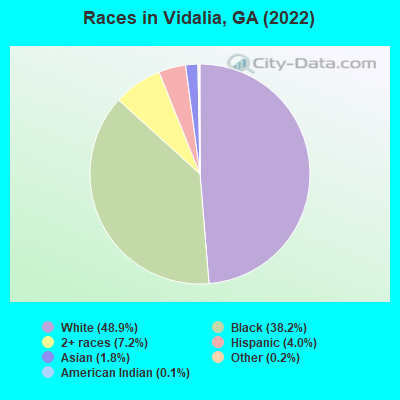
According to 2022 data, the most numerous races in Vidalia, GA are White alone (5,341 residents), Black alone (4,168 residents), and Hispanic (435 residents). 93.0% of Vidalia residents speak English at home. 4.3% of Vidalia, GA residents are foreign-born (1.7% born in Latin America, 1.3% born in Asia, 1.1% born in Europe), which is 134.4% less than the foreign-born rate of 10.0% across the entire state of Georgia.
Race distribution in Vidalia
2000 2022
5,128,661 62.6% White alone 2,331,465 28.5% Black alone 435,227 5.3% Hispanic 171,513 2.1% Asian alone 87,364 1.1% Two or more races 17,670 0.2% American Indian alone 11,275 0.1% Other race alone 3,278 0.04% Native Hawaiian and Other
5,415,657 49.6% White alone 3,349,240 30.7% Black alone 1,132,604 10.4% Hispanic 479,156 4.4% Asian alone 462,923 4.2% Two or more races 54,416 0.5% Other race alone 11,923 0.1% American Indian alone 6,957 0.06% Native Hawaiian and Other
Income and house value in Vidalia Median household income in 2022 $66,742 White non-Hispanic householders$26,754 Black householders$129,372 Asian householdersMedian 2022 house value $197,867 White Non-Hispanic householders$116,551 Black or African American householders$67,762 American Indian or Alaska Native householders$110,884 Two or more races householders
Median age by race in Vidalia
42.4 Median age for White residents42.0 44.7 29.9 Median age for Black or African American residents24.9 35.7 -597,462,513.8 Median age for American Indian / Alaska Native residents-597,222,221.6 -597,938,143.7 41.5 Median age for Asian residents33.7 43.9 -657,243,815.6 Median age for Native Hawaiian / Pacific Islander residents-693,227,090.9 -776,776,776.0 29.3 Median age for Other race residents29.3 -668,981,480.8 32.0 Median age for Two or more races residents18.9 64.2 42.4 Median age for White alone residents41.8 45.3 43.6 Median age for Hispanic or Latino residents36.0 91.7
Owner/renter occupied households by race in Vidalia
House owners and renters - White residents 1,473 65.3% Owner occupied782 34.7% Renter occupiedHouse owners and renters - Black or African American residents 402 31.5% Owner occupied876 68.5% Renter occupiedHouse owners and renters - Asian residents 43 74.5% Owner occupied15 25.5% Renter occupiedHouse owners and renters - Other race residents 17 100.0% Renter occupiedHouse owners and renters - Two or more races residents 366 70.5% Owner occupied153 29.5% Renter occupiedHouse owners and renters - White alone residents 1,472 65.1% Owner occupied789 34.9% Renter occupiedHouse owners and renters - Hispanic or Latino residents 180 81.8% Owner occupied40 18.2% Renter occupied
Language usage in Vidalia
English speakers - Total 93.0% of residents of Vidalia speak English at home.
3.6% of residents speak Spanish at home 228 62.1% Speak English very well139 37.9% Speak English less than very well3.2% of residents speak other language at home 117 35.9% Speak English very well209 64.1% Speak English less than very well
English speakers - Born in the United States 91.8% of residents of Vidalia speak English at home.
7.0% of residents speak Spanish at home 130 100.0% Speak English very well1.1% of residents speak other language at home 20 100.0% Speak English very well
English speakers - Native, born elsewhere 41.7% of residents of Vidalia speak English at home.
57.8% of residents speak Spanish at home 81 68.6% Speak English very well37 31.4% Speak English less than very well
English speakers - Foreign-born 27.0% of residents of Vidalia speak English at home.
9.7% of residents speak Spanish at home 13 28.9% Speak English very well32 71.1% Speak English less than very well63.1% of residents speak other language at home 95 32.3% Speak English very well199 67.7% Speak English less than very well
White (Caucasian) - Speak only English Native:
98.7% (5,042)Foreign-born:
100.0% (74)
White (Caucasian) - Speak another language Native:
1.8% (90)Foreign-born:
15.6% (11)
Black or African American - Speak only English Native:
98.0% (3,883)Foreign-born:
97.7% (1)
Asian - Speak only English Native:
58.3% (15)Foreign-born:
9.4% (14)
Asian - Speak another language Native:
40.6% (10)Foreign-born:
90.8% (134)
Two or more races - Speak another language Native:
30.7% (181)Foreign-born:
99.4% (230)
White alone - Speak only English Native:
99.7% (4,974)Foreign-born:
82.5% (87)
White alone - Speak another language Native:
0.4% (18)Foreign-born:
17.9% (19)
Hispanic or Latino - Speak only English Native:
30.4% (110)Foreign-born:
17.2% (10)
Hispanic or Latino - Speak another language Native:
68.9% (249)Foreign-born:
83.2% (47)
Foreign-born residents in Vidalia 466 residents are foreign born (1.7% Latin America , 1.3% Asia , 1.1% Europe ).
This city:
4.3%Georgia:
10.4%
Marital status for residents in Vidalia Marital status - White (Caucasian) population 15 years and over
Males 28.6% Never married60.3% Now married0.3% Separated3.0% Widowed7.9% DivorcedFemales 28.2% Never married42.5% Now married3.0% Separated12.6% Widowed13.7% DivorcedWomen who gave birth in the past 12 months Now married:
100.0% (83)Unmarried:
0.0% (0)
Women who did not give birth in the past 12 months Now married:
37.2% (419)Unmarried:
62.8% (709)
Marital status - Black or African American population 15 years and over
Males 67.1% Never married29.1% Now married0.9% Separated0.0% Widowed2.9% DivorcedFemales 50.8% Never married19.8% Now married9.5% Separated11.1% Widowed8.7% DivorcedWomen who gave birth in the past 12 months Now married:
100.0% (26)Unmarried:
0.0% (0)
Women who did not give birth in the past 12 months Now married:
20.9% (286)Unmarried:
79.1% (1,080)
Marital status - Asian population 15 years and over
Males 34.5% Never married54.5% Now married0.0% Separated0.0% Widowed10.9% DivorcedFemales 25.6% Never married57.8% Now married0.0% Separated0.0% Widowed16.7% DivorcedWomen who gave birth in the past 12 months Now married:
0.0% (0)Unmarried:
100.0% (18)
Women who did not give birth in the past 12 months Now married:
69.4% (35)Unmarried:
30.6% (16)
Marital status - Two or more races population 15 years and over
Males 27.0% Never married65.3% Now married0.0% Separated0.0% Widowed7.7% DivorcedFemales 8.2% Never married34.1% Now married0.0% Separated50.9% Widowed6.8% DivorcedWomen who did not give birth in the past 12 months Now married:
66.2% (67)Unmarried:
33.8% (34)
Marital status - White alone, not Hispanic / Latino population 15 years and over
Males 25.3% Never married62.7% Now married0.3% Separated3.2% Widowed8.4% DivorcedFemales 27.1% Never married43.0% Now married3.1% Separated12.8% Widowed13.9% DivorcedWomen who gave birth in the past 12 months Now married:
100.0% (87)Unmarried:
0.0% (0)
Women who did not give birth in the past 12 months Now married:
37.3% (428)Unmarried:
62.7% (719)
Marital status - Hispanic or Latino population 15 years and over
Males 55.9% Never married44.1% Now married0.0% Separated0.0% Widowed0.0% DivorcedFemales 22.5% Never married10.5% Now married0.0% Separated67.0% Widowed0.0% DivorcedWomen who did not give birth in the past 12 months Now married:
29.2% (8)Unmarried:
70.8% (18)
Ancestries in Vidalia
888 15.9% American700 12.5% English267 4.8% Irish250 4.5% German110 2.0% Brazilian94 1.7% European72 1.3% Welsh63 1.1% Scottish43 0.8% Scotch-Irish27 0.5% Russian16 0.3% African15 0.3% Eastern European15 0.3% French1 0.02% Haitian
Children Nativity (place of birth) in Vidalia
Children under 6 years - Living with two parents Both parents native 302 100.0% NativeOne native, one foreign-born parent 13 100.0% NativeChildren under 6 years - Living with one parent Native parent 322 100.0% NativeForeign-born parent 27 100.0% NativeChildren 6 to 17 years - Living with two parents Both parents native 641 100.0% NativeBoth parents foreign-born 28 35.3% Native51 64.7% Foreign-bornOne native, one foreign-born parent 6 100.0% NativeChildren 6 to 17 years - Living with one parent Native parent 916 100.0% Native
Grandparents responsible for own grandchildren in Vidalia
Grandparents (30 to 59 years) White / Caucasian 8 13.3% Responsible for grandchildren50 86.7% Not responsible for grandchildrenBlack or African American 19 17.8% Responsible for grandchildren89 82.2% Not responsible for grandchildrenAsian 19 100.0% Responsible for grandchildrenWhite alone, not Hispanic / Latino 8 21.2% Responsible for grandchildren29 78.8% Not responsible for grandchildrenHispanic or Latino 24 100.0% Not responsible for grandchildrenGrandparents (60 years and over) White / Caucasian 42 59.1% Responsible for grandchildren29 40.9% Not responsible for grandchildrenBlack or African American 32 27.6% Responsible for grandchildren85 72.4% Not responsible for grandchildrenAsian 28 80.6% Responsible for grandchildren7 19.4% Not responsible for grandchildrenWhite alone, not Hispanic / Latino 42 57.9% Responsible for grandchildren31 42.1% Not responsible for grandchildren