Races in Vicksburg, Mississippi (MS) Detailed Stats
Ancestries, Foreign-born residents, place of birth
Settings
X


Recent posts about races in Vicksburg, Mississippi on our local forum with over 2,400,000 registered users:
 | June travel in Mississippi? (55 replies) |
| Non-smoking apartments in Vicksburg or Jackson? (2 replies) |
| Do you guys like the new flag? (70 replies) |
| Redneck Eruption (2 replies) |
| Vicksburg, MS- to go or not to go... (14 replies) |
| Up to 20 gunshots, before CALIFORNIA car crashes THROUGH Jackson home (18 replies) |
Latest news about races in Vicksburg, MS collected exclusively by city-data.com from local newspapers, TV, and radio stations
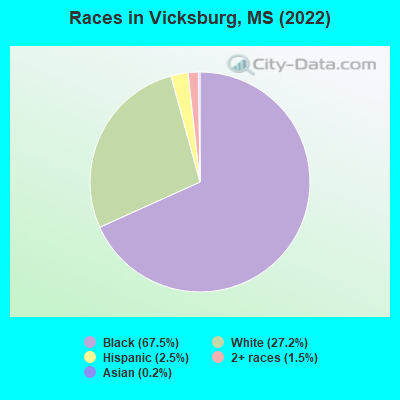
According to 2022 data, the most numerous races in Vicksburg, MS are White alone (5,775 residents), Black alone (14,315 residents), and Hispanic (527 residents). 94.2% of Vicksburg residents speak English at home. 3.6% of Vicksburg, MS residents are foreign-born (1.5% born in Latin America, 1.1% born in Europe, 0.4% born in Asia, 0.4% born in Africa), which is 44.9% greater than the foreign-born rate of 2.0% across the entire state of Mississippi.
Race distribution in Vicksburg
2000
2022

- 15,89260.2%Black alone
- 9,87337.4%White alone
- 2741.0%Hispanic
- 1570.6%Asian alone
- 1440.5%Two or more races
- 400.2%American Indian alone
- 250.09%Other race alone
- 20.01%Native Hawaiian and Other
Pacific Islander alone

-
- 14,31567.5%Black alone
- 5,77527.2%White alone
- 5272.5%Hispanic
- 3141.5%Two or more races
- 530.2%Asian alone
- 80.04%Other race alone
- 30.01%Native Hawaiian and Other
Pacific Islander alone
2000
2022
-
- 1,727,90860.7%White alone
- 1,028,47336.2%Black alone
- 39,5691.4%Hispanic
- 17,2720.6%Two or more races
- 18,3490.6%Asian alone
- 11,2240.4%American Indian alone
- 1,2940.05%Other race alone
- 5690.02%Native Hawaiian and Other
Pacific Islander alone

-
- 1,625,97955.3%White alone
- 1,072,96236.5%Black alone
- 97,1773.3%Hispanic
- 96,3673.3%Two or more races
- 25,2170.9%Asian alone
- 12,4570.4%American Indian alone
- 9,5010.3%Other race alone
- 3970.01%Native Hawaiian and Other
Pacific Islander alone

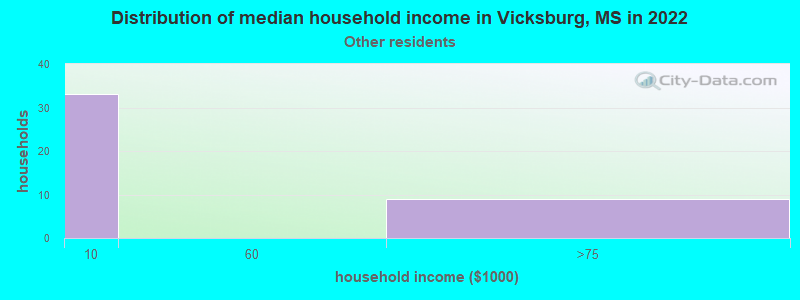
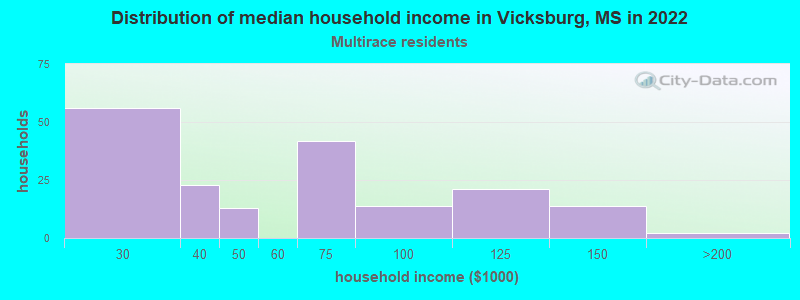
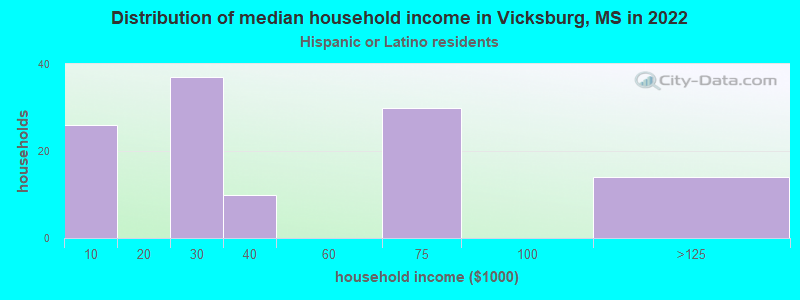
Income and house value in Vicksburg
- Median household income in 2022
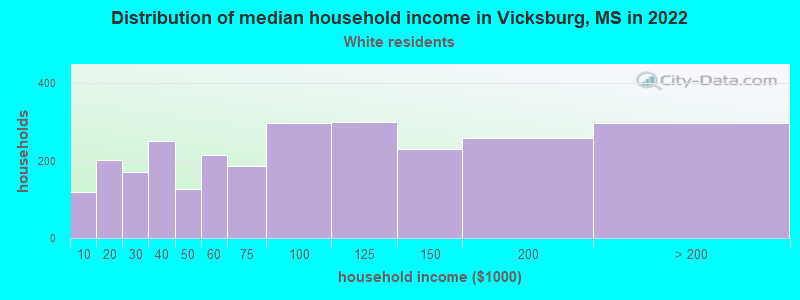
- $79,670White non-Hispanic householders
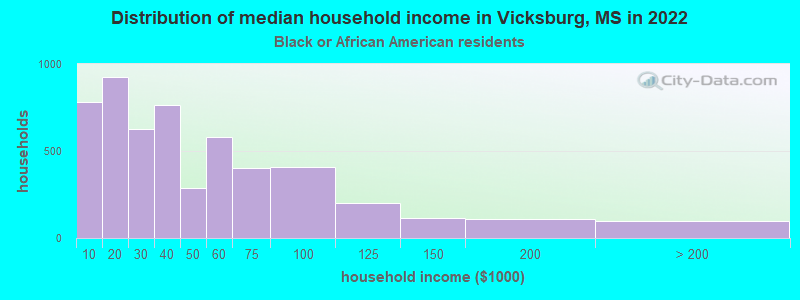
- $35,289Black householders
- $67,812Two or more races householders
- Median 2022 house value
- $166,847White Non-Hispanic householders
- $97,292Black or African American householders
- $36,226American Indian or Alaska Native householders
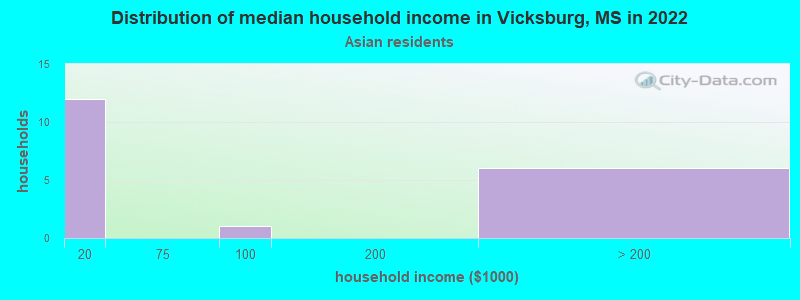
- $164,363Asian householders
- $113,853Some other race householders
- $157,324Two or more races householders
- $104,952Hispanic or Latino householders
Household income for White non-Hispanic householders
Household income for Black householders
Household income for Asian householders
Household income for Some other race householders
Household income for Two or more races householders
Household income for Hispanic or Latino race householders
Median age by race in Vicksburg
- 52.7Median age for White residents
- 52.6Males
- 53.7Females
- 36.0Median age for Black or African American residents
- 34.9Males
- 37.3Females
- -703,818,368.7Median age for American Indian / Alaska Native residents
- -751,111,110.4Males
- -710,601,718.5Females
- 34.5Median age for Asian residents
- 29.2Males
- 47.3Females
- -666,666,666.0Median age for Native Hawaiian / Pacific Islander residents
- -668,724,279.2Males
- -670,599,802.7Females
- 44.4Median age for Other race residents
- 43.8Males
- -632,034,631.4Females
- 31.9Median age for Two or more races residents
- 28.7Males
- 39.4Females
- 52.1Median age for White alone residents
- 52.2Males
- 53.0Females
- 38.5Median age for Hispanic or Latino residents
- 37.9Males
- 49.2Females
Owner/renter occupied households by race in Vicksburg
- House owners and renters - White residents
- 2,02375.4%Owner occupied
- 65924.6%Renter occupied
- House owners and renters - Black or African American residents
- 3,02456.9%Owner occupied
- 2,29143.1%Renter occupied
- House owners and renters - Asian residents
- 1048.3%Owner occupied
- 1151.7%Renter occupied
- House owners and renters - Other race residents
- 928.4%Owner occupied
- 2271.6%Renter occupied
- House owners and renters - Two or more races residents
- 5725.9%Owner occupied
- 16374.1%Renter occupied
- House owners and renters - White alone residents
- 2,01875.0%Owner occupied
- 67325.0%Renter occupied
- House owners and renters - Hispanic or Latino residents
- 4738.4%Owner occupied
- 7661.6%Renter occupied
Language usage in Vicksburg
- English speakers - Total
- 94.2% of residents of Vicksburg speak English at home.
- 2.7% of residents speak Spanish at home
- 16931.1%Speak English very well
- 37468.9%Speak English less than very well
- 3.0% of residents speak other language at home
- 28447.2%Speak English very well
- 31852.8%Speak English less than very well
- English speakers - Born in the United States
- 92.5% of residents of Vicksburg speak English at home.
- 4.8% of residents speak Spanish at home
- 9862.0%Speak English very well
- 6038.0%Speak English less than very well
- 2.5% of residents speak other language at home
- 3441.0%Speak English very well
- 4959.0%Speak English less than very well
- English speakers - Native, born elsewhere
- 35.2% of residents of Vicksburg speak English at home.
- 61.6% of residents speak Spanish at home
- 6162.2%Speak English very well
- 3737.8%Speak English less than very well
- English speakers - Foreign-born
- 28.0% of residents of Vicksburg speak English at home.
- 26.7% of residents speak Spanish at home
- 168.6%Speak English very well
- 17191.4%Speak English less than very well
- 46.0% of residents speak other language at home
- 23472.7%Speak English very well
- 8827.3%Speak English less than very well
White (Caucasian) - Speak only English
| Native: | 96.0% (5,117) |
| Foreign-born: | 58.8% (85) |
White (Caucasian) - Speak another language
| Native: | 3.3% (175) |
| Foreign-born: | 47.2% (69) |
Black or African American - Speak only English
| Native: | 98.4% (12,954) |
| Foreign-born: | 1.5% (2) |
Black or African American - Speak another language
| Native: | 1.6% (212) |
| Foreign-born: | 100.0% (123) |
Asian - Speak another language
| Native: | 100.0% (7) |
| Foreign-born: | 95.5% (52) |
Two or more races - Speak only English
| Native: | 46.7% (238) |
| Foreign-born: | 32.0% (118) |
Two or more races - Speak another language
| Native: | 64.4% (327) |
| Foreign-born: | 61.8% (228) |
White alone - Speak only English
| Native: | 95.6% (5,077) |
| Foreign-born: | 40.8% (90) |
White alone - Speak another language
| Native: | 4.6% (242) |
| Foreign-born: | 59.9% (132) |
Hispanic or Latino - Speak only English
| Native: | 30.0% (76) |
| Foreign-born: | 14.3% (36) |
Hispanic or Latino - Speak another language
| Native: | 68.8% (174) |
| Foreign-born: | 77.5% (195) |
Foreign-born residents in Vicksburg
769 residents are foreign born (1.5% Latin America, 1.1% Europe, 0.4% Asia, 0.4% Africa).
| This city: | 3.6% |
| Mississippi: | 2.3% |


Marital status for residents in Vicksburg
Marital status - White (Caucasian) population 15 years and over
- Males
- 23.3%Never married
- 50.1%Now married
- 2.0%Separated
- 6.7%Widowed
- 17.9%Divorced
- Females
- 19.1%Never married
- 51.8%Now married
- 0.8%Separated
- 15.6%Widowed
- 12.6%Divorced
Women who gave birth in the past 12 months
| Now married: | 100.0% (34) |
| Unmarried: | 0.0% (0) |
Women who did not give birth in the past 12 months
| Now married: | 48.6% (493) |
| Unmarried: | 51.4% (521) |
Marital status - Black or African American population 15 years and over
- Males
- 51.9%Never married
- 25.8%Now married
- 2.5%Separated
- 4.3%Widowed
- 15.5%Divorced
- Females
- 55.4%Never married
- 17.9%Now married
- 3.3%Separated
- 10.1%Widowed
- 13.4%Divorced
Women who gave birth in the past 12 months
| Now married: | 30.6% (48) |
| Unmarried: | 69.4% (108) |
Women who did not give birth in the past 12 months
| Now married: | 22.0% (829) |
| Unmarried: | 78.0% (2,934) |
Marital status - Asian population 15 years and over
- Males
- 71.4%Never married
- 28.6%Now married
- 0.0%Separated
- 0.0%Widowed
- 0.0%Divorced
- Females
- 0.0%Never married
- 100.0%Now married
- 0.0%Separated
- 0.0%Widowed
- 0.0%Divorced
Women who did not give birth in the past 12 months
| Now married: | 100.0% (15) |
| Unmarried: | 0.0% (0) |
Marital status - Other race population 15 years and over
- Males
- 0.0%Never married
- 17.9%Now married
- 0.0%Separated
- 0.0%Widowed
- 82.1%Divorced
- Females
- 0.0%Never married
- 100.0%Now married
- 0.0%Separated
- 0.0%Widowed
- 0.0%Divorced
Marital status - Two or more races population 15 years and over
- Males
- 78.2%Never married
- 18.3%Now married
- 0.0%Separated
- 0.0%Widowed
- 3.5%Divorced
- Females
- 33.2%Never married
- 66.8%Now married
- 0.0%Separated
- 0.0%Widowed
- 0.0%Divorced
Women who did not give birth in the past 12 months
| Now married: | 28.3% (47) |
| Unmarried: | 71.7% (120) |
Marital status - White alone, not Hispanic / Latino population 15 years and over
- Males
- 23.0%Never married
- 50.2%Now married
- 2.0%Separated
- 6.8%Widowed
- 18.1%Divorced
- Females
- 19.4%Never married
- 51.5%Now married
- 0.9%Separated
- 15.8%Widowed
- 12.4%Divorced
Women who gave birth in the past 12 months
| Now married: | 100.0% (34) |
| Unmarried: | 0.0% (0) |
Women who did not give birth in the past 12 months
| Now married: | 48.6% (499) |
| Unmarried: | 51.4% (528) |
Marital status - Hispanic or Latino population 15 years and over
- Males
- 75.0%Never married
- 15.7%Now married
- 0.0%Separated
- 0.0%Widowed
- 9.3%Divorced
- Females
- 25.1%Never married
- 69.0%Now married
- 0.0%Separated
- 0.0%Widowed
- 5.9%Divorced
Women who did not give birth in the past 12 months
| Now married: | 23.1% (20) |
| Unmarried: | 76.9% (65) |
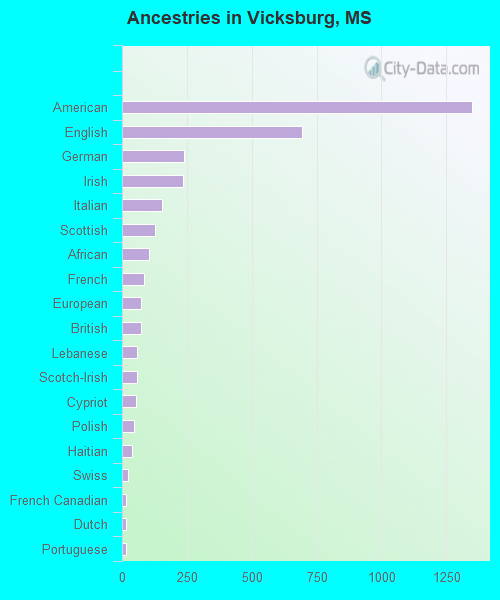
Ancestries in Vicksburg

- 1,3478.3%American
- 6934.3%English
- 2381.5%German
- 2351.5%Irish
- 1530.9%Italian
- 1280.8%Scottish
- 1030.6%African
- 850.5%French
- 750.5%European
- 740.5%British
- 580.4%Lebanese
- 570.4%Scotch-Irish
- 550.3%Cypriot
- 450.3%Polish
- 400.2%Haitian
- 240.1%Swiss
- 160.10%French Canadian
- 150.09%Dutch
- 150.09%Portuguese
- 120.07%Finnish
- 120.07%Greek
- 120.07%Nigerian
- 80.05%Canadian
- 70.04%Slavic
- 50.03%Austrian
- 40.02%Russian
Geographical mobility in Vicksburg

- Same house 1 year ago
- 4,91885.5%White (Caucasian)
- 13,34493.9%Black or African American
- 5287.3%Asian
- 431.1%Native Hawaiian / Pacific Islander
- 2640.2%Other race
- 74277.7%Two or more races
- 4,91785.3%White alone, not Hispanic / Latino
- 45386.8%Hispanic or Latino

-
- Moved within same county
- 3415.9%White / Caucasian
- 7355.2%Black or African American
- 710.4%Other race
- 13313.9%Two or more races
- 3516.1%White alone, not Hispanic / Latino
- 40.8%Hispanic or Latino

-
- Moved within same state
- 911.6%White / Caucasian
- 1150.8%Black or African American
- 69.6%Asian
- 1072.6%Native Hawaiian / Pacific Islander
- 901.6%White alone, not Hispanic / Latino
- 81.6%Hispanic or Latino

-
- Moved from different state
- 2093.6%White / Caucasian
- 330.2%Black or African American
- 394.0%Two or more races
- 2093.6%White alone, not Hispanic / Latino
- 326.0%Hispanic or Latino

-
- Moved from abroad
- 2304.0%White
- 150.1%Black or African American
- 47.4%Asian
- 6194.0%Other race
- 101.0%Two or more races
- 2424.2%White alone, not Hispanic / Latino
- 5410.4%Hispanic or Latino

Children Nativity (place of birth) in Vicksburg
Place of birth for residents in Vicksburg
![Place of birth for the foreign-born population - Regions]()
- 327Americas
- 318Latin America
- 246Europe
- 226Central America
- 213Northern Europe
- 95Asia
- 91Caribbean
- 89Africa
- 73Northern Africa
- 48South Central Asia
- 31Western Asia
- 17Western Europe
- 16Southern Europe
- 12Western Africa
- 11South Eastern Asia
- 9Oceania
- 9Northern America
- 4Eastern Asia
- 4China
- 3Southern Africa
- 1Eastern Africa

![Place of birth for the foreign-born population - Countries]()
- 193United Kingdom
- 158Mexico
- 73Sudan
- 68Guatemala
- 43India
- 38Haiti
- 31Cuba
- 21Dominican Republic
- 16Portugal
- 11Philippines
- 11Nigeria
- 10Netherlands
- 9Canada
- 7Ireland
- 7Germany
- 6Yemen
- 5Kazakhstan
- 4China
- 3South Africa
- 1Tanzania
- 1Liberia

Grandparents responsible for own grandchildren in Vicksburg
Zip codes: 39180.