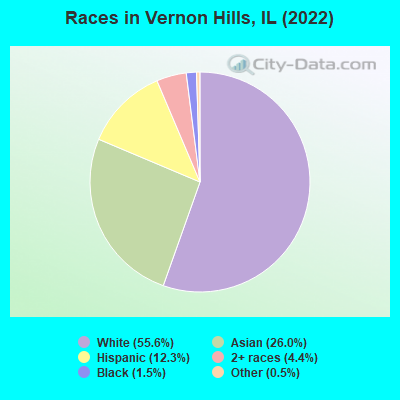
Races in Vernon Hills, Illinois (IL) Detailed Stats
Data:
Races - White alone (%)
Races - White alone (% change since 2000)
Races - Black alone (%)
Races - Black alone (% change since 2000)
Races - American Indian alone (%)
Races - American Indian alone (% change since 2000)
Races - Asian alone (%)
Races - Asian alone (% change since 2000)
Races - Hispanic (%)
Races - Hispanic (% change since 2000)
Races - Native Hawaiian and Other Pacific Islander alone (%)
Races - Native Hawaiian and Other Pacific Islander alone (% change since 2000)
Races - Two or more races(%)
Races - Two or more races(% change since 2000)
Races - Other race alone (%)
Races - Other race alone (% change since 2000)
Racial diversity
Place of birth - Born in state of residence (%)
Place of birth - Born in state of residence (%) - White
Place of birth - Born in state of residence (%) - Black or African American
Place of birth - Born in state of residence (%) - Asian
Place of birth - Born in state of residence (%) - Hispanic or Latino
Place of birth - Born in state of residence (%) - American Indian and Alaska Native
Place of birth - Born in state of residence (%) - Multirace
Place of birth - Born in state of residence (%) - Other Race
Place of birth - Born in other state (%)
Place of birth - Born in other state (%) - White
Place of birth - Born in other state (%) - Black or African American
Place of birth - Born in other state (%) - Asian
Place of birth - Born in other state (%) - Hispanic or Latino
Place of birth - Born in other state (%) - American Indian and Alaska Native
Place of birth - Born in other state (%) - Multirace
Place of birth - Born in other state (%) - Other Race
Place of birth - Native, outside of US (%)
Place of birth - Native, outside of US (%) - White
Place of birth - Native, outside of US (%) - Black or African American
Place of birth - Native, outside of US (%) - Asian
Place of birth - Native, outside of US (%) - Hispanic or Latino
Place of birth - Native, outside of US (%) - American Indian and Alaska Native
Place of birth - Native, outside of US (%) - Multirace
Place of birth - Native, outside of US (%) - Other Race
Place of birth - Foreign born (%)
Place of birth - Foreign born (%) - White
Place of birth - Foreign born (%) - Black or African American
Place of birth - Foreign born (%) - Asian
Place of birth - Foreign born (%) - Hispanic or Latino
Place of birth - Foreign born (%) - American Indian and Alaska Native
Place of birth - Foreign born (%) - Multirace
Place of birth - Foreign born (%) - Other Race
Residents speaking English at home (%)
Residents speaking English at home - Born in the United States (%)
Residents speaking English at home - Native, born elsewhere (%)
Residents speaking English at home - Foreign born (%)
Residents speaking Spanish at home (%)
Residents speaking Spanish at home - Born in the United States (%)
Residents speaking Spanish at home - Native, born elsewhere (%)
Residents speaking Spanish at home - Foreign born (%)
Residents speaking other language at home (%)
Residents speaking other language at home - Born in the United States (%)
Residents speaking other language at home - Native, born elsewhere (%)
Residents speaking other language at home - Foreign born (%)
Marital status - Never married (%)
Marital status - Now married (%)
Marital status - Separated (%)
Marital status - Widowed (%)
Marital status - Divorced (%)
Ancestries Reported - Arab (%)
Ancestries Reported - Czech (%)
Ancestries Reported - Danish (%)
Ancestries Reported - Dutch (%)
Ancestries Reported - English (%)
Ancestries Reported - French (%)
Ancestries Reported - French Canadian (%)
Ancestries Reported - German (%)
Ancestries Reported - Greek (%)
Ancestries Reported - Hungarian (%)
Ancestries Reported - Irish (%)
Ancestries Reported - Italian (%)
Ancestries Reported - Lithuanian (%)
Ancestries Reported - Norwegian (%)
Ancestries Reported - Polish (%)
Ancestries Reported - Portuguese (%)
Ancestries Reported - Russian (%)
Ancestries Reported - Scotch-Irish (%)
Ancestries Reported - Scottish (%)
Ancestries Reported - Slovak (%)
Ancestries Reported - Subsaharan African (%)
Ancestries Reported - Swedish (%)
Ancestries Reported - Swiss (%)
Ancestries Reported - Ukrainian (%)
Ancestries Reported - United States (%)
Ancestries Reported - Welsh (%)
Ancestries Reported - West Indian (%)
Ancestries Reported - Other (%)
Geographical mobility - Same house 1 year ago (%)
Geographical mobility - Same house 1 year ago (%) - White
Geographical mobility - Same house 1 year ago (%) - Black or African American
Geographical mobility - Same house 1 year ago (%) - Asian
Geographical mobility - Same house 1 year ago (%) - Hispanic or Latino
Geographical mobility - Same house 1 year ago (%) - American Indian and Alaska Native
Geographical mobility - Same house 1 year ago (%) - Multirace
Geographical mobility - Same house 1 year ago (%) - Other Race
Geographical mobility - Moved within same county (%)
Geographical mobility - Moved within same county (%) - White
Geographical mobility - Moved within same county (%) - Black or African American
Geographical mobility - Moved within same county (%) - Asian
Geographical mobility - Moved within same county (%) - Hispanic or Latino
Geographical mobility - Moved within same county (%) - American Indian and Alaska Native
Geographical mobility - Moved within same county (%) - Multirace
Geographical mobility - Moved within same county (%) - Other Race
Geographical mobility - Moved from different county within same state (%)
Geographical mobility - Moved from different county within same state (%) - White
Geographical mobility - Moved from different county within same state (%) - Black or African American
Geographical mobility - Moved from different county within same state (%) - Asian
Geographical mobility - Moved from different county within same state (%) - Hispanic or Latino
Geographical mobility - Moved from different county within same state (%) - American Indian and Alaska Native
Geographical mobility - Moved from different county within same state (%) - Multirace
Geographical mobility - Moved from different county within same state (%) - Other Race
Geographical mobility - Moved from different state (%)
Geographical mobility - Moved from different state (%) - White
Geographical mobility - Moved from different state (%) - Black or African American
Geographical mobility - Moved from different state (%) - Asian
Geographical mobility - Moved from different state (%) - Hispanic or Latino
Geographical mobility - Moved from different state (%) - American Indian and Alaska Native
Geographical mobility - Moved from different state (%) - Multirace
Geographical mobility - Moved from different state (%) - Other Race
Geographical mobility - Moved from abroad (%)
Geographical mobility - Moved from abroad (%) - White
Geographical mobility - Moved from abroad (%) - Black or African American
Geographical mobility - Moved from abroad (%) - Asian
Geographical mobility - Moved from abroad (%) - Hispanic or Latino
Geographical mobility - Moved from abroad (%) - American Indian and Alaska Native
Geographical mobility - Moved from abroad (%) - Multirace
Geographical mobility - Moved from abroad (%) - Other Race
Place of birth for the foreign-born population - Ireland (%)
Place of birth for the foreign-born population - Denmark (%)
Place of birth for the foreign-born population - Norway (%)
Place of birth for the foreign-born population - Sweden (%)
Place of birth for the foreign-born population - United Kingdom (%)
Place of birth for the foreign-born population - England (%)
Place of birth for the foreign-born population - Scotland (%)
Place of birth for the foreign-born population - Other Northern Europe (%)
Place of birth for the foreign-born population - Austria (%)
Place of birth for the foreign-born population - Belgium (%)
Place of birth for the foreign-born population - France (%)
Place of birth for the foreign-born population - Germany (%)
Place of birth for the foreign-born population - Netherlands (%)
Place of birth for the foreign-born population - Switzerland (%)
Place of birth for the foreign-born population - Other Western Europe (%)
Place of birth for the foreign-born population - Greece (%)
Place of birth for the foreign-born population - Italy (%)
Place of birth for the foreign-born population - Portugal (%)
Place of birth for the foreign-born population - Spain (%)
Place of birth for the foreign-born population - Other Southern Europe (%)
Place of birth for the foreign-born population - Albania (%)
Place of birth for the foreign-born population - Belarus (%)
Place of birth for the foreign-born population - Bosnia and Herzegovina (%)
Place of birth for the foreign-born population - Bulgaria (%)
Place of birth for the foreign-born population - Croatia (%)
Place of birth for the foreign-born population - Czechoslovakia (%)
Place of birth for the foreign-born population - Hungary (%)
Place of birth for the foreign-born population - Latvia (%)
Place of birth for the foreign-born population - Lithuania (%)
Place of birth for the foreign-born population - North Macedonia (Macedonia) (%)
Place of birth for the foreign-born population - Moldova (%)
Place of birth for the foreign-born population - Poland (%)
Place of birth for the foreign-born population - Romania (%)
Place of birth for the foreign-born population - Russia (%)
Place of birth for the foreign-born population - Serbia (%)
Place of birth for the foreign-born population - Ukraine (%)
Place of birth for the foreign-born population - Other Eastern Europe (%)
Place of birth for the foreign-born population - China (%)
Place of birth for the foreign-born population - Hong Kong (%)
Place of birth for the foreign-born population - Taiwan (%)
Place of birth for the foreign-born population - Japan (%)
Place of birth for the foreign-born population - Korea (%)
Place of birth for the foreign-born population - Other Eastern Asia (%)
Place of birth for the foreign-born population - Afghanistan (%)
Place of birth for the foreign-born population - Bangladesh (%)
Place of birth for the foreign-born population - India (%)
Place of birth for the foreign-born population - Iran (%)
Place of birth for the foreign-born population - Kazakhstan (%)
Place of birth for the foreign-born population - Nepal (%)
Place of birth for the foreign-born population - Pakistan (%)
Place of birth for the foreign-born population - Sri Lanka (%)
Place of birth for the foreign-born population - Uzbekistan (%)
Place of birth for the foreign-born population - Other South Central Asia (%)
Place of birth for the foreign-born population - Burma (%)
Place of birth for the foreign-born population - Cambodia (%)
Place of birth for the foreign-born population - Indonesia (%)
Place of birth for the foreign-born population - Laos (%)
Place of birth for the foreign-born population - Malaysia (%)
Place of birth for the foreign-born population - Philippines (%)
Place of birth for the foreign-born population - Singapore (%)
Place of birth for the foreign-born population - Thailand (%)
Place of birth for the foreign-born population - Vietnam (%)
Place of birth for the foreign-born population - Other South Eastern Asia (%)
Place of birth for the foreign-born population - Armenia (%)
Place of birth for the foreign-born population - Iraq (%)
Place of birth for the foreign-born population - Israel (%)
Place of birth for the foreign-born population - Jordan (%)
Place of birth for the foreign-born population - Kuwait (%)
Place of birth for the foreign-born population - Lebanon (%)
Place of birth for the foreign-born population - Saudi Arabia (%)
Place of birth for the foreign-born population - Syria (%)
Place of birth for the foreign-born population - Turkey (%)
Place of birth for the foreign-born population - Yemen (%)
Place of birth for the foreign-born population - Other Western Asia (%)
Place of birth for the foreign-born population - Eritrea (%)
Place of birth for the foreign-born population - Ethiopia (%)
Place of birth for the foreign-born population - Kenya (%)
Place of birth for the foreign-born population - Somalia (%)
Place of birth for the foreign-born population - Uganda (%)
Place of birth for the foreign-born population - Zimbabwe (%)
Place of birth for the foreign-born population - Other Eastern Africa (%)
Place of birth for the foreign-born population - Cameroon (%)
Place of birth for the foreign-born population - Congo (%)
Place of birth for the foreign-born population - Democratic Republic of Congo (Zaire) (%)
Place of birth for the foreign-born population - Other Middle Africa (%)
Place of birth for the foreign-born population - Egypt (%)
Place of birth for the foreign-born population - Morocco (%)
Place of birth for the foreign-born population - Sudan (%)
Place of birth for the foreign-born population - Other Northern Africa (%)
Place of birth for the foreign-born population - South Africa (%)
Place of birth for the foreign-born population - Other Southern Africa (%)
Place of birth for the foreign-born population - Cabo Verde (%)
Place of birth for the foreign-born population - Ghana (%)
Place of birth for the foreign-born population - Liberia (%)
Place of birth for the foreign-born population - Nigeria (%)
Place of birth for the foreign-born population - Senegal (%)
Place of birth for the foreign-born population - Sierra Leone (%)
Place of birth for the foreign-born population - Other Western Africa (%)
Place of birth for the foreign-born population - Australia (%)
Place of birth for the foreign-born population - New Zealand (%)
Place of birth for the foreign-born population - Fiji (%)
Place of birth for the foreign-born population - Micronesia (%)
Place of birth for the foreign-born population - Bahamas (%)
Place of birth for the foreign-born population - Barbados (%)
Place of birth for the foreign-born population - Cuba (%)
Place of birth for the foreign-born population - Dominica (%)
Place of birth for the foreign-born population - Dominican Republic (%)
Place of birth for the foreign-born population - Grenada (%)
Place of birth for the foreign-born population - Haiti (%)
Place of birth for the foreign-born population - Jamaica (%)
Place of birth for the foreign-born population - St. Vincent and the Grenadines (%)
Place of birth for the foreign-born population - Trinidad and Tobago (%)
Place of birth for the foreign-born population - West Indies (%)
Place of birth for the foreign-born population - Other Caribbean (%)
Place of birth for the foreign-born population - Belize (%)
Place of birth for the foreign-born population - Costa Rica (%)
Place of birth for the foreign-born population - El Salvador (%)
Place of birth for the foreign-born population - Guatemala (%)
Place of birth for the foreign-born population - Honduras (%)
Place of birth for the foreign-born population - Mexico (%)
Place of birth for the foreign-born population - Nicaragua (%)
Place of birth for the foreign-born population - Panama (%)
Place of birth for the foreign-born population - Other Central America (%)
Place of birth for the foreign-born population - Argentina (%)
Place of birth for the foreign-born population - Bolivia (%)
Place of birth for the foreign-born population - Brazil (%)
Place of birth for the foreign-born population - Chile (%)
Place of birth for the foreign-born population - Colombia (%)
Place of birth for the foreign-born population - Ecuador (%)
Place of birth for the foreign-born population - Guyana (%)
Place of birth for the foreign-born population - Peru (%)
Place of birth for the foreign-born population - Uruguay (%)
Place of birth for the foreign-born population - Venezuela (%)
Place of birth for the foreign-born population - Other South America (%)
Place of birth for the foreign-born population - Canada (%)
Place of birth for the foreign-born population - Other Northern America (%)
Place of birth for the foreign-born population - Other (%)
According to 2022 data, the most numerous races in Vernon Hills, IL are White alone (14,786 residents), Hispanic (3,279 residents), and Black alone (402 residents). 57.2% of Vernon Hills residents speak English at home. 32.8% of Vernon Hills, IL residents are foreign-born (18.6% born in Asia, 8.1% born in Europe, 5.2% born in Latin America), which is 57.3% greater than the foreign-born rate of 14.0% across the entire state of Illinois.
Race distribution in Vernon Hills
2000 2022
8,424,140 67.8% White alone 1,856,152 14.9% Black alone 1,530,262 12.3% Hispanic 419,916 3.4% Asian alone 153,996 1.2% Two or more races 13,479 0.1% Other race alone 18,232 0.1% American Indian alone 3,116 0.03% Native Hawaiian and Other
7,356,301 58.5% White alone 2,299,726 18.3% Hispanic 1,660,423 13.2% Black alone 747,296 5.9% Asian alone 458,599 3.6% Two or more races 45,386 0.4% Other race alone 10,405 0.08% American Indian alone 3,896 0.03% Native Hawaiian and Other
Income and house value in Vernon Hills Median household income in 2022 $115,022 White non-Hispanic householders$87,148 Black householders$95,857 American Indian and Alaska Native householders$137,682 Asian householders$106,720 Some other race householders$151,560 Two or more races householders$85,803 Hispanic or Latino race householdersMedian 2022 house value $444,727 White Non-Hispanic householders$239,711 Black or African American householders$271,054 American Indian or Alaska Native householders $491,644 Asian householders$174,855 Some other race householders$310,875 Two or more races householders$357,595 Hispanic or Latino householders
Median age by race in Vernon Hills
48.0 Median age for White residents43.8 50.4 37.6 Median age for Black or African American residents40.0 36.9 47.5 Median age for American Indian / Alaska Native residents-671,532,846.0 44.3 37.9 Median age for Asian residents39.2 37.8 -593,236,714.4 Median age for Native Hawaiian / Pacific Islander residents-658,536,584.7 -576,015,108.0 39.9 Median age for Other race residents35.1 43.6 19.1 Median age for Two or more races residents10.0 34.1 49.1 Median age for White alone residents46.6 53.1 31.0 Median age for Hispanic or Latino residents20.6 39.2
Owner/renter occupied households by race in Vernon Hills
House owners and renters - White residents 4,729 68.4% Owner occupied2,182 31.6% Renter occupiedHouse owners and renters - Black or African American residents 39 25.1% Owner occupied117 74.9% Renter occupiedHouse owners and renters - American Indian / Alaska Native residents 48 59.6% Owner occupied32 40.4% Renter occupiedHouse owners and renters - Asian residents 1,826 76.9% Owner occupied549 23.1% Renter occupiedHouse owners and renters - Other race residents 144 50.3% Owner occupied142 49.7% Renter occupiedHouse owners and renters - Two or more races residents 180 27.2% Owner occupied484 72.8% Renter occupiedHouse owners and renters - White alone residents 4,699 69.6% Owner occupied2,052 30.4% Renter occupiedHouse owners and renters - Hispanic or Latino residents 387 40.6% Owner occupied565 59.4% Renter occupied
Language usage in Vernon Hills
English speakers - Total 57.2% of residents of Vernon Hills speak English at home.
9.4% of residents speak Spanish at home 1,408 58.6% Speak English very well994 41.4% Speak English less than very well34.2% of residents speak other language at home 6,465 74.3% Speak English very well2,238 25.7% Speak English less than very well
English speakers - Born in the United States 90.8% of residents of Vernon Hills speak English at home.
1.9% of residents speak Spanish at home 55 80.9% Speak English very well13 19.1% Speak English less than very well6.8% of residents speak other language at home 220 88.7% Speak English very well28 11.3% Speak English less than very well
English speakers - Native, born elsewhere 65.6% of residents of Vernon Hills speak English at home.
5.4% of residents speak Spanish at home 11 52.4% Speak English very well10 47.6% Speak English less than very well29.7% of residents speak other language at home 116 100.0% Speak English very well
English speakers - Foreign-born 11.3% of residents of Vernon Hills speak English at home.
14.0% of residents speak Spanish at home 439 34.6% Speak English very well831 65.4% Speak English less than very well73.7% of residents speak other language at home 4,659 69.7% Speak English very well2,024 30.3% Speak English less than very well
White (Caucasian) - Speak only English Native:
91.7% (11,483)Foreign-born:
22.8% (543)
White (Caucasian) - Speak another language Native:
7.6% (947)Foreign-born:
75.6% (1,797)
Black or African American - Speak only English Native:
91.7% (289)Foreign-born:
61.3% (41)
Black or African American - Speak another language Native:
8.8% (28)Foreign-born:
38.6% (26)
American Indian / Alaska Native - Speak another language Native:
46.5% (17)Foreign-born:
100.0% (67)
Asian - Speak only English Native:
32.8% (542)Foreign-born:
6.7% (325)
Asian - Speak another language Native:
75.5% (1,247)Foreign-born:
93.6% (4,502)
Other race - Speak another language Native:
82.5% (352)Foreign-born:
94.8% (544)
Two or more races - Speak another language Native:
21.0% (283)Foreign-born:
100.0% (320)
White alone - Speak only English Native:
93.9% (11,222)Foreign-born:
20.4% (534)
White alone - Speak another language Native:
5.9% (706)Foreign-born:
79.0% (2,068)
Hispanic or Latino - Speak only English Native:
37.6% (662)Foreign-born:
2.3% (30)
Hispanic or Latino - Speak another language Native:
62.5% (1,102)Foreign-born:
95.8% (1,261)
Foreign-born residents in Vernon Hills 8,728 residents are foreign born (18.6% Asia , 8.1% Europe , 5.2% Latin America ).
This city:
32.8%Illinois:
14.1%
Marital status for residents in Vernon Hills Marital status - White (Caucasian) population 15 years and over
Males 34.8% Never married55.9% Now married0.9% Separated1.2% Widowed7.2% DivorcedFemales 28.2% Never married49.0% Now married0.4% Separated10.3% Widowed12.0% DivorcedWomen who gave birth in the past 12 months Now married:
90.4% (117)Unmarried:
9.6% (12)
Women who did not give birth in the past 12 months Now married:
40.5% (1,190)Unmarried:
59.5% (1,749)
Marital status - Black or African American population 15 years and over
Males 37.2% Never married62.8% Now married0.0% Separated0.0% Widowed0.0% DivorcedFemales 16.2% Never married71.7% Now married0.0% Separated12.1% Widowed0.0% DivorcedWomen who did not give birth in the past 12 months Now married:
77.1% (49)Unmarried:
22.9% (15)
Marital status - American Indian / Alaska Native population 15 years and over
Males 0.0% Never married100.0% Now married0.0% Separated0.0% Widowed0.0% DivorcedFemales 36.8% Never married63.2% Now married0.0% Separated0.0% Widowed0.0% DivorcedWomen who did not give birth in the past 12 months Now married:
63.2% (20)Unmarried:
36.8% (12)
Marital status - Asian population 15 years and over
Males 16.2% Never married81.3% Now married0.0% Separated1.2% Widowed1.4% DivorcedFemales 21.8% Never married67.9% Now married0.5% Separated3.4% Widowed6.3% DivorcedWomen who gave birth in the past 12 months Now married:
100.0% (64)Unmarried:
0.0% (0)
Women who did not give birth in the past 12 months Now married:
67.5% (1,289)Unmarried:
32.5% (621)
Marital status - Other race population 15 years and over
Males 26.5% Never married73.5% Now married0.0% Separated0.0% Widowed0.0% DivorcedFemales 37.8% Never married55.3% Now married6.8% Separated0.0% Widowed0.0% DivorcedWomen who gave birth in the past 12 months Now married:
100.0% (8)Unmarried:
0.0% (0)
Women who did not give birth in the past 12 months Now married:
47.3% (125)Unmarried:
52.7% (139)
Marital status - Two or more races population 15 years and over
Males 59.1% Never married33.6% Now married0.0% Separated3.6% Widowed3.6% DivorcedFemales 32.7% Never married47.5% Now married0.0% Separated2.1% Widowed17.7% DivorcedWomen who gave birth in the past 12 months Now married:
100.0% (44)Unmarried:
0.0% (0)
Women who did not give birth in the past 12 months Now married:
43.8% (243)Unmarried:
56.2% (312)
Marital status - White alone, not Hispanic / Latino population 15 years and over
Males 31.7% Never married58.9% Now married1.0% Separated1.4% Widowed7.1% DivorcedFemales 27.0% Never married49.9% Now married0.5% Separated11.0% Widowed11.7% DivorcedWomen who gave birth in the past 12 months Now married:
90.4% (125)Unmarried:
9.6% (13)
Women who did not give birth in the past 12 months Now married:
42.7% (1,154)Unmarried:
57.3% (1,547)
Marital status - Hispanic or Latino population 15 years and over
Males 50.1% Never married44.9% Now married0.0% Separated0.0% Widowed5.0% DivorcedFemales 38.8% Never married47.4% Now married2.2% Separated2.0% Widowed9.6% DivorcedWomen who did not give birth in the past 12 months Now married:
39.5% (342)Unmarried:
60.5% (525)
Ancestries in Vernon Hills
780 5.6% German748 5.4% Polish659 4.7% American520 3.7% English472 3.4% Russian448 3.2% Italian371 2.7% Ukrainian277 2.0% Irish236 1.7% Eastern European167 1.2% Romanian142 1.0% European118 0.8% Latvian106 0.8% Czech97 0.7% Greek81 0.6% Kenyan80 0.6% Swedish72 0.5% Lithuanian70 0.5% Norwegian59 0.4% Iranian52 0.4% Scandinavian38 0.3% Scottish38 0.3% Swiss37 0.3% British37 0.3% Nigerian37 0.3% Haitian35 0.3% Austrian32 0.2% Bulgarian27 0.2% Croatian26 0.2% Hungarian23 0.2% Turkish22 0.2% Armenian18 0.1% Iraqi18 0.1% Czechoslovakian14 0.1% Welsh13 0.09% Ethiopian12 0.09% Lebanese12 0.09% Slovak11 0.08% Dutch10 0.07% Portuguese7 0.05% Finnish7 0.05% Danish7 0.05% French6 0.04% Belgian6 0.04% Scotch-Irish
Geographical mobility in Vernon Hills Same house 1 year ago 13,676 89.2% White (Caucasian)400 94.6% Black or African American93 99.7% American Indian / Alaska Native5,704 82.5% Asian686 69.1% Other race1,726 79.8% Two or more races13,016 88.7% White alone, not Hispanic / Latino2,819 85.6% Hispanic or LatinoMoved within same county 912 5.9% White / Caucasian450 6.5% Asian155 15.6% Other race126 5.8% Two or more races979 6.7% White alone, not Hispanic / Latino217 6.6% Hispanic or LatinoMoved within same state 377 2.5% White / Caucasian15 3.5% Black or African American415 6.0% Asian21 2.1% Other race140 6.5% Two or more races334 2.3% White alone, not Hispanic / Latino80 2.4% Hispanic or LatinoMoved from different state 220 1.4% White / Caucasian15 3.6% Black or African American84 1.2% Asian40 4.1% Other race82 3.8% Two or more races235 1.6% White alone, not Hispanic / Latino54 1.6% Hispanic or LatinoMoved from abroad 138 0.9% White228 3.3% Asian61 6.2% Other race33 0.2% White alone, not Hispanic / Latino118 3.6% Hispanic or Latino
Children Nativity (place of birth) in Vernon Hills
Children under 6 years - Living with two parents Both parents native 661 100.0% NativeBoth parents foreign-born 356 89.4% Native42 10.6% Foreign-bornOne native, one foreign-born parent 95 100.0% NativeChildren under 6 years - Living with one parent Native parent 160 100.0% NativeForeign-born parent 74 100.0% NativeChildren 6 to 17 years - Living with two parents Both parents native 1,332 99.9% Native2 0.1% Foreign-bornBoth parents foreign-born 1,258 57.7% Native922 42.3% Foreign-bornOne native, one foreign-born parent 437 94.8% Native24 5.2% Foreign-bornChildren 6 to 17 years - Living with one parent Native parent 458 100.0% NativeForeign-born parent 667 54.3% Native563 45.7% Foreign-born
Place of birth for residents in Vernon Hills 4,982 Asia2,448 South Central Asia2,162 Europe1,913 Eastern Europe1,773 Eastern Asia1,478 Americas1,387 Latin America1,089 Central America1,057 China554 South Eastern Asia250 South America206 Western Asia124 Western Europe104 Africa91 Northern America79 Northern Europe70 Eastern Africa47 Caribbean45 Southern Europe34 Northern Africa2,144 India1,000 Mexico802 China518 Korea506 Ukraine475 Philippines450 Russia364 Belarus246 Taiwan245 Pakistan244 Poland125 Brazil113 Latvia100 Germany91 Canada64 Lithuania62 United Kingdom57 Japan51 Israel48 Iran44 Turkey42 Honduras39 Kenya39 Romania38 Saudi Arabia38 Dominican Republic37 Thailand34 Italy34 Egypt34 Argentina32 Bulgaria32 Colombia31 Ecuador28 Iraq27 Azerbaijan26 Ethiopia25 El Salvador24 France23 Indonesia23 Serbia21 Guatemala19 Vietnam18 Kuwait18 Venezuela17 England16 Moldova10 Uzbekistan10 Peru9 Cuba8 Hong Kong7 Portugal4 Greece
Grandparents responsible for own grandchildren in Vernon Hills
Grandparents (30 to 59 years) Black or African American 28 100.0% Not responsible for grandchildren
Grandparents (60 years and over)