Races in Ventnor City, New Jersey (NJ) Detailed Stats
Data:
Races - White alone (%)
Races - White alone (% change since 2000)
Races - Black alone (%)
Races - Black alone (% change since 2000)
Races - American Indian alone (%)
Races - American Indian alone (% change since 2000)
Races - Asian alone (%)
Races - Asian alone (% change since 2000)
Races - Hispanic (%)
Races - Hispanic (% change since 2000)
Races - Native Hawaiian and Other Pacific Islander alone (%)
Races - Native Hawaiian and Other Pacific Islander alone (% change since 2000)
Races - Two or more races(%)
Races - Two or more races(% change since 2000)
Races - Other race alone (%)
Races - Other race alone (% change since 2000)
Racial diversity
Place of birth - Born in state of residence (%)
Place of birth - Born in state of residence (%) - White
Place of birth - Born in state of residence (%) - Black or African American
Place of birth - Born in state of residence (%) - Asian
Place of birth - Born in state of residence (%) - Hispanic or Latino
Place of birth - Born in state of residence (%) - American Indian and Alaska Native
Place of birth - Born in state of residence (%) - Multirace
Place of birth - Born in state of residence (%) - Other Race
Place of birth - Born in other state (%)
Place of birth - Born in other state (%) - White
Place of birth - Born in other state (%) - Black or African American
Place of birth - Born in other state (%) - Asian
Place of birth - Born in other state (%) - Hispanic or Latino
Place of birth - Born in other state (%) - American Indian and Alaska Native
Place of birth - Born in other state (%) - Multirace
Place of birth - Born in other state (%) - Other Race
Place of birth - Native, outside of US (%)
Place of birth - Native, outside of US (%) - White
Place of birth - Native, outside of US (%) - Black or African American
Place of birth - Native, outside of US (%) - Asian
Place of birth - Native, outside of US (%) - Hispanic or Latino
Place of birth - Native, outside of US (%) - American Indian and Alaska Native
Place of birth - Native, outside of US (%) - Multirace
Place of birth - Native, outside of US (%) - Other Race
Place of birth - Foreign born (%)
Place of birth - Foreign born (%) - White
Place of birth - Foreign born (%) - Black or African American
Place of birth - Foreign born (%) - Asian
Place of birth - Foreign born (%) - Hispanic or Latino
Place of birth - Foreign born (%) - American Indian and Alaska Native
Place of birth - Foreign born (%) - Multirace
Place of birth - Foreign born (%) - Other Race
Residents speaking English at home (%)
Residents speaking English at home - Born in the United States (%)
Residents speaking English at home - Native, born elsewhere (%)
Residents speaking English at home - Foreign born (%)
Residents speaking Spanish at home (%)
Residents speaking Spanish at home - Born in the United States (%)
Residents speaking Spanish at home - Native, born elsewhere (%)
Residents speaking Spanish at home - Foreign born (%)
Residents speaking other language at home (%)
Residents speaking other language at home - Born in the United States (%)
Residents speaking other language at home - Native, born elsewhere (%)
Residents speaking other language at home - Foreign born (%)
Marital status - Never married (%)
Marital status - Now married (%)
Marital status - Separated (%)
Marital status - Widowed (%)
Marital status - Divorced (%)
Ancestries Reported - Arab (%)
Ancestries Reported - Czech (%)
Ancestries Reported - Danish (%)
Ancestries Reported - Dutch (%)
Ancestries Reported - English (%)
Ancestries Reported - French (%)
Ancestries Reported - French Canadian (%)
Ancestries Reported - German (%)
Ancestries Reported - Greek (%)
Ancestries Reported - Hungarian (%)
Ancestries Reported - Irish (%)
Ancestries Reported - Italian (%)
Ancestries Reported - Lithuanian (%)
Ancestries Reported - Norwegian (%)
Ancestries Reported - Polish (%)
Ancestries Reported - Portuguese (%)
Ancestries Reported - Russian (%)
Ancestries Reported - Scotch-Irish (%)
Ancestries Reported - Scottish (%)
Ancestries Reported - Slovak (%)
Ancestries Reported - Subsaharan African (%)
Ancestries Reported - Swedish (%)
Ancestries Reported - Swiss (%)
Ancestries Reported - Ukrainian (%)
Ancestries Reported - United States (%)
Ancestries Reported - Welsh (%)
Ancestries Reported - West Indian (%)
Ancestries Reported - Other (%)
Geographical mobility - Same house 1 year ago (%)
Geographical mobility - Same house 1 year ago (%) - White
Geographical mobility - Same house 1 year ago (%) - Black or African American
Geographical mobility - Same house 1 year ago (%) - Asian
Geographical mobility - Same house 1 year ago (%) - Hispanic or Latino
Geographical mobility - Same house 1 year ago (%) - American Indian and Alaska Native
Geographical mobility - Same house 1 year ago (%) - Multirace
Geographical mobility - Same house 1 year ago (%) - Other Race
Geographical mobility - Moved within same county (%)
Geographical mobility - Moved within same county (%) - White
Geographical mobility - Moved within same county (%) - Black or African American
Geographical mobility - Moved within same county (%) - Asian
Geographical mobility - Moved within same county (%) - Hispanic or Latino
Geographical mobility - Moved within same county (%) - American Indian and Alaska Native
Geographical mobility - Moved within same county (%) - Multirace
Geographical mobility - Moved within same county (%) - Other Race
Geographical mobility - Moved from different county within same state (%)
Geographical mobility - Moved from different county within same state (%) - White
Geographical mobility - Moved from different county within same state (%) - Black or African American
Geographical mobility - Moved from different county within same state (%) - Asian
Geographical mobility - Moved from different county within same state (%) - Hispanic or Latino
Geographical mobility - Moved from different county within same state (%) - American Indian and Alaska Native
Geographical mobility - Moved from different county within same state (%) - Multirace
Geographical mobility - Moved from different county within same state (%) - Other Race
Geographical mobility - Moved from different state (%)
Geographical mobility - Moved from different state (%) - White
Geographical mobility - Moved from different state (%) - Black or African American
Geographical mobility - Moved from different state (%) - Asian
Geographical mobility - Moved from different state (%) - Hispanic or Latino
Geographical mobility - Moved from different state (%) - American Indian and Alaska Native
Geographical mobility - Moved from different state (%) - Multirace
Geographical mobility - Moved from different state (%) - Other Race
Geographical mobility - Moved from abroad (%)
Geographical mobility - Moved from abroad (%) - White
Geographical mobility - Moved from abroad (%) - Black or African American
Geographical mobility - Moved from abroad (%) - Asian
Geographical mobility - Moved from abroad (%) - Hispanic or Latino
Geographical mobility - Moved from abroad (%) - American Indian and Alaska Native
Geographical mobility - Moved from abroad (%) - Multirace
Geographical mobility - Moved from abroad (%) - Other Race
Place of birth for the foreign-born population - Ireland (%)
Place of birth for the foreign-born population - Denmark (%)
Place of birth for the foreign-born population - Norway (%)
Place of birth for the foreign-born population - Sweden (%)
Place of birth for the foreign-born population - United Kingdom (%)
Place of birth for the foreign-born population - England (%)
Place of birth for the foreign-born population - Scotland (%)
Place of birth for the foreign-born population - Other Northern Europe (%)
Place of birth for the foreign-born population - Austria (%)
Place of birth for the foreign-born population - Belgium (%)
Place of birth for the foreign-born population - France (%)
Place of birth for the foreign-born population - Germany (%)
Place of birth for the foreign-born population - Netherlands (%)
Place of birth for the foreign-born population - Switzerland (%)
Place of birth for the foreign-born population - Other Western Europe (%)
Place of birth for the foreign-born population - Greece (%)
Place of birth for the foreign-born population - Italy (%)
Place of birth for the foreign-born population - Portugal (%)
Place of birth for the foreign-born population - Spain (%)
Place of birth for the foreign-born population - Other Southern Europe (%)
Place of birth for the foreign-born population - Albania (%)
Place of birth for the foreign-born population - Belarus (%)
Place of birth for the foreign-born population - Bosnia and Herzegovina (%)
Place of birth for the foreign-born population - Bulgaria (%)
Place of birth for the foreign-born population - Croatia (%)
Place of birth for the foreign-born population - Czechoslovakia (%)
Place of birth for the foreign-born population - Hungary (%)
Place of birth for the foreign-born population - Latvia (%)
Place of birth for the foreign-born population - Lithuania (%)
Place of birth for the foreign-born population - North Macedonia (Macedonia) (%)
Place of birth for the foreign-born population - Moldova (%)
Place of birth for the foreign-born population - Poland (%)
Place of birth for the foreign-born population - Romania (%)
Place of birth for the foreign-born population - Russia (%)
Place of birth for the foreign-born population - Serbia (%)
Place of birth for the foreign-born population - Ukraine (%)
Place of birth for the foreign-born population - Other Eastern Europe (%)
Place of birth for the foreign-born population - China (%)
Place of birth for the foreign-born population - Hong Kong (%)
Place of birth for the foreign-born population - Taiwan (%)
Place of birth for the foreign-born population - Japan (%)
Place of birth for the foreign-born population - Korea (%)
Place of birth for the foreign-born population - Other Eastern Asia (%)
Place of birth for the foreign-born population - Afghanistan (%)
Place of birth for the foreign-born population - Bangladesh (%)
Place of birth for the foreign-born population - India (%)
Place of birth for the foreign-born population - Iran (%)
Place of birth for the foreign-born population - Kazakhstan (%)
Place of birth for the foreign-born population - Nepal (%)
Place of birth for the foreign-born population - Pakistan (%)
Place of birth for the foreign-born population - Sri Lanka (%)
Place of birth for the foreign-born population - Uzbekistan (%)
Place of birth for the foreign-born population - Other South Central Asia (%)
Place of birth for the foreign-born population - Burma (%)
Place of birth for the foreign-born population - Cambodia (%)
Place of birth for the foreign-born population - Indonesia (%)
Place of birth for the foreign-born population - Laos (%)
Place of birth for the foreign-born population - Malaysia (%)
Place of birth for the foreign-born population - Philippines (%)
Place of birth for the foreign-born population - Singapore (%)
Place of birth for the foreign-born population - Thailand (%)
Place of birth for the foreign-born population - Vietnam (%)
Place of birth for the foreign-born population - Other South Eastern Asia (%)
Place of birth for the foreign-born population - Armenia (%)
Place of birth for the foreign-born population - Iraq (%)
Place of birth for the foreign-born population - Israel (%)
Place of birth for the foreign-born population - Jordan (%)
Place of birth for the foreign-born population - Kuwait (%)
Place of birth for the foreign-born population - Lebanon (%)
Place of birth for the foreign-born population - Saudi Arabia (%)
Place of birth for the foreign-born population - Syria (%)
Place of birth for the foreign-born population - Turkey (%)
Place of birth for the foreign-born population - Yemen (%)
Place of birth for the foreign-born population - Other Western Asia (%)
Place of birth for the foreign-born population - Eritrea (%)
Place of birth for the foreign-born population - Ethiopia (%)
Place of birth for the foreign-born population - Kenya (%)
Place of birth for the foreign-born population - Somalia (%)
Place of birth for the foreign-born population - Uganda (%)
Place of birth for the foreign-born population - Zimbabwe (%)
Place of birth for the foreign-born population - Other Eastern Africa (%)
Place of birth for the foreign-born population - Cameroon (%)
Place of birth for the foreign-born population - Congo (%)
Place of birth for the foreign-born population - Democratic Republic of Congo (Zaire) (%)
Place of birth for the foreign-born population - Other Middle Africa (%)
Place of birth for the foreign-born population - Egypt (%)
Place of birth for the foreign-born population - Morocco (%)
Place of birth for the foreign-born population - Sudan (%)
Place of birth for the foreign-born population - Other Northern Africa (%)
Place of birth for the foreign-born population - South Africa (%)
Place of birth for the foreign-born population - Other Southern Africa (%)
Place of birth for the foreign-born population - Cabo Verde (%)
Place of birth for the foreign-born population - Ghana (%)
Place of birth for the foreign-born population - Liberia (%)
Place of birth for the foreign-born population - Nigeria (%)
Place of birth for the foreign-born population - Senegal (%)
Place of birth for the foreign-born population - Sierra Leone (%)
Place of birth for the foreign-born population - Other Western Africa (%)
Place of birth for the foreign-born population - Australia (%)
Place of birth for the foreign-born population - New Zealand (%)
Place of birth for the foreign-born population - Fiji (%)
Place of birth for the foreign-born population - Micronesia (%)
Place of birth for the foreign-born population - Bahamas (%)
Place of birth for the foreign-born population - Barbados (%)
Place of birth for the foreign-born population - Cuba (%)
Place of birth for the foreign-born population - Dominica (%)
Place of birth for the foreign-born population - Dominican Republic (%)
Place of birth for the foreign-born population - Grenada (%)
Place of birth for the foreign-born population - Haiti (%)
Place of birth for the foreign-born population - Jamaica (%)
Place of birth for the foreign-born population - St. Vincent and the Grenadines (%)
Place of birth for the foreign-born population - Trinidad and Tobago (%)
Place of birth for the foreign-born population - West Indies (%)
Place of birth for the foreign-born population - Other Caribbean (%)
Place of birth for the foreign-born population - Belize (%)
Place of birth for the foreign-born population - Costa Rica (%)
Place of birth for the foreign-born population - El Salvador (%)
Place of birth for the foreign-born population - Guatemala (%)
Place of birth for the foreign-born population - Honduras (%)
Place of birth for the foreign-born population - Mexico (%)
Place of birth for the foreign-born population - Nicaragua (%)
Place of birth for the foreign-born population - Panama (%)
Place of birth for the foreign-born population - Other Central America (%)
Place of birth for the foreign-born population - Argentina (%)
Place of birth for the foreign-born population - Bolivia (%)
Place of birth for the foreign-born population - Brazil (%)
Place of birth for the foreign-born population - Chile (%)
Place of birth for the foreign-born population - Colombia (%)
Place of birth for the foreign-born population - Ecuador (%)
Place of birth for the foreign-born population - Guyana (%)
Place of birth for the foreign-born population - Peru (%)
Place of birth for the foreign-born population - Uruguay (%)
Place of birth for the foreign-born population - Venezuela (%)
Place of birth for the foreign-born population - Other South America (%)
Place of birth for the foreign-born population - Canada (%)
Place of birth for the foreign-born population - Other Northern America (%)
Place of birth for the foreign-born population - Other (%)
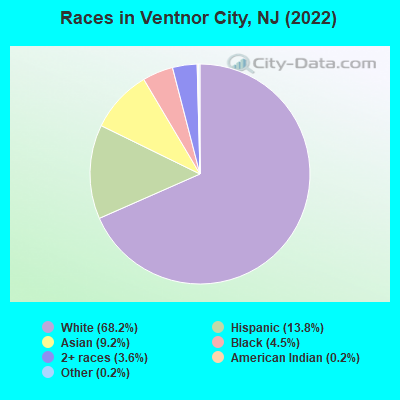
According to 2022 data, the most numerous races in Ventnor City, NJ are White alone (6,361 residents), Hispanic (1,283 residents), and Black alone (417 residents). 77.8% of Ventnor City residents speak English at home. 20.3% of Ventnor City, NJ residents are foreign-born (7.3% born in Asia, 6.0% born in Europe, 5.8% born in Latin America), which is 13.5% less than the foreign-born rate of 23.0% across the entire state of New Jersey.
Race distribution in Ventnor City
2000 2022
5,557,209 66.0% White alone 1,117,191 13.3% Hispanic 1,096,171 13.0% Black alone 477,012 5.7% Asian alone 133,689 1.6% Two or more races 19,565 0.2% Other race alone 11,338 0.1% American Indian alone 2,175 0.03% Native Hawaiian and Other
4,766,476 51.5% White alone 2,028,470 21.9% Hispanic 1,111,632 12.0% Black alone 923,546 10.0% Asian alone 332,237 3.6% Two or more races 89,847 1.0% Other race alone 8,557 0.09% American Indian alone 934 0.01% Native Hawaiian and Other
Income and house value in Ventnor City Median household income in 2022 $71,086 White non-Hispanic householders$117,260 Black householders$58,543 Asian householders$95,383 Hispanic or Latino race householdersMedian 2022 house value $365,050 White Non-Hispanic householders$382,579 Black or African American householders$264,327 American Indian or Alaska Native householders $373,675 Asian householders$282,413 Some other race householders$336,113 Two or more races householders$294,377 Hispanic or Latino householders
Median age by race in Ventnor City
59.8 Median age for White residents56.6 62.4 26.3 Median age for Black or African American residents24.4 17.6 -650,046,167.4 Median age for American Indian / Alaska Native residents-590,299,277.0 -877,192,981.6 53.6 Median age for Asian residents38.3 66.1 -804,177,544.9 Median age for Native Hawaiian / Pacific Islander residents-860,335,194.7 -713,070,378.3 26.1 Median age for Other race residents39.3 25.0 37.6 Median age for Two or more races residents34.5 29.6 60.3 Median age for White alone residents58.1 60.8 32.7 Median age for Hispanic or Latino residents31.3 33.9
Owner/renter occupied households by race in Ventnor City
House owners and renters - White residents 2,397 70.6% Owner occupied999 29.4% Renter occupiedHouse owners and renters - Black or African American residents 31 16.5% Owner occupied156 83.5% Renter occupiedHouse owners and renters - Asian residents 195 78.3% Owner occupied54 21.7% Renter occupiedHouse owners and renters - Other race residents 21 46.7% Owner occupied24 53.3% Renter occupiedHouse owners and renters - Two or more races residents 216 60.9% Owner occupied138 39.1% Renter occupiedHouse owners and renters - White alone residents 2,404 71.2% Owner occupied971 28.8% Renter occupiedHouse owners and renters - Hispanic or Latino residents 117 34.8% Owner occupied220 65.2% Renter occupied
Language usage in Ventnor City
English speakers - Total 77.8% of residents of Ventnor City speak English at home.
8.3% of residents speak Spanish at home 389 50.9% Speak English very well375 49.1% Speak English less than very well14.5% of residents speak other language at home 761 57.5% Speak English very well563 42.5% Speak English less than very well
English speakers - Born in the United States 94.9% of residents of Ventnor City speak English at home.
2.4% of residents speak Spanish at home 55 69.6% Speak English very well24 30.4% Speak English less than very well3.1% of residents speak other language at home 104 100.0% Speak English very well
English speakers - Native, born elsewhere 67.4% of residents of Ventnor City speak English at home.
5.7% of residents speak Spanish at home 4 30.8% Speak English very well9 69.2% Speak English less than very well31.3% of residents speak other language at home 66 91.7% Speak English very well6 8.3% Speak English less than very well
English speakers - Foreign-born 27.1% of residents of Ventnor City speak English at home.
22.7% of residents speak Spanish at home 97 24.9% Speak English very well293 75.1% Speak English less than very well52.2% of residents speak other language at home 388 43.3% Speak English very well508 56.7% Speak English less than very well
White (Caucasian) - Speak only English Native:
98.3% (5,420)Foreign-born:
35.6% (249)
White (Caucasian) - Speak another language Native:
2.6% (143)Foreign-born:
66.7% (466)
Black or African American - Speak another language Native:
2.3% (11)Foreign-born:
100.0% (5)
Asian - Speak only English Native:
18.9% (64)Foreign-born:
18.9% (106)
Asian - Speak another language Native:
84.5% (285)Foreign-born:
82.1% (461)
Other race - Speak another language Native:
26.7% (48)Foreign-born:
97.5% (47)
Two or more races - Speak only English Native:
62.7% (461)Foreign-born:
40.7% (69)
Two or more races - Speak another language Native:
37.5% (276)Foreign-born:
69.9% (119)
White alone - Speak only English Native:
97.7% (5,380)Foreign-born:
35.0% (261)
White alone - Speak another language Native:
2.3% (128)Foreign-born:
59.4% (443)
Hispanic or Latino - Speak only English Native:
60.2% (481)Foreign-born:
17.7% (79)
Hispanic or Latino - Speak another language Native:
44.8% (357)Foreign-born:
88.5% (397)
Foreign-born residents in Ventnor City 1,890 residents are foreign born (7.3% Asia , 6.0% Europe , 5.8% Latin America ).
This city:
20.3%New Jersey:
23.2%
Marital status for residents in Ventnor City Marital status - White (Caucasian) population 15 years and over
Males 32.4% Never married48.2% Now married1.2% Separated4.3% Widowed13.9% DivorcedFemales 19.3% Never married47.5% Now married1.7% Separated20.3% Widowed11.3% DivorcedWomen who gave birth in the past 12 months Now married:
55.6% (36)Unmarried:
44.4% (29)
Women who did not give birth in the past 12 months Now married:
43.2% (355)Unmarried:
56.8% (466)
Marital status - Black or African American population 15 years and over
Males 91.2% Never married2.2% Now married0.0% Separated0.0% Widowed6.6% DivorcedFemales 75.0% Never married0.0% Now married0.0% Separated13.6% Widowed11.4% DivorcedWomen who did not give birth in the past 12 months Now married:
0.0% (0)Unmarried:
100.0% (89)
Marital status - Asian population 15 years and over
Males 42.8% Never married51.7% Now married0.0% Separated5.5% Widowed0.0% DivorcedFemales 16.3% Never married57.9% Now married0.0% Separated21.9% Widowed3.9% DivorcedWomen who gave birth in the past 12 months Now married:
100.0% (16)Unmarried:
0.0% (0)
Women who did not give birth in the past 12 months Now married:
41.2% (45)Unmarried:
58.8% (64)
Marital status - Other race population 15 years and over
Males 44.9% Never married27.0% Now married9.0% Separated0.0% Widowed19.1% DivorcedFemales 72.0% Never married21.3% Now married0.0% Separated6.7% Widowed0.0% DivorcedWomen who did not give birth in the past 12 months Now married:
21.3% (20)Unmarried:
78.7% (72)
Marital status - Two or more races population 15 years and over
Males 46.6% Never married35.9% Now married0.0% Separated0.0% Widowed17.5% DivorcedFemales 45.7% Never married31.5% Now married0.0% Separated11.7% Widowed11.0% DivorcedWomen who did not give birth in the past 12 months Now married:
16.8% (40)Unmarried:
83.2% (199)
Marital status - White alone, not Hispanic / Latino population 15 years and over
Males 29.3% Never married50.7% Now married1.3% Separated4.8% Widowed14.0% DivorcedFemales 18.8% Never married47.4% Now married1.8% Separated21.3% Widowed10.8% DivorcedWomen who gave birth in the past 12 months Now married:
55.6% (39)Unmarried:
44.4% (31)
Women who did not give birth in the past 12 months Now married:
41.7% (312)Unmarried:
58.3% (437)
Marital status - Hispanic or Latino population 15 years and over
Males 52.2% Never married30.8% Now married1.5% Separated0.0% Widowed15.5% DivorcedFemales 44.1% Never married38.0% Now married0.0% Separated5.0% Widowed12.9% DivorcedWomen who did not give birth in the past 12 months Now married:
31.8% (118)Unmarried:
68.2% (254)
Ancestries in Ventnor City
976 20.2% Italian517 10.7% Irish359 7.4% German162 3.3% Russian138 2.9% Polish134 2.8% American73 1.5% Eastern European65 1.3% Afghan49 1.0% European47 1.0% Ukrainian31 0.6% English28 0.6% Greek24 0.5% Croatian24 0.5% Hungarian23 0.5% Brazilian19 0.4% Egyptian19 0.4% Pennsylvania German18 0.4% Romanian17 0.4% Turkish15 0.3% French10 0.2% Armenian10 0.2% Dutch8 0.2% Scottish8 0.2% Swedish7 0.1% British6 0.1% Lithuanian5 0.1% Portuguese5 0.1% African4 0.08% Austrian
Children Nativity (place of birth) in Ventnor City
Children under 6 years - Living with two parents Both parents native 151 100.0% NativeBoth parents foreign-born 17 100.0% NativeOne native, one foreign-born parent 5 100.0% NativeChildren under 6 years - Living with one parent Native parent 60 100.0% NativeForeign-born parent 14 100.0% NativeChildren 6 to 17 years - Living with two parents Both parents native 382 100.0% NativeBoth parents foreign-born 70 70.0% Native30 30.0% Foreign-bornOne native, one foreign-born parent 28 100.0% NativeChildren 6 to 17 years - Living with one parent Native parent 241 93.0% Native18 7.0% Foreign-bornForeign-born parent 162 69.7% Native70 30.3% Foreign-born
Grandparents responsible for own grandchildren in Ventnor City
Grandparents (30 to 59 years) White / Caucasian 6 100.0% Not responsible for grandchildrenAsian 32 100.0% Not responsible for grandchildrenWhite alone, not Hispanic / Latino 8 100.0% Not responsible for grandchildrenGrandparents (60 years and over) White / Caucasian 15 100.0% Not responsible for grandchildrenAsian 37 57.5% Responsible for grandchildren27 42.5% Not responsible for grandchildrenWhite alone, not Hispanic / Latino 16 100.0% Not responsible for grandchildren