Races in Urbana, Maryland (MD) Detailed Stats
Data:
Races - White alone (%)
Races - White alone (% change since 2000)
Races - Black alone (%)
Races - Black alone (% change since 2000)
Races - American Indian alone (%)
Races - American Indian alone (% change since 2000)
Races - Asian alone (%)
Races - Asian alone (% change since 2000)
Races - Hispanic (%)
Races - Hispanic (% change since 2000)
Races - Native Hawaiian and Other Pacific Islander alone (%)
Races - Native Hawaiian and Other Pacific Islander alone (% change since 2000)
Races - Two or more races(%)
Races - Two or more races(% change since 2000)
Races - Other race alone (%)
Races - Other race alone (% change since 2000)
Racial diversity
Place of birth - Born in state of residence (%)
Place of birth - Born in state of residence (%) - White
Place of birth - Born in state of residence (%) - Black or African American
Place of birth - Born in state of residence (%) - Asian
Place of birth - Born in state of residence (%) - Hispanic or Latino
Place of birth - Born in state of residence (%) - American Indian and Alaska Native
Place of birth - Born in state of residence (%) - Multirace
Place of birth - Born in state of residence (%) - Other Race
Place of birth - Born in other state (%)
Place of birth - Born in other state (%) - White
Place of birth - Born in other state (%) - Black or African American
Place of birth - Born in other state (%) - Asian
Place of birth - Born in other state (%) - Hispanic or Latino
Place of birth - Born in other state (%) - American Indian and Alaska Native
Place of birth - Born in other state (%) - Multirace
Place of birth - Born in other state (%) - Other Race
Place of birth - Native, outside of US (%)
Place of birth - Native, outside of US (%) - White
Place of birth - Native, outside of US (%) - Black or African American
Place of birth - Native, outside of US (%) - Asian
Place of birth - Native, outside of US (%) - Hispanic or Latino
Place of birth - Native, outside of US (%) - American Indian and Alaska Native
Place of birth - Native, outside of US (%) - Multirace
Place of birth - Native, outside of US (%) - Other Race
Place of birth - Foreign born (%)
Place of birth - Foreign born (%) - White
Place of birth - Foreign born (%) - Black or African American
Place of birth - Foreign born (%) - Asian
Place of birth - Foreign born (%) - Hispanic or Latino
Place of birth - Foreign born (%) - American Indian and Alaska Native
Place of birth - Foreign born (%) - Multirace
Place of birth - Foreign born (%) - Other Race
Residents speaking English at home (%)
Residents speaking English at home - Born in the United States (%)
Residents speaking English at home - Native, born elsewhere (%)
Residents speaking English at home - Foreign born (%)
Residents speaking Spanish at home (%)
Residents speaking Spanish at home - Born in the United States (%)
Residents speaking Spanish at home - Native, born elsewhere (%)
Residents speaking Spanish at home - Foreign born (%)
Residents speaking other language at home (%)
Residents speaking other language at home - Born in the United States (%)
Residents speaking other language at home - Native, born elsewhere (%)
Residents speaking other language at home - Foreign born (%)
Marital status - Never married (%)
Marital status - Now married (%)
Marital status - Separated (%)
Marital status - Widowed (%)
Marital status - Divorced (%)
Ancestries Reported - Arab (%)
Ancestries Reported - Czech (%)
Ancestries Reported - Danish (%)
Ancestries Reported - Dutch (%)
Ancestries Reported - English (%)
Ancestries Reported - French (%)
Ancestries Reported - French Canadian (%)
Ancestries Reported - German (%)
Ancestries Reported - Greek (%)
Ancestries Reported - Hungarian (%)
Ancestries Reported - Irish (%)
Ancestries Reported - Italian (%)
Ancestries Reported - Lithuanian (%)
Ancestries Reported - Norwegian (%)
Ancestries Reported - Polish (%)
Ancestries Reported - Portuguese (%)
Ancestries Reported - Russian (%)
Ancestries Reported - Scotch-Irish (%)
Ancestries Reported - Scottish (%)
Ancestries Reported - Slovak (%)
Ancestries Reported - Subsaharan African (%)
Ancestries Reported - Swedish (%)
Ancestries Reported - Swiss (%)
Ancestries Reported - Ukrainian (%)
Ancestries Reported - United States (%)
Ancestries Reported - Welsh (%)
Ancestries Reported - West Indian (%)
Ancestries Reported - Other (%)
Geographical mobility - Same house 1 year ago (%)
Geographical mobility - Same house 1 year ago (%) - White
Geographical mobility - Same house 1 year ago (%) - Black or African American
Geographical mobility - Same house 1 year ago (%) - Asian
Geographical mobility - Same house 1 year ago (%) - Hispanic or Latino
Geographical mobility - Same house 1 year ago (%) - American Indian and Alaska Native
Geographical mobility - Same house 1 year ago (%) - Multirace
Geographical mobility - Same house 1 year ago (%) - Other Race
Geographical mobility - Moved within same county (%)
Geographical mobility - Moved within same county (%) - White
Geographical mobility - Moved within same county (%) - Black or African American
Geographical mobility - Moved within same county (%) - Asian
Geographical mobility - Moved within same county (%) - Hispanic or Latino
Geographical mobility - Moved within same county (%) - American Indian and Alaska Native
Geographical mobility - Moved within same county (%) - Multirace
Geographical mobility - Moved within same county (%) - Other Race
Geographical mobility - Moved from different county within same state (%)
Geographical mobility - Moved from different county within same state (%) - White
Geographical mobility - Moved from different county within same state (%) - Black or African American
Geographical mobility - Moved from different county within same state (%) - Asian
Geographical mobility - Moved from different county within same state (%) - Hispanic or Latino
Geographical mobility - Moved from different county within same state (%) - American Indian and Alaska Native
Geographical mobility - Moved from different county within same state (%) - Multirace
Geographical mobility - Moved from different county within same state (%) - Other Race
Geographical mobility - Moved from different state (%)
Geographical mobility - Moved from different state (%) - White
Geographical mobility - Moved from different state (%) - Black or African American
Geographical mobility - Moved from different state (%) - Asian
Geographical mobility - Moved from different state (%) - Hispanic or Latino
Geographical mobility - Moved from different state (%) - American Indian and Alaska Native
Geographical mobility - Moved from different state (%) - Multirace
Geographical mobility - Moved from different state (%) - Other Race
Geographical mobility - Moved from abroad (%)
Geographical mobility - Moved from abroad (%) - White
Geographical mobility - Moved from abroad (%) - Black or African American
Geographical mobility - Moved from abroad (%) - Asian
Geographical mobility - Moved from abroad (%) - Hispanic or Latino
Geographical mobility - Moved from abroad (%) - American Indian and Alaska Native
Geographical mobility - Moved from abroad (%) - Multirace
Geographical mobility - Moved from abroad (%) - Other Race
Place of birth for the foreign-born population - Ireland (%)
Place of birth for the foreign-born population - Denmark (%)
Place of birth for the foreign-born population - Norway (%)
Place of birth for the foreign-born population - Sweden (%)
Place of birth for the foreign-born population - United Kingdom (%)
Place of birth for the foreign-born population - England (%)
Place of birth for the foreign-born population - Scotland (%)
Place of birth for the foreign-born population - Other Northern Europe (%)
Place of birth for the foreign-born population - Austria (%)
Place of birth for the foreign-born population - Belgium (%)
Place of birth for the foreign-born population - France (%)
Place of birth for the foreign-born population - Germany (%)
Place of birth for the foreign-born population - Netherlands (%)
Place of birth for the foreign-born population - Switzerland (%)
Place of birth for the foreign-born population - Other Western Europe (%)
Place of birth for the foreign-born population - Greece (%)
Place of birth for the foreign-born population - Italy (%)
Place of birth for the foreign-born population - Portugal (%)
Place of birth for the foreign-born population - Spain (%)
Place of birth for the foreign-born population - Other Southern Europe (%)
Place of birth for the foreign-born population - Albania (%)
Place of birth for the foreign-born population - Belarus (%)
Place of birth for the foreign-born population - Bosnia and Herzegovina (%)
Place of birth for the foreign-born population - Bulgaria (%)
Place of birth for the foreign-born population - Croatia (%)
Place of birth for the foreign-born population - Czechoslovakia (%)
Place of birth for the foreign-born population - Hungary (%)
Place of birth for the foreign-born population - Latvia (%)
Place of birth for the foreign-born population - Lithuania (%)
Place of birth for the foreign-born population - North Macedonia (Macedonia) (%)
Place of birth for the foreign-born population - Moldova (%)
Place of birth for the foreign-born population - Poland (%)
Place of birth for the foreign-born population - Romania (%)
Place of birth for the foreign-born population - Russia (%)
Place of birth for the foreign-born population - Serbia (%)
Place of birth for the foreign-born population - Ukraine (%)
Place of birth for the foreign-born population - Other Eastern Europe (%)
Place of birth for the foreign-born population - China (%)
Place of birth for the foreign-born population - Hong Kong (%)
Place of birth for the foreign-born population - Taiwan (%)
Place of birth for the foreign-born population - Japan (%)
Place of birth for the foreign-born population - Korea (%)
Place of birth for the foreign-born population - Other Eastern Asia (%)
Place of birth for the foreign-born population - Afghanistan (%)
Place of birth for the foreign-born population - Bangladesh (%)
Place of birth for the foreign-born population - India (%)
Place of birth for the foreign-born population - Iran (%)
Place of birth for the foreign-born population - Kazakhstan (%)
Place of birth for the foreign-born population - Nepal (%)
Place of birth for the foreign-born population - Pakistan (%)
Place of birth for the foreign-born population - Sri Lanka (%)
Place of birth for the foreign-born population - Uzbekistan (%)
Place of birth for the foreign-born population - Other South Central Asia (%)
Place of birth for the foreign-born population - Burma (%)
Place of birth for the foreign-born population - Cambodia (%)
Place of birth for the foreign-born population - Indonesia (%)
Place of birth for the foreign-born population - Laos (%)
Place of birth for the foreign-born population - Malaysia (%)
Place of birth for the foreign-born population - Philippines (%)
Place of birth for the foreign-born population - Singapore (%)
Place of birth for the foreign-born population - Thailand (%)
Place of birth for the foreign-born population - Vietnam (%)
Place of birth for the foreign-born population - Other South Eastern Asia (%)
Place of birth for the foreign-born population - Armenia (%)
Place of birth for the foreign-born population - Iraq (%)
Place of birth for the foreign-born population - Israel (%)
Place of birth for the foreign-born population - Jordan (%)
Place of birth for the foreign-born population - Kuwait (%)
Place of birth for the foreign-born population - Lebanon (%)
Place of birth for the foreign-born population - Saudi Arabia (%)
Place of birth for the foreign-born population - Syria (%)
Place of birth for the foreign-born population - Turkey (%)
Place of birth for the foreign-born population - Yemen (%)
Place of birth for the foreign-born population - Other Western Asia (%)
Place of birth for the foreign-born population - Eritrea (%)
Place of birth for the foreign-born population - Ethiopia (%)
Place of birth for the foreign-born population - Kenya (%)
Place of birth for the foreign-born population - Somalia (%)
Place of birth for the foreign-born population - Uganda (%)
Place of birth for the foreign-born population - Zimbabwe (%)
Place of birth for the foreign-born population - Other Eastern Africa (%)
Place of birth for the foreign-born population - Cameroon (%)
Place of birth for the foreign-born population - Congo (%)
Place of birth for the foreign-born population - Democratic Republic of Congo (Zaire) (%)
Place of birth for the foreign-born population - Other Middle Africa (%)
Place of birth for the foreign-born population - Egypt (%)
Place of birth for the foreign-born population - Morocco (%)
Place of birth for the foreign-born population - Sudan (%)
Place of birth for the foreign-born population - Other Northern Africa (%)
Place of birth for the foreign-born population - South Africa (%)
Place of birth for the foreign-born population - Other Southern Africa (%)
Place of birth for the foreign-born population - Cabo Verde (%)
Place of birth for the foreign-born population - Ghana (%)
Place of birth for the foreign-born population - Liberia (%)
Place of birth for the foreign-born population - Nigeria (%)
Place of birth for the foreign-born population - Senegal (%)
Place of birth for the foreign-born population - Sierra Leone (%)
Place of birth for the foreign-born population - Other Western Africa (%)
Place of birth for the foreign-born population - Australia (%)
Place of birth for the foreign-born population - New Zealand (%)
Place of birth for the foreign-born population - Fiji (%)
Place of birth for the foreign-born population - Micronesia (%)
Place of birth for the foreign-born population - Bahamas (%)
Place of birth for the foreign-born population - Barbados (%)
Place of birth for the foreign-born population - Cuba (%)
Place of birth for the foreign-born population - Dominica (%)
Place of birth for the foreign-born population - Dominican Republic (%)
Place of birth for the foreign-born population - Grenada (%)
Place of birth for the foreign-born population - Haiti (%)
Place of birth for the foreign-born population - Jamaica (%)
Place of birth for the foreign-born population - St. Vincent and the Grenadines (%)
Place of birth for the foreign-born population - Trinidad and Tobago (%)
Place of birth for the foreign-born population - West Indies (%)
Place of birth for the foreign-born population - Other Caribbean (%)
Place of birth for the foreign-born population - Belize (%)
Place of birth for the foreign-born population - Costa Rica (%)
Place of birth for the foreign-born population - El Salvador (%)
Place of birth for the foreign-born population - Guatemala (%)
Place of birth for the foreign-born population - Honduras (%)
Place of birth for the foreign-born population - Mexico (%)
Place of birth for the foreign-born population - Nicaragua (%)
Place of birth for the foreign-born population - Panama (%)
Place of birth for the foreign-born population - Other Central America (%)
Place of birth for the foreign-born population - Argentina (%)
Place of birth for the foreign-born population - Bolivia (%)
Place of birth for the foreign-born population - Brazil (%)
Place of birth for the foreign-born population - Chile (%)
Place of birth for the foreign-born population - Colombia (%)
Place of birth for the foreign-born population - Ecuador (%)
Place of birth for the foreign-born population - Guyana (%)
Place of birth for the foreign-born population - Peru (%)
Place of birth for the foreign-born population - Uruguay (%)
Place of birth for the foreign-born population - Venezuela (%)
Place of birth for the foreign-born population - Other South America (%)
Place of birth for the foreign-born population - Canada (%)
Place of birth for the foreign-born population - Other Northern America (%)
Place of birth for the foreign-born population - Other (%)
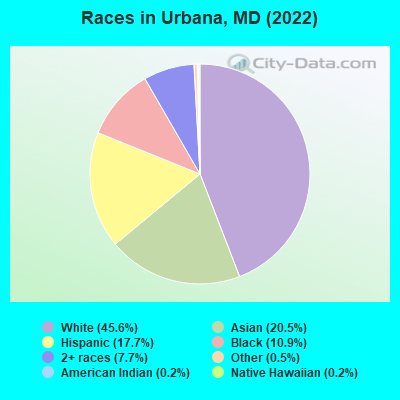
According to 2022 data, the most numerous races in Urbana, MD are White alone (6,399 residents), Black alone (1,526 residents), and Hispanic (2,484 residents). 65.3% of Urbana residents speak English at home.
Race distribution in Urbana 6,399 45.6% White alone 2,874 20.5% Asian alone 2,484 17.7% Hispanic 1,526 10.9% Black alone 1,080 7.7% Two or more races 67 0.5% Other race alone 33 0.2% American Indian alone 31 0.2% Native Hawaiian and Other
2000 2022
3,286,547 62.1% White alone 1,464,735 27.7% Black alone 227,916 4.3% Hispanic 209,738 4.0% Asian alone 82,946 1.6% Two or more races 13,312 0.3% American Indian alone 9,379 0.2% Other race alone 1,913 0.04% Native Hawaiian and Other
2,906,492 47.1% White alone 1,800,914 29.2% Black alone 705,842 11.4% Hispanic 401,818 6.5% Asian alone 291,317 4.7% Two or more races 46,930 0.8% Other race alone 8,930 0.1% American Indian alone 2,417 0.04% Native Hawaiian and Other
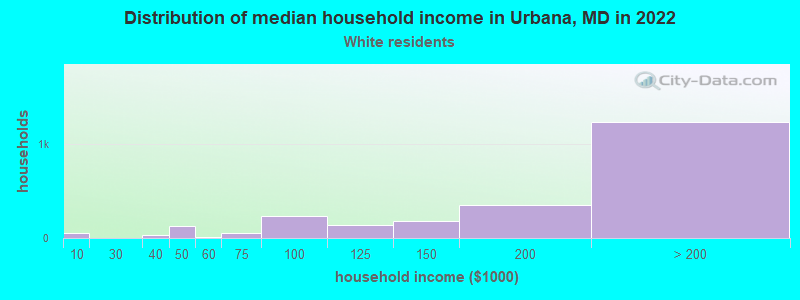
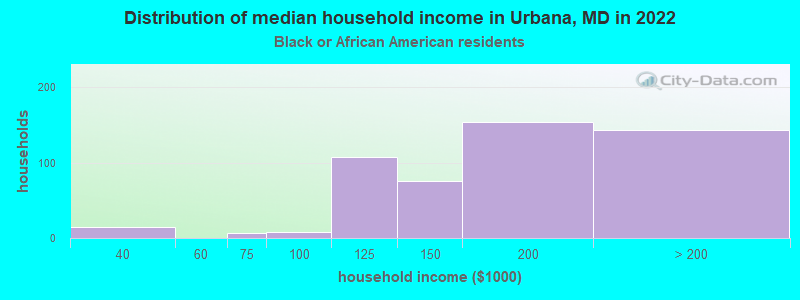
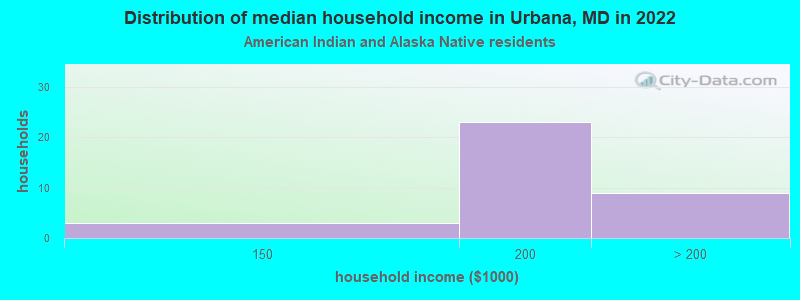
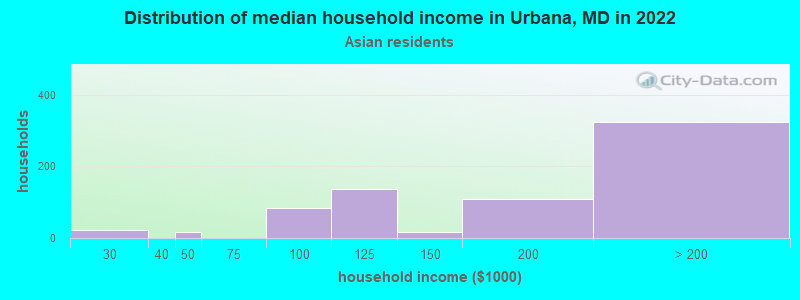
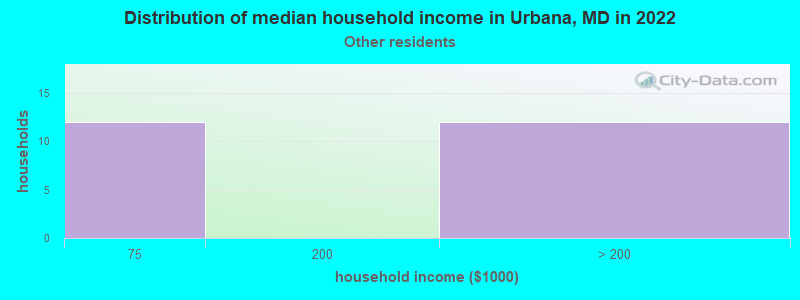
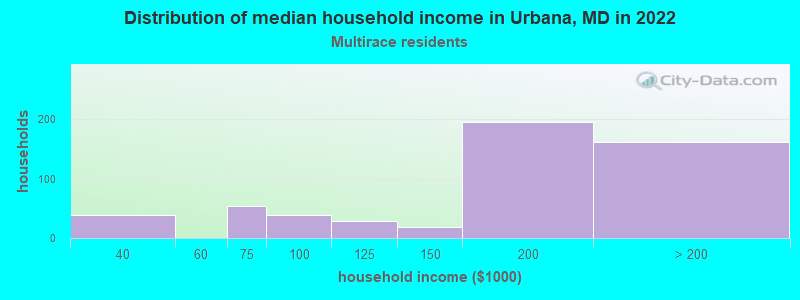
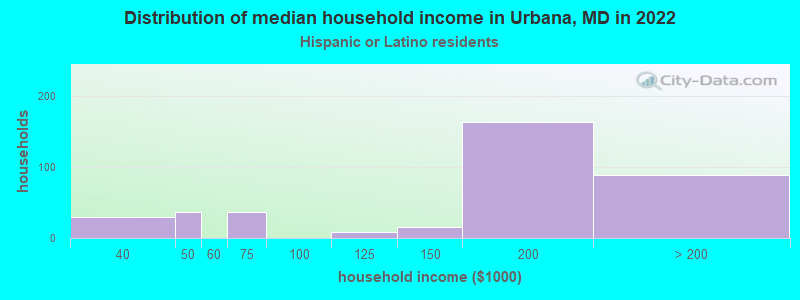
Income and house value in Urbana Median household income in 2022 $183,350 White non-Hispanic householdersover $200,000 Black householders$165,392 American Indian and Alaska Native householders$192,767 Asian householders$198,005 Two or more races householdersover $200,000 Hispanic or Latino race householders
Median age by race in Urbana
38.3 Median age for White residents39.7 37.5 30.6 Median age for Black or African American residents29.2 42.4 32.1 Median age for American Indian / Alaska Native residents-405,255,877.9 35.5 39.4 Median age for Asian residents37.3 40.6 45.2 Median age for Native Hawaiian / Pacific Islander residents-720,061,021.4 45.1 27.5 Median age for Other race residents35.5 26.5 21.4 Median age for Two or more races residents18.6 48.5 38.7 Median age for White alone residents39.6 37.0 20.1 Median age for Hispanic or Latino residents22.0 17.7
Owner/renter occupied households by race in Urbana
House owners and renters - White residents 1,710 72.8% Owner occupied637 27.2% Renter occupiedHouse owners and renters - Black or African American residents 435 82.2% Owner occupied94 17.8% Renter occupiedHouse owners and renters - American Indian / Alaska Native residents 12 46.4% Owner occupied14 53.6% Renter occupiedHouse owners and renters - Asian residents 965 96.2% Owner occupied38 3.8% Renter occupiedHouse owners and renters - Native Hawaiian / Pacific Islander residents 12 100.0% Renter occupiedHouse owners and renters - Other race residents 28 100.0% Renter occupiedHouse owners and renters - Two or more races residents 574 84.1% Owner occupied109 15.9% Renter occupiedHouse owners and renters - White alone residents 1,703 73.0% Owner occupied630 27.0% Renter occupiedHouse owners and renters - Hispanic or Latino residents 331 72.3% Owner occupied126 27.7% Renter occupied
Language usage in Urbana
English speakers - Total 65.3% of residents of Urbana speak English at home.
8.2% of residents speak Spanish at home 903 84.7% Speak English very well163 15.3% Speak English less than very well31.4% of residents speak other language at home 2,973 72.7% Speak English very well1,117 27.3% Speak English less than very well
English speakers - Born in the United States 84.4% of residents of Urbana speak English at home.
7.7% of residents speak Spanish at home 310 92.3% Speak English very well26 7.7% Speak English less than very well8.0% of residents speak other language at home 318 90.6% Speak English very well33 9.4% Speak English less than very well
English speakers - Native, born elsewhere 71.6% of residents of Urbana speak English at home.
33.2% of residents speak Spanish at home 94 91.3% Speak English very well9 8.7% Speak English less than very well
English speakers - Foreign-born 21.7% of residents of Urbana speak English at home.
9.1% of residents speak Spanish at home 239 68.1% Speak English very well112 31.9% Speak English less than very well75.8% of residents speak other language at home 2,091 71.8% Speak English very well822 28.2% Speak English less than very well
White (Caucasian) - Speak only English Native:
95.0% (5,574)Foreign-born:
78.3% (305)
White (Caucasian) - Speak another language Native:
4.3% (255)Foreign-born:
42.0% (163)
Black or African American - Speak only English Native:
72.1% (733)Foreign-born:
29.9% (212)
Black or African American - Speak another language Native:
46.8% (475)Foreign-born:
70.4% (499)
Asian - Speak only English Native:
64.0% (458)Foreign-born:
13.2% (272)
Asian - Speak another language Native:
37.0% (265)Foreign-born:
87.0% (1,788)
Native Hawaiian / Pacific Islander - Speak only English Native:
100.0% (22)Foreign-born:
84.6% (16)
Other race - Speak another language Native:
100.0% (333)Foreign-born:
100.0% (86)
Two or more races - Speak only English Native:
55.6% (997)Foreign-born:
4.9% (31)
Two or more races - Speak another language Native:
44.8% (803)Foreign-born:
100.0% (632)
White alone - Speak only English Native:
95.5% (5,312)Foreign-born:
40.4% (240)
White alone - Speak another language Native:
4.3% (241)Foreign-born:
59.1% (351)
Hispanic or Latino - Speak only English Native:
40.1% (666)Foreign-born:
22.6% (106)
Hispanic or Latino - Speak another language Native:
60.3% (1,002)Foreign-born:
75.3% (353)
Foreign-born residents in Urbana
Marital status for residents in Urbana Marital status - White (Caucasian) population 15 years and over
Males 23.5% Never married61.7% Now married0.8% Separated0.6% Widowed13.5% DivorcedFemales 24.5% Never married60.2% Now married0.3% Separated4.3% Widowed10.7% DivorcedWomen who gave birth in the past 12 months Now married:
56.9% (65)Unmarried:
43.1% (49)
Women who did not give birth in the past 12 months Now married:
63.8% (1,110)Unmarried:
36.2% (629)
Marital status - Black or African American population 15 years and over
Males 40.8% Never married52.0% Now married0.0% Separated0.0% Widowed7.2% DivorcedFemales 21.1% Never married40.7% Now married6.8% Separated25.0% Widowed6.5% DivorcedWomen who gave birth in the past 12 months Now married:
28.0% (8)Unmarried:
72.0% (20)
Women who did not give birth in the past 12 months Now married:
55.5% (239)Unmarried:
44.5% (191)
Marital status - American Indian / Alaska Native population 15 years and over
Males 16.7% Never married83.3% Now married0.0% Separated0.0% Widowed0.0% DivorcedFemales 0.0% Never married55.0% Now married0.0% Separated0.0% Widowed45.0% DivorcedWomen who did not give birth in the past 12 months Now married:
64.7% (16)Unmarried:
35.3% (9)
Marital status - Asian population 15 years and over
Males 20.7% Never married79.3% Now married0.0% Separated0.0% Widowed0.0% DivorcedFemales 7.9% Never married84.0% Now married1.5% Separated3.4% Widowed3.2% DivorcedWomen who gave birth in the past 12 months Now married:
100.0% (53)Unmarried:
0.0% (0)
Women who did not give birth in the past 12 months Now married:
84.8% (593)Unmarried:
15.2% (106)
Marital status - Other race population 15 years and over
Males 0.0% Never married100.0% Now married0.0% Separated0.0% Widowed0.0% DivorcedFemales 45.2% Never married47.6% Now married0.0% Separated0.0% Widowed7.1% DivorcedWomen who gave birth in the past 12 months Now married:
100.0% (86)Unmarried:
0.0% (0)
Women who did not give birth in the past 12 months Now married:
0.0% (0)Unmarried:
100.0% (113)
Marital status - Two or more races population 15 years and over
Males 32.1% Never married65.4% Now married0.0% Separated2.5% Widowed0.0% DivorcedFemales 25.5% Never married61.4% Now married5.1% Separated0.0% Widowed8.0% DivorcedWomen who did not give birth in the past 12 months Now married:
55.9% (250)Unmarried:
44.1% (197)
Marital status - White alone, not Hispanic / Latino population 15 years and over
Males 23.3% Never married62.1% Now married0.9% Separated0.6% Widowed13.2% DivorcedFemales 25.2% Never married59.8% Now married0.3% Separated3.8% Widowed11.0% DivorcedWomen who gave birth in the past 12 months Now married:
54.7% (63)Unmarried:
45.3% (52)
Women who did not give birth in the past 12 months Now married:
63.0% (1,101)Unmarried:
37.0% (647)
Marital status - Hispanic or Latino population 15 years and over
Males 27.9% Never married64.9% Now married0.0% Separated2.1% Widowed5.0% DivorcedFemales 28.8% Never married61.6% Now married4.3% Separated3.8% Widowed1.5% DivorcedWomen who gave birth in the past 12 months Now married:
100.0% (65)Unmarried:
0.0% (0)
Women who did not give birth in the past 12 months Now married:
53.9% (208)Unmarried:
46.1% (178)
Ancestries in Urbana
452 7.5% Ghanaian386 6.4% German383 6.4% Irish150 2.5% European139 2.3% English139 2.3% Italian134 2.2% American106 1.8% African88 1.5% Polish85 1.4% Trinidadian and Tobagonian77 1.3% Russian58 1.0% Czech51 0.8% Somali45 0.7% British42 0.7% Bulgarian41 0.7% Swedish41 0.7% Ukrainian37 0.6% French35 0.6% Turkish32 0.5% Scottish31 0.5% Swiss30 0.5% Afghan29 0.5% Scandinavian20 0.3% U.S. Virgin Islander18 0.3% Yugoslavian16 0.3% Dutch12 0.2% Austrian12 0.2% Lithuanian11 0.2% Slovak9 0.1% British West Indian8 0.1% Celtic8 0.1% Egyptian8 0.1% Northern European8 0.1% Scotch-Irish7 0.1% Australian7 0.1% Welsh6 0.10% Israeli4 0.07% Czechoslovakian4 0.07% Hungarian
Geographical mobility in Urbana Same house 1 year ago 5,837 86.9% White (Caucasian)1,714 100.0% Black or African American37 80.4% American Indian / Alaska Native2,350 83.1% Asian310 100.0% Other race2,494 89.9% Two or more races5,442 85.2% White alone, not Hispanic / Latino2,450 100.0% Hispanic or LatinoMoved within same county 448 6.7% White / Caucasian29 1.7% Black or African American147 5.2% Asian163 5.9% Two or more races501 7.9% White alone, not Hispanic / Latino64 2.8% Hispanic or LatinoMoved within same state 273 4.1% White / Caucasian12 25.6% American Indian / Alaska Native199 7.0% Asian45 100.0% Native Hawaiian / Pacific Islander66 2.4% Two or more races301 4.7% White alone, not Hispanic / LatinoMoved from different state 153 2.3% White / Caucasian9 0.3% Asian14 0.5% Two or more races145 2.3% White alone, not Hispanic / Latino10 0.4% Hispanic or LatinoMoved from abroad 16 0.9% Black or African American49 1.7% Asian
Children Nativity (place of birth) in Urbana
Children under 6 years - Living with two parents Both parents native 568 100.0% NativeBoth parents foreign-born 366 100.0% NativeOne native, one foreign-born parent 135 100.0% NativeChildren under 6 years - Living with one parent Native parent 85 100.0% NativeForeign-born parent 10 100.0% NativeChildren 6 to 17 years - Living with two parents Both parents native 1,275 95.6% Native59 4.4% Foreign-bornBoth parents foreign-born 1,073 88.8% Native135 11.2% Foreign-bornOne native, one foreign-born parent 805 100.0% NativeChildren 6 to 17 years - Living with one parent Native parent 457 100.0% NativeForeign-born parent 171 46.4% Native198 53.6% Foreign-born
Grandparents responsible for own grandchildren in Urbana
Grandparents (30 to 59 years) White / Caucasian 19 100.0% Not responsible for grandchildrenBlack or African American 22 100.0% Responsible for grandchildrenAsian 11 100.0% Not responsible for grandchildrenWhite alone, not Hispanic / Latino 15 100.0% Not responsible for grandchildrenHispanic or Latino 7 100.0% Not responsible for grandchildrenGrandparents (60 years and over) White / Caucasian 19 62.5% Responsible for grandchildren11 37.5% Not responsible for grandchildrenBlack or African American 121 100.0% Not responsible for grandchildrenAsian 66 100.0% Not responsible for grandchildrenWhite alone, not Hispanic / Latino 19 60.4% Responsible for grandchildren12 39.6% Not responsible for grandchildren