Races in Urbana, Illinois (IL) Detailed Stats
Data:
Races - White alone (%)
Races - White alone (% change since 2000)
Races - Black alone (%)
Races - Black alone (% change since 2000)
Races - American Indian alone (%)
Races - American Indian alone (% change since 2000)
Races - Asian alone (%)
Races - Asian alone (% change since 2000)
Races - Hispanic (%)
Races - Hispanic (% change since 2000)
Races - Native Hawaiian and Other Pacific Islander alone (%)
Races - Native Hawaiian and Other Pacific Islander alone (% change since 2000)
Races - Two or more races(%)
Races - Two or more races(% change since 2000)
Races - Other race alone (%)
Races - Other race alone (% change since 2000)
Racial diversity
Place of birth - Born in state of residence (%)
Place of birth - Born in state of residence (%) - White
Place of birth - Born in state of residence (%) - Black or African American
Place of birth - Born in state of residence (%) - Asian
Place of birth - Born in state of residence (%) - Hispanic or Latino
Place of birth - Born in state of residence (%) - American Indian and Alaska Native
Place of birth - Born in state of residence (%) - Multirace
Place of birth - Born in state of residence (%) - Other Race
Place of birth - Born in other state (%)
Place of birth - Born in other state (%) - White
Place of birth - Born in other state (%) - Black or African American
Place of birth - Born in other state (%) - Asian
Place of birth - Born in other state (%) - Hispanic or Latino
Place of birth - Born in other state (%) - American Indian and Alaska Native
Place of birth - Born in other state (%) - Multirace
Place of birth - Born in other state (%) - Other Race
Place of birth - Native, outside of US (%)
Place of birth - Native, outside of US (%) - White
Place of birth - Native, outside of US (%) - Black or African American
Place of birth - Native, outside of US (%) - Asian
Place of birth - Native, outside of US (%) - Hispanic or Latino
Place of birth - Native, outside of US (%) - American Indian and Alaska Native
Place of birth - Native, outside of US (%) - Multirace
Place of birth - Native, outside of US (%) - Other Race
Place of birth - Foreign born (%)
Place of birth - Foreign born (%) - White
Place of birth - Foreign born (%) - Black or African American
Place of birth - Foreign born (%) - Asian
Place of birth - Foreign born (%) - Hispanic or Latino
Place of birth - Foreign born (%) - American Indian and Alaska Native
Place of birth - Foreign born (%) - Multirace
Place of birth - Foreign born (%) - Other Race
Residents speaking English at home (%)
Residents speaking English at home - Born in the United States (%)
Residents speaking English at home - Native, born elsewhere (%)
Residents speaking English at home - Foreign born (%)
Residents speaking Spanish at home (%)
Residents speaking Spanish at home - Born in the United States (%)
Residents speaking Spanish at home - Native, born elsewhere (%)
Residents speaking Spanish at home - Foreign born (%)
Residents speaking other language at home (%)
Residents speaking other language at home - Born in the United States (%)
Residents speaking other language at home - Native, born elsewhere (%)
Residents speaking other language at home - Foreign born (%)
Marital status - Never married (%)
Marital status - Now married (%)
Marital status - Separated (%)
Marital status - Widowed (%)
Marital status - Divorced (%)
Ancestries Reported - Arab (%)
Ancestries Reported - Czech (%)
Ancestries Reported - Danish (%)
Ancestries Reported - Dutch (%)
Ancestries Reported - English (%)
Ancestries Reported - French (%)
Ancestries Reported - French Canadian (%)
Ancestries Reported - German (%)
Ancestries Reported - Greek (%)
Ancestries Reported - Hungarian (%)
Ancestries Reported - Irish (%)
Ancestries Reported - Italian (%)
Ancestries Reported - Lithuanian (%)
Ancestries Reported - Norwegian (%)
Ancestries Reported - Polish (%)
Ancestries Reported - Portuguese (%)
Ancestries Reported - Russian (%)
Ancestries Reported - Scotch-Irish (%)
Ancestries Reported - Scottish (%)
Ancestries Reported - Slovak (%)
Ancestries Reported - Subsaharan African (%)
Ancestries Reported - Swedish (%)
Ancestries Reported - Swiss (%)
Ancestries Reported - Ukrainian (%)
Ancestries Reported - United States (%)
Ancestries Reported - Welsh (%)
Ancestries Reported - West Indian (%)
Ancestries Reported - Other (%)
Geographical mobility - Same house 1 year ago (%)
Geographical mobility - Same house 1 year ago (%) - White
Geographical mobility - Same house 1 year ago (%) - Black or African American
Geographical mobility - Same house 1 year ago (%) - Asian
Geographical mobility - Same house 1 year ago (%) - Hispanic or Latino
Geographical mobility - Same house 1 year ago (%) - American Indian and Alaska Native
Geographical mobility - Same house 1 year ago (%) - Multirace
Geographical mobility - Same house 1 year ago (%) - Other Race
Geographical mobility - Moved within same county (%)
Geographical mobility - Moved within same county (%) - White
Geographical mobility - Moved within same county (%) - Black or African American
Geographical mobility - Moved within same county (%) - Asian
Geographical mobility - Moved within same county (%) - Hispanic or Latino
Geographical mobility - Moved within same county (%) - American Indian and Alaska Native
Geographical mobility - Moved within same county (%) - Multirace
Geographical mobility - Moved within same county (%) - Other Race
Geographical mobility - Moved from different county within same state (%)
Geographical mobility - Moved from different county within same state (%) - White
Geographical mobility - Moved from different county within same state (%) - Black or African American
Geographical mobility - Moved from different county within same state (%) - Asian
Geographical mobility - Moved from different county within same state (%) - Hispanic or Latino
Geographical mobility - Moved from different county within same state (%) - American Indian and Alaska Native
Geographical mobility - Moved from different county within same state (%) - Multirace
Geographical mobility - Moved from different county within same state (%) - Other Race
Geographical mobility - Moved from different state (%)
Geographical mobility - Moved from different state (%) - White
Geographical mobility - Moved from different state (%) - Black or African American
Geographical mobility - Moved from different state (%) - Asian
Geographical mobility - Moved from different state (%) - Hispanic or Latino
Geographical mobility - Moved from different state (%) - American Indian and Alaska Native
Geographical mobility - Moved from different state (%) - Multirace
Geographical mobility - Moved from different state (%) - Other Race
Geographical mobility - Moved from abroad (%)
Geographical mobility - Moved from abroad (%) - White
Geographical mobility - Moved from abroad (%) - Black or African American
Geographical mobility - Moved from abroad (%) - Asian
Geographical mobility - Moved from abroad (%) - Hispanic or Latino
Geographical mobility - Moved from abroad (%) - American Indian and Alaska Native
Geographical mobility - Moved from abroad (%) - Multirace
Geographical mobility - Moved from abroad (%) - Other Race
Place of birth for the foreign-born population - Ireland (%)
Place of birth for the foreign-born population - Denmark (%)
Place of birth for the foreign-born population - Norway (%)
Place of birth for the foreign-born population - Sweden (%)
Place of birth for the foreign-born population - United Kingdom (%)
Place of birth for the foreign-born population - England (%)
Place of birth for the foreign-born population - Scotland (%)
Place of birth for the foreign-born population - Other Northern Europe (%)
Place of birth for the foreign-born population - Austria (%)
Place of birth for the foreign-born population - Belgium (%)
Place of birth for the foreign-born population - France (%)
Place of birth for the foreign-born population - Germany (%)
Place of birth for the foreign-born population - Netherlands (%)
Place of birth for the foreign-born population - Switzerland (%)
Place of birth for the foreign-born population - Other Western Europe (%)
Place of birth for the foreign-born population - Greece (%)
Place of birth for the foreign-born population - Italy (%)
Place of birth for the foreign-born population - Portugal (%)
Place of birth for the foreign-born population - Spain (%)
Place of birth for the foreign-born population - Other Southern Europe (%)
Place of birth for the foreign-born population - Albania (%)
Place of birth for the foreign-born population - Belarus (%)
Place of birth for the foreign-born population - Bosnia and Herzegovina (%)
Place of birth for the foreign-born population - Bulgaria (%)
Place of birth for the foreign-born population - Croatia (%)
Place of birth for the foreign-born population - Czechoslovakia (%)
Place of birth for the foreign-born population - Hungary (%)
Place of birth for the foreign-born population - Latvia (%)
Place of birth for the foreign-born population - Lithuania (%)
Place of birth for the foreign-born population - North Macedonia (Macedonia) (%)
Place of birth for the foreign-born population - Moldova (%)
Place of birth for the foreign-born population - Poland (%)
Place of birth for the foreign-born population - Romania (%)
Place of birth for the foreign-born population - Russia (%)
Place of birth for the foreign-born population - Serbia (%)
Place of birth for the foreign-born population - Ukraine (%)
Place of birth for the foreign-born population - Other Eastern Europe (%)
Place of birth for the foreign-born population - China (%)
Place of birth for the foreign-born population - Hong Kong (%)
Place of birth for the foreign-born population - Taiwan (%)
Place of birth for the foreign-born population - Japan (%)
Place of birth for the foreign-born population - Korea (%)
Place of birth for the foreign-born population - Other Eastern Asia (%)
Place of birth for the foreign-born population - Afghanistan (%)
Place of birth for the foreign-born population - Bangladesh (%)
Place of birth for the foreign-born population - India (%)
Place of birth for the foreign-born population - Iran (%)
Place of birth for the foreign-born population - Kazakhstan (%)
Place of birth for the foreign-born population - Nepal (%)
Place of birth for the foreign-born population - Pakistan (%)
Place of birth for the foreign-born population - Sri Lanka (%)
Place of birth for the foreign-born population - Uzbekistan (%)
Place of birth for the foreign-born population - Other South Central Asia (%)
Place of birth for the foreign-born population - Burma (%)
Place of birth for the foreign-born population - Cambodia (%)
Place of birth for the foreign-born population - Indonesia (%)
Place of birth for the foreign-born population - Laos (%)
Place of birth for the foreign-born population - Malaysia (%)
Place of birth for the foreign-born population - Philippines (%)
Place of birth for the foreign-born population - Singapore (%)
Place of birth for the foreign-born population - Thailand (%)
Place of birth for the foreign-born population - Vietnam (%)
Place of birth for the foreign-born population - Other South Eastern Asia (%)
Place of birth for the foreign-born population - Armenia (%)
Place of birth for the foreign-born population - Iraq (%)
Place of birth for the foreign-born population - Israel (%)
Place of birth for the foreign-born population - Jordan (%)
Place of birth for the foreign-born population - Kuwait (%)
Place of birth for the foreign-born population - Lebanon (%)
Place of birth for the foreign-born population - Saudi Arabia (%)
Place of birth for the foreign-born population - Syria (%)
Place of birth for the foreign-born population - Turkey (%)
Place of birth for the foreign-born population - Yemen (%)
Place of birth for the foreign-born population - Other Western Asia (%)
Place of birth for the foreign-born population - Eritrea (%)
Place of birth for the foreign-born population - Ethiopia (%)
Place of birth for the foreign-born population - Kenya (%)
Place of birth for the foreign-born population - Somalia (%)
Place of birth for the foreign-born population - Uganda (%)
Place of birth for the foreign-born population - Zimbabwe (%)
Place of birth for the foreign-born population - Other Eastern Africa (%)
Place of birth for the foreign-born population - Cameroon (%)
Place of birth for the foreign-born population - Congo (%)
Place of birth for the foreign-born population - Democratic Republic of Congo (Zaire) (%)
Place of birth for the foreign-born population - Other Middle Africa (%)
Place of birth for the foreign-born population - Egypt (%)
Place of birth for the foreign-born population - Morocco (%)
Place of birth for the foreign-born population - Sudan (%)
Place of birth for the foreign-born population - Other Northern Africa (%)
Place of birth for the foreign-born population - South Africa (%)
Place of birth for the foreign-born population - Other Southern Africa (%)
Place of birth for the foreign-born population - Cabo Verde (%)
Place of birth for the foreign-born population - Ghana (%)
Place of birth for the foreign-born population - Liberia (%)
Place of birth for the foreign-born population - Nigeria (%)
Place of birth for the foreign-born population - Senegal (%)
Place of birth for the foreign-born population - Sierra Leone (%)
Place of birth for the foreign-born population - Other Western Africa (%)
Place of birth for the foreign-born population - Australia (%)
Place of birth for the foreign-born population - New Zealand (%)
Place of birth for the foreign-born population - Fiji (%)
Place of birth for the foreign-born population - Micronesia (%)
Place of birth for the foreign-born population - Bahamas (%)
Place of birth for the foreign-born population - Barbados (%)
Place of birth for the foreign-born population - Cuba (%)
Place of birth for the foreign-born population - Dominica (%)
Place of birth for the foreign-born population - Dominican Republic (%)
Place of birth for the foreign-born population - Grenada (%)
Place of birth for the foreign-born population - Haiti (%)
Place of birth for the foreign-born population - Jamaica (%)
Place of birth for the foreign-born population - St. Vincent and the Grenadines (%)
Place of birth for the foreign-born population - Trinidad and Tobago (%)
Place of birth for the foreign-born population - West Indies (%)
Place of birth for the foreign-born population - Other Caribbean (%)
Place of birth for the foreign-born population - Belize (%)
Place of birth for the foreign-born population - Costa Rica (%)
Place of birth for the foreign-born population - El Salvador (%)
Place of birth for the foreign-born population - Guatemala (%)
Place of birth for the foreign-born population - Honduras (%)
Place of birth for the foreign-born population - Mexico (%)
Place of birth for the foreign-born population - Nicaragua (%)
Place of birth for the foreign-born population - Panama (%)
Place of birth for the foreign-born population - Other Central America (%)
Place of birth for the foreign-born population - Argentina (%)
Place of birth for the foreign-born population - Bolivia (%)
Place of birth for the foreign-born population - Brazil (%)
Place of birth for the foreign-born population - Chile (%)
Place of birth for the foreign-born population - Colombia (%)
Place of birth for the foreign-born population - Ecuador (%)
Place of birth for the foreign-born population - Guyana (%)
Place of birth for the foreign-born population - Peru (%)
Place of birth for the foreign-born population - Uruguay (%)
Place of birth for the foreign-born population - Venezuela (%)
Place of birth for the foreign-born population - Other South America (%)
Place of birth for the foreign-born population - Canada (%)
Place of birth for the foreign-born population - Other Northern America (%)
Place of birth for the foreign-born population - Other (%)
Latest news about races in Urbana, IL collected exclusively by city-data.com from local newspapers, TV, and radio stations
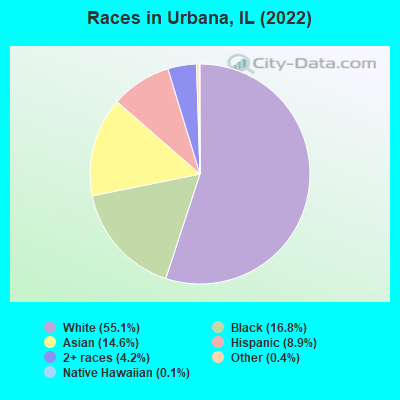
According to 2022 data, the most numerous races in Urbana, IL are White alone (21,329 residents), Hispanic (3,446 residents), and Black alone (6,493 residents). 74.7% of Urbana residents speak English at home. 18.5% of Urbana, IL residents are foreign-born (11.6% born in Asia, 2.3% born in Africa, 2.1% born in Latin America, 2.0% born in Europe), which is 24.5% greater than the foreign-born rate of 14.0% across the entire state of Illinois.
Race distribution in Urbana
2000 2022
8,424,140 67.8% White alone 1,856,152 14.9% Black alone 1,530,262 12.3% Hispanic 419,916 3.4% Asian alone 153,996 1.2% Two or more races 13,479 0.1% Other race alone 18,232 0.1% American Indian alone 3,116 0.03% Native Hawaiian and Other
7,356,301 58.5% White alone 2,299,726 18.3% Hispanic 1,660,423 13.2% Black alone 747,296 5.9% Asian alone 458,599 3.6% Two or more races 45,386 0.4% Other race alone 10,405 0.08% American Indian alone 3,896 0.03% Native Hawaiian and Other
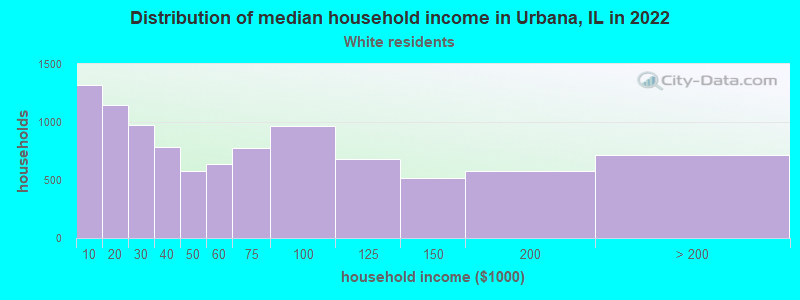
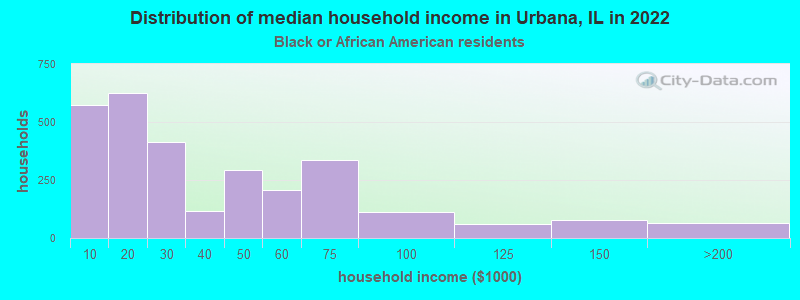
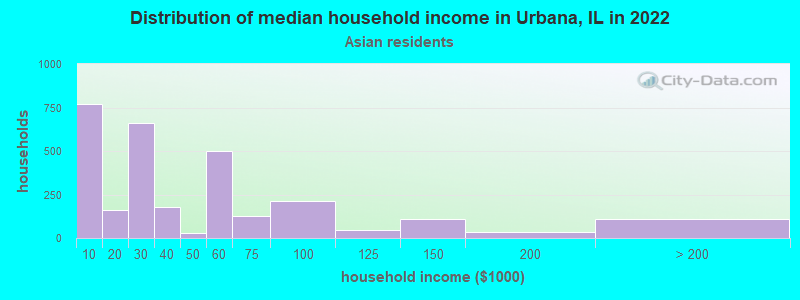
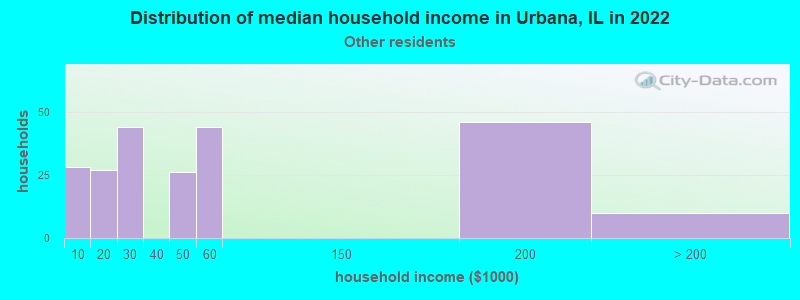
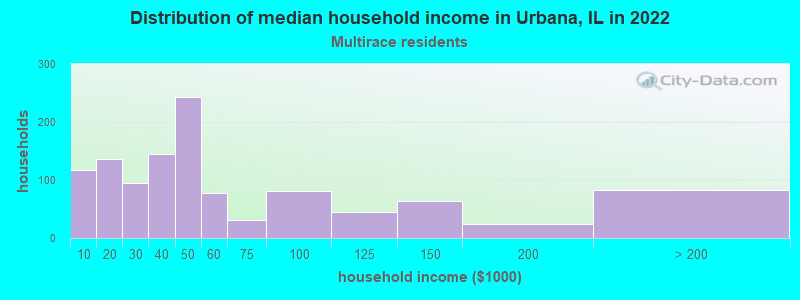
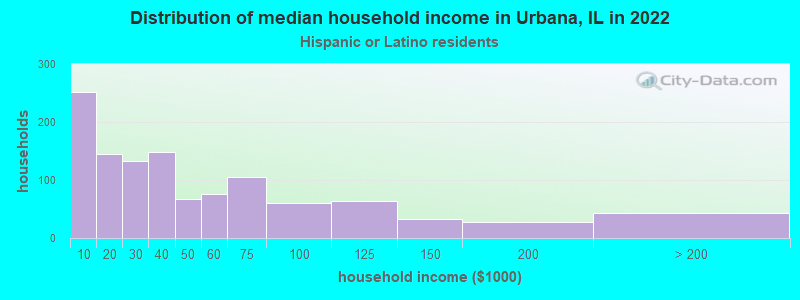
Income and house value in Urbana Median household income in 2022 $52,314 White non-Hispanic householders$26,843 Black householders$41,640 Asian householders$69,574 Two or more races householders$44,853 Hispanic or Latino race householdersMedian 2022 house value $188,087 White Non-Hispanic householders$125,998 Black or African American householders$192,132 American Indian or Alaska Native householders $183,638 Asian householders$139,144 Some other race householders$151,683 Two or more races householders$123,976 Hispanic or Latino householders
Median age by race in Urbana
28.4 Median age for White residents27.7 29.4 24.8 Median age for Black or African American residents24.1 29.7 -303,030,302.7 Median age for American Indian / Alaska Native residents-663,453,814.6 -442,105,262.7 24.0 Median age for Asian residents23.5 24.3 -593,236,714.4 Median age for Native Hawaiian / Pacific Islander residents-666,666,666.0 -576,015,108.0 24.2 Median age for Other race residents28.9 22.2 24.7 Median age for Two or more races residents26.1 20.2 28.6 Median age for White alone residents28.0 29.6 23.9 Median age for Hispanic or Latino residents25.6 22.5
Owner/renter occupied households by race in Urbana
House owners and renters - White residents 4,290 44.5% Owner occupied5,360 55.5% Renter occupiedHouse owners and renters - Black or African American residents 513 15.7% Owner occupied2,746 84.3% Renter occupiedHouse owners and renters - American Indian / Alaska Native residents 7 100.0% Owner occupiedHouse owners and renters - Asian residents 419 15.4% Owner occupied2,303 84.6% Renter occupiedHouse owners and renters - Native Hawaiian / Pacific Islander residents 50 100.0% Renter occupiedHouse owners and renters - Other race residents 36 18.0% Owner occupied164 82.0% Renter occupiedHouse owners and renters - Two or more races residents 267 31.4% Owner occupied584 68.6% Renter occupiedHouse owners and renters - White alone residents 4,217 45.9% Owner occupied4,966 54.1% Renter occupiedHouse owners and renters - Hispanic or Latino residents 346 28.9% Owner occupied851 71.1% Renter occupied
Language usage in Urbana
English speakers - Total 74.7% of residents of Urbana speak English at home.
6.4% of residents speak Spanish at home 1,728 72.6% Speak English very well652 27.4% Speak English less than very well19.5% of residents speak other language at home 4,297 59.1% Speak English very well2,968 40.9% Speak English less than very well
English speakers - Born in the United States 90.1% of residents of Urbana speak English at home.
4.8% of residents speak Spanish at home 356 85.4% Speak English very well61 14.6% Speak English less than very well5.1% of residents speak other language at home 389 88.2% Speak English very well52 11.8% Speak English less than very well
English speakers - Native, born elsewhere 48.1% of residents of Urbana speak English at home.
15.5% of residents speak Spanish at home 115 65.7% Speak English very well60 34.3% Speak English less than very well15.8% of residents speak other language at home 158 88.8% Speak English very well20 11.2% Speak English less than very well
English speakers - Foreign-born 13.4% of residents of Urbana speak English at home.
9.0% of residents speak Spanish at home 400 59.4% Speak English very well273 40.6% Speak English less than very well76.7% of residents speak other language at home 3,219 56.1% Speak English very well2,524 43.9% Speak English less than very well
White (Caucasian) - Speak only English Native:
95.9% (18,583)Foreign-born:
11.3% (275)
White (Caucasian) - Speak another language Native:
3.1% (602)Foreign-born:
91.4% (2,231)
Black or African American - Speak only English Native:
97.3% (5,379)Foreign-born:
19.4% (121)
Black or African American - Speak another language Native:
2.7% (149)Foreign-born:
77.8% (485)
Asian - Speak only English Native:
49.7% (984)Foreign-born:
9.5% (337)
Asian - Speak another language Native:
52.6% (1,042)Foreign-born:
90.1% (3,199)
Other race - Speak only English Native:
29.4% (140)Foreign-born:
3.9% (8)
Other race - Speak another language Native:
75.3% (359)Foreign-born:
97.8% (213)
Two or more races - Speak only English Native:
62.0% (1,743)Foreign-born:
25.4% (148)
Two or more races - Speak another language Native:
42.6% (1,197)Foreign-born:
74.4% (434)
White alone - Speak only English Native:
97.7% (18,300)Foreign-born:
9.5% (211)
White alone - Speak another language Native:
2.1% (390)Foreign-born:
95.5% (2,137)
Hispanic or Latino - Speak only English Native:
35.0% (833)Foreign-born:
14.8% (122)
Hispanic or Latino - Speak another language Native:
65.8% (1,567)Foreign-born:
84.8% (695)
Foreign-born residents in Urbana 7,185 residents are foreign born (11.6% Asia , 2.3% Africa , 2.1% Latin America , 2.0% Europe ).
This city:
18.5%Illinois:
14.1%
Marital status for residents in Urbana Marital status - White (Caucasian) population 15 years and over
Males 58.9% Never married31.9% Now married0.3% Separated1.7% Widowed7.2% DivorcedFemales 57.7% Never married29.8% Now married0.7% Separated6.7% Widowed5.1% DivorcedWomen who gave birth in the past 12 months Now married:
90.8% (205)Unmarried:
9.2% (21)
Women who did not give birth in the past 12 months Now married:
19.9% (1,431)Unmarried:
80.1% (5,755)
Marital status - Black or African American population 15 years and over
Males 74.9% Never married20.0% Now married0.0% Separated0.0% Widowed5.1% DivorcedFemales 66.4% Never married15.4% Now married0.6% Separated6.1% Widowed11.5% DivorcedWomen who gave birth in the past 12 months Now married:
100.0% (24)Unmarried:
0.0% (0)
Women who did not give birth in the past 12 months Now married:
8.5% (182)Unmarried:
91.5% (1,961)
Marital status - American Indian / Alaska Native population 15 years and over
Males 100.0% Never married0.0% Now married0.0% Separated0.0% Widowed0.0% DivorcedFemales 0.0% Never married0.0% Now married0.0% Separated0.0% Widowed100.0% DivorcedMarital status - Asian population 15 years and over
Males 80.9% Never married17.2% Now married1.0% Separated0.0% Widowed0.9% DivorcedFemales 71.2% Never married26.0% Now married0.0% Separated2.0% Widowed0.8% DivorcedWomen who gave birth in the past 12 months Now married:
100.0% (36)Unmarried:
0.0% (0)
Women who did not give birth in the past 12 months Now married:
17.0% (355)Unmarried:
83.0% (1,731)
Marital status - Other race population 15 years and over
Males 68.4% Never married31.6% Now married0.0% Separated0.0% Widowed0.0% DivorcedFemales 50.2% Never married34.6% Now married4.6% Separated0.0% Widowed10.6% DivorcedWomen who did not give birth in the past 12 months Now married:
26.1% (64)Unmarried:
73.9% (181)
Marital status - Two or more races population 15 years and over
Males 69.3% Never married24.7% Now married0.3% Separated0.0% Widowed5.7% DivorcedFemales 62.8% Never married18.2% Now married0.0% Separated11.0% Widowed8.0% DivorcedWomen who gave birth in the past 12 months Now married:
26.9% (9)Unmarried:
73.1% (25)
Women who did not give birth in the past 12 months Now married:
17.5% (184)Unmarried:
82.5% (867)
Marital status - White alone, not Hispanic / Latino population 15 years and over
Males 58.3% Never married32.5% Now married0.4% Separated1.8% Widowed7.1% DivorcedFemales 57.3% Never married29.7% Now married0.8% Separated7.1% Widowed5.1% DivorcedWomen who gave birth in the past 12 months Now married:
89.8% (190)Unmarried:
10.2% (22)
Women who did not give birth in the past 12 months Now married:
19.8% (1,372)Unmarried:
80.2% (5,554)
Marital status - Hispanic or Latino population 15 years and over
Males 66.8% Never married28.9% Now married0.2% Separated0.0% Widowed4.1% DivorcedFemales 66.4% Never married26.9% Now married0.9% Separated0.6% Widowed5.2% DivorcedWomen who gave birth in the past 12 months Now married:
100.0% (23)Unmarried:
0.0% (0)
Women who did not give birth in the past 12 months Now married:
20.2% (244)Unmarried:
79.8% (963)
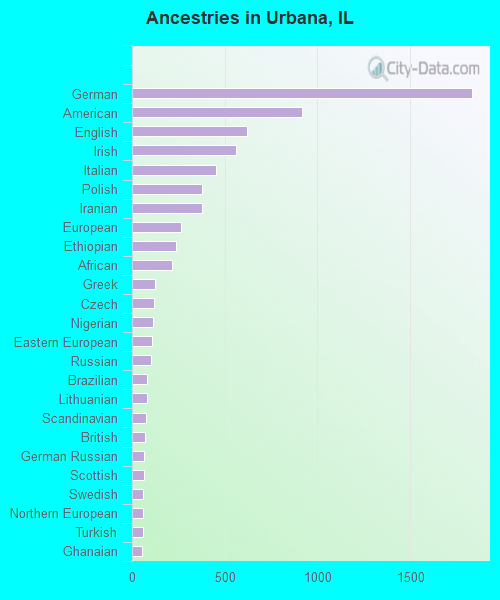
Ancestries in Urbana
1,833 9.3% German916 4.7% American619 3.2% English561 2.9% Irish453 2.3% Italian380 1.9% Polish377 1.9% Iranian265 1.3% European236 1.2% Ethiopian213 1.1% African126 0.6% Greek118 0.6% Czech111 0.6% Nigerian108 0.5% Eastern European104 0.5% Russian82 0.4% Brazilian82 0.4% Lithuanian74 0.4% Scandinavian69 0.4% British67 0.3% German Russian62 0.3% Scottish60 0.3% Swedish59 0.3% Northern European58 0.3% Turkish56 0.3% Ghanaian55 0.3% Dutch52 0.3% Norwegian51 0.3% Arab49 0.2% Egyptian46 0.2% Icelander43 0.2% Welsh36 0.2% Romanian36 0.2% Ukrainian31 0.2% French Canadian29 0.1% French26 0.1% Syrian25 0.1% Hungarian23 0.1% Kenyan17 0.09% Albanian17 0.09% Portuguese16 0.08% Israeli16 0.08% U.S. Virgin Islander15 0.08% Alsatian15 0.08% Danish15 0.08% Scotch-Irish13 0.07% Pennsylvania German13 0.07% Iraqi13 0.07% Liberian12 0.06% Ugandan11 0.06% Lebanese10 0.05% Czechoslovakian3 0.02% Finnish
Geographical mobility in Urbana Same house 1 year ago 14,922 67.7% White (Caucasian)4,879 75.3% Black or African American39 99.7% American Indian / Alaska Native3,317 58.3% Asian42 100.0% Native Hawaiian / Pacific Islander418 54.1% Other race2,300 66.8% Two or more races14,261 67.7% White alone, not Hispanic / Latino2,260 66.4% Hispanic or LatinoMoved within same county 3,375 15.3% White / Caucasian617 9.5% Black or African American1,005 17.6% Asian241 31.2% Other race515 15.0% Two or more races3,283 15.6% White alone, not Hispanic / Latino624 18.3% Hispanic or LatinoMoved within same state 2,554 11.6% White / Caucasian670 10.3% Black or African American296 5.2% Asian126 16.3% Other race226 6.6% Two or more races2,489 11.8% White alone, not Hispanic / Latino331 9.7% Hispanic or LatinoMoved from different state 939 4.3% White / Caucasian30 0.5% Black or African American472 8.3% Asian18 2.4% Other race156 4.5% Two or more races938 4.4% White alone, not Hispanic / Latino52 1.5% Hispanic or LatinoMoved from abroad 662 3.0% White104 1.6% Black or African American622 10.9% Asian25 3.2% Other race230 6.7% Two or more races575 2.7% White alone, not Hispanic / Latino170 5.0% Hispanic or Latino
Children Nativity (place of birth) in Urbana
Children under 6 years - Living with two parents Both parents native 817 100.0% NativeBoth parents foreign-born 139 64.4% Native77 35.6% Foreign-bornOne native, one foreign-born parent 245 100.0% NativeChildren under 6 years - Living with one parent Native parent 335 100.0% NativeForeign-born parent 24 100.0% Foreign-bornChildren 6 to 17 years - Living with two parents Both parents native 607 94.3% Native37 5.7% Foreign-bornBoth parents foreign-born 316 76.3% Native98 23.7% Foreign-bornOne native, one foreign-born parent 332 100.0% NativeChildren 6 to 17 years - Living with one parent Native parent 563 91.3% Native54 8.7% Foreign-bornForeign-born parent 82 85.3% Native14 14.7% Foreign-born
Grandparents responsible for own grandchildren in Urbana
Grandparents (30 to 59 years) White / Caucasian 9 29.5% Responsible for grandchildren21 70.5% Not responsible for grandchildrenAsian 6 100.0% Not responsible for grandchildrenTwo or more races 28 100.0% Responsible for grandchildrenWhite alone, not Hispanic / Latino 10 27.3% Responsible for grandchildren26 72.7% Not responsible for grandchildren
Grandparents (60 years and over) White / Caucasian 37 100.0% Not responsible for grandchildrenAsian 25 100.0% Not responsible for grandchildrenWhite alone, not Hispanic / Latino 42 100.0% Not responsible for grandchildren