Races in Upper Providence Township, Pennsylvania (PA) Detailed Stats
Ancestries, Foreign-born residents, place of birth

Recent posts about races in Upper Providence Township, Pennsylvania on our local forum with over 2,400,000 registered users:
 | Planning a move to Philly in Spring 2019 (37 replies) |
| Great schools, affordable house for 5, near Collegeville? (3 replies) |
| Recommend a place to live near Philly (Nord-West) (26 replies) |
| Toll Bros/ Liseter/Newtown Square (6 replies) |
| Moving to Upper Providence Delco, Any Advice? (2 replies) |
| Best, nice and quiet area to live in Delaware county (16 replies) |
5.6% of Upper Providence Township, PA residents are foreign-born (2.4% born in Asia, 2.1% born in Europe), which is 24.9% less than the foreign-born rate of 7.0% across the entire state of Pennsylvania.
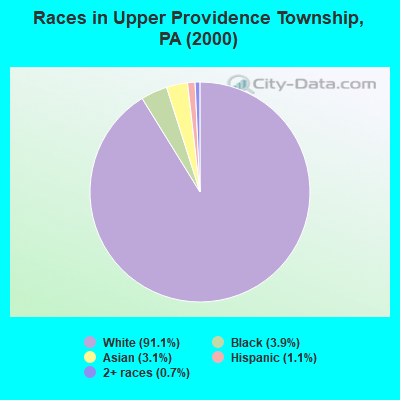
Race distribution in Upper Providence Township

- 9,57491.1%White alone
- 4083.9%Black alone
- 3213.1%Asian alone
- 1121.1%Hispanic
- 770.7%Two or more races
- 100.10%Other race alone
- 70.07%American Indian alone
2000
2022
-
- 10,322,45584.1%White alone
- 1,202,4379.8%Black alone
- 394,0883.2%Hispanic
- 218,2961.8%Asian alone
- 113,0970.9%Two or more races
- 13,0860.1%Other race alone
- 14,9040.1%American Indian alone
- 2,6910.02%Native Hawaiian and Other
Pacific Islander alone

-
- 9,487,22873.1%White alone
- 1,311,58110.1%Black alone
- 1,115,9978.6%Hispanic
- 493,9423.8%Two or more races
- 487,1243.8%Asian alone
- 63,5820.5%Other race alone
- 10,1300.08%American Indian alone
- 2,4240.02%Native Hawaiian and Other
Pacific Islander alone

Income and house value in Upper Providence Township
- Median household income in 2022
- $132,146White non-Hispanic householders
- $89,880Black householders
- $171,210Asian householders
- $147,970Some other race householders
- $29,232Two or more races householders
- $143,118Hispanic or Latino race householders
- Median 2022 house value
- $578,372White Non-Hispanic householders
- $376,950Black or African American householders
- $351,305Asian householders
- $404,586Some other race householders
- $336,616Two or more races householders
- $342,342Hispanic or Latino householders
Household income for White non-Hispanic householders

Household income for Black householders

Household income for Asian householders

Household income for Two or more races householders

Household income for Hispanic or Latino race householders

Foreign-born residents in Upper Providence Township
589 residents are foreign born (2.4% Asia, 2.1% Europe).
| This city: | 5.6% |
| Pennsylvania: | 4.1% |
Ancestries in Upper Providence Township

- 2,99322.6%Irish
- 2,22916.9%German
- 1,88014.2%Italian
- 1,59612.1%Other
- 1,36910.4%English
- 5834.4%Polish
- 3352.5%United States
- 2832.1%Russian
- 2501.9%French
- 2171.6%Ukrainian
- 1981.5%Scotch-Irish
- 1711.3%Scottish
- 1541.2%Dutch
- 1531.2%Norwegian
- 1240.9%Welsh
- 1120.8%Czech
- 860.7%Swedish
- 660.5%Danish
- 660.5%Slovak
- 600.5%Arab
- 550.4%Hungarian
- 550.4%Lithuanian
- 500.4%French Canadian
- 490.4%Greek
- 290.2%Subsaharan African
- 280.2%Swiss
- 170.1%Portuguese
- 160.1%West Indian

Zip codes: 19063.