Races in Upper Montclair, New Jersey (NJ) Detailed Stats
Data:
Races - White alone (%)
Races - White alone (% change since 2000)
Races - Black alone (%)
Races - Black alone (% change since 2000)
Races - American Indian alone (%)
Races - American Indian alone (% change since 2000)
Races - Asian alone (%)
Races - Asian alone (% change since 2000)
Races - Hispanic (%)
Races - Hispanic (% change since 2000)
Races - Native Hawaiian and Other Pacific Islander alone (%)
Races - Native Hawaiian and Other Pacific Islander alone (% change since 2000)
Races - Two or more races(%)
Races - Two or more races(% change since 2000)
Races - Other race alone (%)
Races - Other race alone (% change since 2000)
Racial diversity
Place of birth - Born in state of residence (%)
Place of birth - Born in state of residence (%) - White
Place of birth - Born in state of residence (%) - Black or African American
Place of birth - Born in state of residence (%) - Asian
Place of birth - Born in state of residence (%) - Hispanic or Latino
Place of birth - Born in state of residence (%) - American Indian and Alaska Native
Place of birth - Born in state of residence (%) - Multirace
Place of birth - Born in state of residence (%) - Other Race
Place of birth - Born in other state (%)
Place of birth - Born in other state (%) - White
Place of birth - Born in other state (%) - Black or African American
Place of birth - Born in other state (%) - Asian
Place of birth - Born in other state (%) - Hispanic or Latino
Place of birth - Born in other state (%) - American Indian and Alaska Native
Place of birth - Born in other state (%) - Multirace
Place of birth - Born in other state (%) - Other Race
Place of birth - Native, outside of US (%)
Place of birth - Native, outside of US (%) - White
Place of birth - Native, outside of US (%) - Black or African American
Place of birth - Native, outside of US (%) - Asian
Place of birth - Native, outside of US (%) - Hispanic or Latino
Place of birth - Native, outside of US (%) - American Indian and Alaska Native
Place of birth - Native, outside of US (%) - Multirace
Place of birth - Native, outside of US (%) - Other Race
Place of birth - Foreign born (%)
Place of birth - Foreign born (%) - White
Place of birth - Foreign born (%) - Black or African American
Place of birth - Foreign born (%) - Asian
Place of birth - Foreign born (%) - Hispanic or Latino
Place of birth - Foreign born (%) - American Indian and Alaska Native
Place of birth - Foreign born (%) - Multirace
Place of birth - Foreign born (%) - Other Race
Residents speaking English at home (%)
Residents speaking English at home - Born in the United States (%)
Residents speaking English at home - Native, born elsewhere (%)
Residents speaking English at home - Foreign born (%)
Residents speaking Spanish at home (%)
Residents speaking Spanish at home - Born in the United States (%)
Residents speaking Spanish at home - Native, born elsewhere (%)
Residents speaking Spanish at home - Foreign born (%)
Residents speaking other language at home (%)
Residents speaking other language at home - Born in the United States (%)
Residents speaking other language at home - Native, born elsewhere (%)
Residents speaking other language at home - Foreign born (%)
Marital status - Never married (%)
Marital status - Now married (%)
Marital status - Separated (%)
Marital status - Widowed (%)
Marital status - Divorced (%)
Ancestries Reported - Arab (%)
Ancestries Reported - Czech (%)
Ancestries Reported - Danish (%)
Ancestries Reported - Dutch (%)
Ancestries Reported - English (%)
Ancestries Reported - French (%)
Ancestries Reported - French Canadian (%)
Ancestries Reported - German (%)
Ancestries Reported - Greek (%)
Ancestries Reported - Hungarian (%)
Ancestries Reported - Irish (%)
Ancestries Reported - Italian (%)
Ancestries Reported - Lithuanian (%)
Ancestries Reported - Norwegian (%)
Ancestries Reported - Polish (%)
Ancestries Reported - Portuguese (%)
Ancestries Reported - Russian (%)
Ancestries Reported - Scotch-Irish (%)
Ancestries Reported - Scottish (%)
Ancestries Reported - Slovak (%)
Ancestries Reported - Subsaharan African (%)
Ancestries Reported - Swedish (%)
Ancestries Reported - Swiss (%)
Ancestries Reported - Ukrainian (%)
Ancestries Reported - United States (%)
Ancestries Reported - Welsh (%)
Ancestries Reported - West Indian (%)
Ancestries Reported - Other (%)
Geographical mobility - Same house 1 year ago (%)
Geographical mobility - Same house 1 year ago (%) - White
Geographical mobility - Same house 1 year ago (%) - Black or African American
Geographical mobility - Same house 1 year ago (%) - Asian
Geographical mobility - Same house 1 year ago (%) - Hispanic or Latino
Geographical mobility - Same house 1 year ago (%) - American Indian and Alaska Native
Geographical mobility - Same house 1 year ago (%) - Multirace
Geographical mobility - Same house 1 year ago (%) - Other Race
Geographical mobility - Moved within same county (%)
Geographical mobility - Moved within same county (%) - White
Geographical mobility - Moved within same county (%) - Black or African American
Geographical mobility - Moved within same county (%) - Asian
Geographical mobility - Moved within same county (%) - Hispanic or Latino
Geographical mobility - Moved within same county (%) - American Indian and Alaska Native
Geographical mobility - Moved within same county (%) - Multirace
Geographical mobility - Moved within same county (%) - Other Race
Geographical mobility - Moved from different county within same state (%)
Geographical mobility - Moved from different county within same state (%) - White
Geographical mobility - Moved from different county within same state (%) - Black or African American
Geographical mobility - Moved from different county within same state (%) - Asian
Geographical mobility - Moved from different county within same state (%) - Hispanic or Latino
Geographical mobility - Moved from different county within same state (%) - American Indian and Alaska Native
Geographical mobility - Moved from different county within same state (%) - Multirace
Geographical mobility - Moved from different county within same state (%) - Other Race
Geographical mobility - Moved from different state (%)
Geographical mobility - Moved from different state (%) - White
Geographical mobility - Moved from different state (%) - Black or African American
Geographical mobility - Moved from different state (%) - Asian
Geographical mobility - Moved from different state (%) - Hispanic or Latino
Geographical mobility - Moved from different state (%) - American Indian and Alaska Native
Geographical mobility - Moved from different state (%) - Multirace
Geographical mobility - Moved from different state (%) - Other Race
Geographical mobility - Moved from abroad (%)
Geographical mobility - Moved from abroad (%) - White
Geographical mobility - Moved from abroad (%) - Black or African American
Geographical mobility - Moved from abroad (%) - Asian
Geographical mobility - Moved from abroad (%) - Hispanic or Latino
Geographical mobility - Moved from abroad (%) - American Indian and Alaska Native
Geographical mobility - Moved from abroad (%) - Multirace
Geographical mobility - Moved from abroad (%) - Other Race
Place of birth for the foreign-born population - Ireland (%)
Place of birth for the foreign-born population - Denmark (%)
Place of birth for the foreign-born population - Norway (%)
Place of birth for the foreign-born population - Sweden (%)
Place of birth for the foreign-born population - United Kingdom (%)
Place of birth for the foreign-born population - England (%)
Place of birth for the foreign-born population - Scotland (%)
Place of birth for the foreign-born population - Other Northern Europe (%)
Place of birth for the foreign-born population - Austria (%)
Place of birth for the foreign-born population - Belgium (%)
Place of birth for the foreign-born population - France (%)
Place of birth for the foreign-born population - Germany (%)
Place of birth for the foreign-born population - Netherlands (%)
Place of birth for the foreign-born population - Switzerland (%)
Place of birth for the foreign-born population - Other Western Europe (%)
Place of birth for the foreign-born population - Greece (%)
Place of birth for the foreign-born population - Italy (%)
Place of birth for the foreign-born population - Portugal (%)
Place of birth for the foreign-born population - Spain (%)
Place of birth for the foreign-born population - Other Southern Europe (%)
Place of birth for the foreign-born population - Albania (%)
Place of birth for the foreign-born population - Belarus (%)
Place of birth for the foreign-born population - Bosnia and Herzegovina (%)
Place of birth for the foreign-born population - Bulgaria (%)
Place of birth for the foreign-born population - Croatia (%)
Place of birth for the foreign-born population - Czechoslovakia (%)
Place of birth for the foreign-born population - Hungary (%)
Place of birth for the foreign-born population - Latvia (%)
Place of birth for the foreign-born population - Lithuania (%)
Place of birth for the foreign-born population - North Macedonia (Macedonia) (%)
Place of birth for the foreign-born population - Moldova (%)
Place of birth for the foreign-born population - Poland (%)
Place of birth for the foreign-born population - Romania (%)
Place of birth for the foreign-born population - Russia (%)
Place of birth for the foreign-born population - Serbia (%)
Place of birth for the foreign-born population - Ukraine (%)
Place of birth for the foreign-born population - Other Eastern Europe (%)
Place of birth for the foreign-born population - China (%)
Place of birth for the foreign-born population - Hong Kong (%)
Place of birth for the foreign-born population - Taiwan (%)
Place of birth for the foreign-born population - Japan (%)
Place of birth for the foreign-born population - Korea (%)
Place of birth for the foreign-born population - Other Eastern Asia (%)
Place of birth for the foreign-born population - Afghanistan (%)
Place of birth for the foreign-born population - Bangladesh (%)
Place of birth for the foreign-born population - India (%)
Place of birth for the foreign-born population - Iran (%)
Place of birth for the foreign-born population - Kazakhstan (%)
Place of birth for the foreign-born population - Nepal (%)
Place of birth for the foreign-born population - Pakistan (%)
Place of birth for the foreign-born population - Sri Lanka (%)
Place of birth for the foreign-born population - Uzbekistan (%)
Place of birth for the foreign-born population - Other South Central Asia (%)
Place of birth for the foreign-born population - Burma (%)
Place of birth for the foreign-born population - Cambodia (%)
Place of birth for the foreign-born population - Indonesia (%)
Place of birth for the foreign-born population - Laos (%)
Place of birth for the foreign-born population - Malaysia (%)
Place of birth for the foreign-born population - Philippines (%)
Place of birth for the foreign-born population - Singapore (%)
Place of birth for the foreign-born population - Thailand (%)
Place of birth for the foreign-born population - Vietnam (%)
Place of birth for the foreign-born population - Other South Eastern Asia (%)
Place of birth for the foreign-born population - Armenia (%)
Place of birth for the foreign-born population - Iraq (%)
Place of birth for the foreign-born population - Israel (%)
Place of birth for the foreign-born population - Jordan (%)
Place of birth for the foreign-born population - Kuwait (%)
Place of birth for the foreign-born population - Lebanon (%)
Place of birth for the foreign-born population - Saudi Arabia (%)
Place of birth for the foreign-born population - Syria (%)
Place of birth for the foreign-born population - Turkey (%)
Place of birth for the foreign-born population - Yemen (%)
Place of birth for the foreign-born population - Other Western Asia (%)
Place of birth for the foreign-born population - Eritrea (%)
Place of birth for the foreign-born population - Ethiopia (%)
Place of birth for the foreign-born population - Kenya (%)
Place of birth for the foreign-born population - Somalia (%)
Place of birth for the foreign-born population - Uganda (%)
Place of birth for the foreign-born population - Zimbabwe (%)
Place of birth for the foreign-born population - Other Eastern Africa (%)
Place of birth for the foreign-born population - Cameroon (%)
Place of birth for the foreign-born population - Congo (%)
Place of birth for the foreign-born population - Democratic Republic of Congo (Zaire) (%)
Place of birth for the foreign-born population - Other Middle Africa (%)
Place of birth for the foreign-born population - Egypt (%)
Place of birth for the foreign-born population - Morocco (%)
Place of birth for the foreign-born population - Sudan (%)
Place of birth for the foreign-born population - Other Northern Africa (%)
Place of birth for the foreign-born population - South Africa (%)
Place of birth for the foreign-born population - Other Southern Africa (%)
Place of birth for the foreign-born population - Cabo Verde (%)
Place of birth for the foreign-born population - Ghana (%)
Place of birth for the foreign-born population - Liberia (%)
Place of birth for the foreign-born population - Nigeria (%)
Place of birth for the foreign-born population - Senegal (%)
Place of birth for the foreign-born population - Sierra Leone (%)
Place of birth for the foreign-born population - Other Western Africa (%)
Place of birth for the foreign-born population - Australia (%)
Place of birth for the foreign-born population - New Zealand (%)
Place of birth for the foreign-born population - Fiji (%)
Place of birth for the foreign-born population - Micronesia (%)
Place of birth for the foreign-born population - Bahamas (%)
Place of birth for the foreign-born population - Barbados (%)
Place of birth for the foreign-born population - Cuba (%)
Place of birth for the foreign-born population - Dominica (%)
Place of birth for the foreign-born population - Dominican Republic (%)
Place of birth for the foreign-born population - Grenada (%)
Place of birth for the foreign-born population - Haiti (%)
Place of birth for the foreign-born population - Jamaica (%)
Place of birth for the foreign-born population - St. Vincent and the Grenadines (%)
Place of birth for the foreign-born population - Trinidad and Tobago (%)
Place of birth for the foreign-born population - West Indies (%)
Place of birth for the foreign-born population - Other Caribbean (%)
Place of birth for the foreign-born population - Belize (%)
Place of birth for the foreign-born population - Costa Rica (%)
Place of birth for the foreign-born population - El Salvador (%)
Place of birth for the foreign-born population - Guatemala (%)
Place of birth for the foreign-born population - Honduras (%)
Place of birth for the foreign-born population - Mexico (%)
Place of birth for the foreign-born population - Nicaragua (%)
Place of birth for the foreign-born population - Panama (%)
Place of birth for the foreign-born population - Other Central America (%)
Place of birth for the foreign-born population - Argentina (%)
Place of birth for the foreign-born population - Bolivia (%)
Place of birth for the foreign-born population - Brazil (%)
Place of birth for the foreign-born population - Chile (%)
Place of birth for the foreign-born population - Colombia (%)
Place of birth for the foreign-born population - Ecuador (%)
Place of birth for the foreign-born population - Guyana (%)
Place of birth for the foreign-born population - Peru (%)
Place of birth for the foreign-born population - Uruguay (%)
Place of birth for the foreign-born population - Venezuela (%)
Place of birth for the foreign-born population - Other South America (%)
Place of birth for the foreign-born population - Canada (%)
Place of birth for the foreign-born population - Other Northern America (%)
Place of birth for the foreign-born population - Other (%)
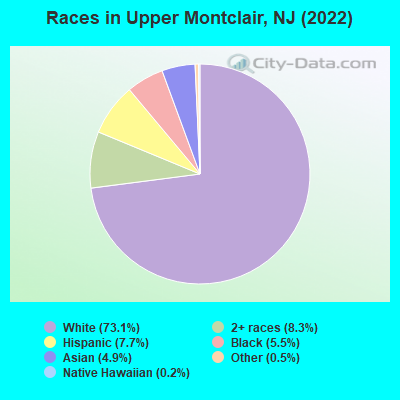
According to 2022 data, the most numerous races in Upper Montclair, NJ are White alone (9,055 residents), Hispanic (956 residents), and Black alone (683 residents). 87.5% of Upper Montclair residents speak English at home.
Race distribution in Upper Montclair 9,055 73.1% White alone 1,026 8.3% Two or more races 956 7.7% Hispanic 683 5.5% Black alone 605 4.9% Asian alone 63 0.5% Other race alone 19 0.2% Native Hawaiian and Other
2000 2022
5,557,209 66.0% White alone 1,117,191 13.3% Hispanic 1,096,171 13.0% Black alone 477,012 5.7% Asian alone 133,689 1.6% Two or more races 19,565 0.2% Other race alone 11,338 0.1% American Indian alone 2,175 0.03% Native Hawaiian and Other
4,766,476 51.5% White alone 2,028,470 21.9% Hispanic 1,111,632 12.0% Black alone 923,546 10.0% Asian alone 332,237 3.6% Two or more races 89,847 1.0% Other race alone 8,557 0.09% American Indian alone 934 0.01% Native Hawaiian and Other
Income and house value in Upper Montclair Median household income in 2022 over $200,000 White non-Hispanic householdersover $200,000 Black householders$170,824 Asian householdersover $200,000 Hispanic or Latino race householders
Median age by race in Upper Montclair
45.8 Median age for White residents44.0 48.0 27.7 Median age for Black or African American residents28.2 20.0 21.5 Median age for American Indian / Alaska Native residents-723,484,847.8 19.0 41.7 Median age for Asian residents40.5 43.3 -804,177,544.9 Median age for Native Hawaiian / Pacific Islander residents-860,335,194.7 -713,070,378.3 22.1 Median age for Other race residents26.8 22.1 19.4 Median age for Two or more races residents17.9 21.1 45.0 Median age for White alone residents42.7 46.8 23.0 Median age for Hispanic or Latino residents27.1 22.2
Owner/renter occupied households by race in Upper Montclair
House owners and renters - White residents 2,857 85.9% Owner occupied467 14.1% Renter occupiedHouse owners and renters - Black or African American residents 145 86.7% Owner occupied22 13.3% Renter occupiedHouse owners and renters - American Indian / Alaska Native residents 12 100.0% Renter occupiedHouse owners and renters - Asian residents 153 75.8% Owner occupied49 24.2% Renter occupiedHouse owners and renters - Other race residents 42 100.0% Owner occupiedHouse owners and renters - Two or more races residents 202 96.0% Owner occupied8 4.0% Renter occupiedHouse owners and renters - White alone residents 2,872 83.4% Owner occupied571 16.6% Renter occupiedHouse owners and renters - Hispanic or Latino residents 149 81.2% Owner occupied35 18.8% Renter occupied
Language usage in Upper Montclair
English speakers - Total 87.5% of residents of Upper Montclair speak English at home.
4.1% of residents speak Spanish at home 373 79.4% Speak English very well97 20.6% Speak English less than very well9.5% of residents speak other language at home 844 76.9% Speak English very well253 23.1% Speak English less than very well
English speakers - Born in the United States 94.2% of residents of Upper Montclair speak English at home.
1.8% of residents speak Spanish at home 92 84.4% Speak English very well17 15.6% Speak English less than very well4.6% of residents speak other language at home 269 96.8% Speak English very well9 3.2% Speak English less than very well
English speakers - Native, born elsewhere 75.7% of residents of Upper Montclair speak English at home.
16.6% of residents speak Spanish at home 30 100.0% Speak English very well9.9% of residents speak other language at home 18 100.0% Speak English very well
English speakers - Foreign-born 46.7% of residents of Upper Montclair speak English at home.
14.1% of residents speak Spanish at home 149 71.6% Speak English very well59 28.4% Speak English less than very well42.2% of residents speak other language at home 373 59.9% Speak English very well250 40.1% Speak English less than very well
White (Caucasian) - Speak only English Native:
100.0% (7,486)Foreign-born:
51.8% (283)
White (Caucasian) - Speak another language Native:
3.6% (268)Foreign-born:
59.5% (325)
Black or African American - Speak only English Native:
98.1% (540)Foreign-born:
78.9% (49)
Black or African American - Speak another language Native:
2.0% (11)Foreign-born:
24.7% (15)
Asian - Speak only English Native:
86.8% (208)Foreign-born:
50.8% (185)
Asian - Speak another language Native:
16.2% (39)Foreign-born:
52.5% (191)
Other race - Speak only English Native:
34.7% (72)Foreign-born:
51.1% (44)
Other race - Speak another language Native:
65.6% (136)Foreign-born:
63.0% (54)
Two or more races - Speak only English Native:
86.1% (1,071)Foreign-born:
70.8% (100)
Two or more races - Speak another language Native:
15.7% (195)Foreign-born:
43.7% (62)
White alone - Speak only English Native:
95.7% (7,566)Foreign-born:
43.8% (282)
White alone - Speak another language Native:
4.5% (357)Foreign-born:
58.1% (374)
Hispanic or Latino - Speak only English Native:
53.0% (304)Foreign-born:
24.9% (71)
Hispanic or Latino - Speak another language Native:
49.0% (281)Foreign-born:
80.4% (228)
Foreign-born residents in Upper Montclair
Marital status for residents in Upper Montclair Marital status - White (Caucasian) population 15 years and over
Males 26.2% Never married68.0% Now married0.9% Separated1.9% Widowed3.0% DivorcedFemales 22.9% Never married64.0% Now married0.8% Separated4.7% Widowed7.6% DivorcedWomen who gave birth in the past 12 months Now married:
100.0% (82)Unmarried:
0.0% (0)
Women who did not give birth in the past 12 months Now married:
54.7% (824)Unmarried:
45.3% (681)
Marital status - Black or African American population 15 years and over
Males 41.9% Never married58.1% Now married0.0% Separated0.0% Widowed0.0% DivorcedFemales 20.2% Never married55.8% Now married4.3% Separated0.0% Widowed19.7% DivorcedWomen who gave birth in the past 12 months Now married:
0.0% (0)Unmarried:
93.0% (1)
Women who did not give birth in the past 12 months Now married:
72.0% (105)Unmarried:
28.0% (41)
Marital status - American Indian / Alaska Native population 15 years and over
Males 100.0% Never married0.0% Now married0.0% Separated0.0% Widowed0.0% DivorcedFemales 100.0% Never married0.0% Now married0.0% Separated0.0% Widowed0.0% DivorcedWomen who did not give birth in the past 12 months Now married:
0.0% (0)Unmarried:
100.0% (23)
Marital status - Asian population 15 years and over
Males 25.4% Never married74.6% Now married0.0% Separated0.0% Widowed0.0% DivorcedFemales 35.4% Never married64.6% Now married0.0% Separated0.0% Widowed0.0% DivorcedWomen who did not give birth in the past 12 months Now married:
58.9% (111)Unmarried:
41.1% (77)
Marital status - Other race population 15 years and over
Males 25.8% Never married48.4% Now married0.0% Separated0.0% Widowed25.8% DivorcedFemales 18.9% Never married79.2% Now married0.0% Separated0.0% Widowed1.9% DivorcedWomen who did not give birth in the past 12 months Now married:
80.8% (55)Unmarried:
19.2% (13)
Marital status - Two or more races population 15 years and over
Males 42.3% Never married57.7% Now married0.0% Separated0.0% Widowed0.0% DivorcedFemales 51.0% Never married49.0% Now married0.0% Separated0.0% Widowed0.0% DivorcedWomen who gave birth in the past 12 months Now married:
100.0% (23)Unmarried:
0.0% (0)
Women who did not give birth in the past 12 months Now married:
18.3% (67)Unmarried:
81.7% (300)
Marital status - White alone, not Hispanic / Latino population 15 years and over
Males 26.6% Never married67.5% Now married0.9% Separated2.0% Widowed3.1% DivorcedFemales 23.0% Never married64.0% Now married0.9% Separated4.3% Widowed7.9% DivorcedWomen who gave birth in the past 12 months Now married:
100.0% (94)Unmarried:
0.0% (0)
Women who did not give birth in the past 12 months Now married:
54.4% (905)Unmarried:
45.6% (758)
Marital status - Hispanic or Latino population 15 years and over
Males 32.2% Never married63.0% Now married0.0% Separated0.0% Widowed4.8% DivorcedFemales 32.6% Never married58.7% Now married0.0% Separated8.3% Widowed0.4% DivorcedWomen who gave birth in the past 12 months Now married:
100.0% (8)Unmarried:
0.0% (0)
Women who did not give birth in the past 12 months Now married:
45.7% (76)Unmarried:
54.3% (90)
Ancestries in Upper Montclair
483 8.9% Irish369 6.8% Italian358 6.6% European315 5.8% German285 5.3% English245 4.5% American177 3.3% Eastern European134 2.5% Polish125 2.3% Iranian90 1.7% Turkish76 1.4% Greek69 1.3% Russian62 1.1% Scottish62 1.1% Scotch-Irish49 0.9% Romanian45 0.8% Portuguese37 0.7% Egyptian31 0.6% British29 0.5% Lebanese28 0.5% Hungarian26 0.5% Brazilian24 0.4% Haitian19 0.4% Canadian17 0.3% Lithuanian17 0.3% Jamaican16 0.3% Swedish14 0.3% Dutch14 0.3% Slovene14 0.3% Ghanaian13 0.2% Welsh10 0.2% Scandinavian9 0.2% French Canadian8 0.1% French8 0.1% British West Indian8 0.1% Trinidadian and Tobagonian7 0.1% Czech7 0.1% Northern European5 0.09% Ukrainian4 0.07% Croatian4 0.07% Finnish
Children Nativity (place of birth) in Upper Montclair
Children under 6 years - Living with two parents Both parents native 983 100.0% NativeBoth parents foreign-born 78 100.0% NativeOne native, one foreign-born parent 98 100.0% NativeChildren under 6 years - Living with one parent Native parent 21 100.0% NativeForeign-born parent 7 100.0% NativeChildren 6 to 17 years - Living with two parents Both parents native 1,706 97.7% Native40 2.3% Foreign-bornBoth parents foreign-born 147 87.2% Native22 12.8% Foreign-bornOne native, one foreign-born parent 475 99.1% Native4 0.9% Foreign-bornChildren 6 to 17 years - Living with one parent Native parent 109 100.0% Native
Grandparents responsible for own grandchildren in Upper Montclair
Grandparents (30 to 59 years) American Indian / Alaska Native 15 100.0% Not responsible for grandchildrenHispanic or Latino 6 100.0% Not responsible for grandchildren
Grandparents (60 years and over)