Races in Union, New Jersey (NJ) Detailed Stats
Ancestries, Foreign-born residents, place of birth

Recent posts about races in Union, New Jersey on our local forum with over 2,400,000 registered users:
 | Lookin to purchase a house in Union, NJ (1 reply) |
| NJ House/Locations Recommendations (10 replies) |
| What can $400k get me in Union County? (3 replies) |
| Found house in Union, NJ help me to decide. (3 replies) |
| Ethnic enclaves in New Jersey (11 replies) |
| Early Voting Election Results So Far?? (173 replies) |
Latest news about races in Union, NJ collected exclusively by city-data.com from local newspapers, TV, and radio stations
24.6% of Union, NJ residents are foreign-born (9.7% born in Europe, 7.1% born in Latin America, 5.7% born in Asia), which is 6.3% greater than the foreign-born rate of 23.0% across the entire state of New Jersey.
Race distribution in Union

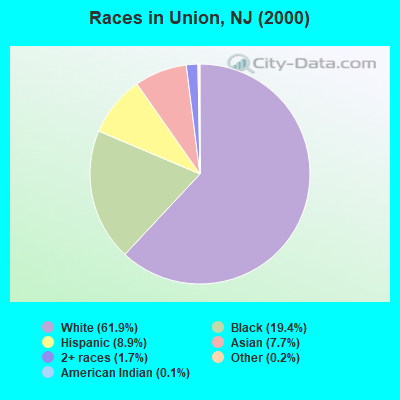
- 33,66161.9%White alone
- 10,56319.4%Black alone
- 4,8618.9%Hispanic
- 4,1917.7%Asian alone
- 9481.7%Two or more races
- 1070.2%Other race alone
- 650.1%American Indian alone
- 90.02%Native Hawaiian and Other
Pacific Islander alone
2000
2022
-
- 5,557,20966.0%White alone
- 1,117,19113.3%Hispanic
- 1,096,17113.0%Black alone
- 477,0125.7%Asian alone
- 133,6891.6%Two or more races
- 19,5650.2%Other race alone
- 11,3380.1%American Indian alone
- 2,1750.03%Native Hawaiian and Other
Pacific Islander alone

-
- 4,766,47651.5%White alone
- 2,028,47021.9%Hispanic
- 1,111,63212.0%Black alone
- 923,54610.0%Asian alone
- 332,2373.6%Two or more races
- 89,8471.0%Other race alone
- 8,5570.09%American Indian alone
- 9340.01%Native Hawaiian and Other
Pacific Islander alone

Income and house value in Union
- Median household income in 2022
- $113,710White non-Hispanic householders
- $98,490Black householders
- $114,444American Indian and Alaska Native householders
- $182,913Asian householders
- $117,355Some other race householders
- $132,348Two or more races householders
- $130,961Hispanic or Latino race householders
- Median 2022 house value
- $470,290White Non-Hispanic householders
- $424,421Black or African American householders
- $505,905American Indian or Alaska Native householders
- $489,716Asian householders
- $472,178Some other race householders
- $481,352Two or more races householders
- $482,431Hispanic or Latino householders
Household income for White non-Hispanic householders

Household income for Black householders

Household income for American Indian and Alaska Native householders

Household income for Asian householders

Household income for Two or more races householders

Household income for Hispanic or Latino race householders

Foreign-born residents in Union
13,360 residents are foreign born (9.7% Europe, 7.1% Latin America, 5.7% Asia).
| This city: | 24.6% |
| New Jersey: | 17.5% |
Ancestries in Union

- 17,52929.9%Other
- 9,37816.0%Italian
- 5,5389.5%German
- 5,3959.2%Irish
- 4,8968.4%Polish
- 3,7256.4%Portuguese
- 1,9773.4%West Indian
- 1,5902.7%United States
- 1,4162.4%English
- 1,2652.2%Subsaharan African
- 1,0451.8%Ukrainian
- 8931.5%Russian
- 6041.0%Hungarian
- 5230.9%Greek
- 4430.8%Slovak
- 3340.6%Czech
- 3220.5%French
- 3030.5%Scottish
- 2410.4%Arab
- 2410.4%Scotch-Irish
- 1920.3%Dutch
- 1850.3%Lithuanian
- 1550.3%Swedish
- 1330.2%Norwegian
- 990.2%Swiss
- 650.1%Welsh
- 590.1%French Canadian
- 500.09%Danish

Zip codes: 07083.