Races in Union Hill-Novelty Hill, Washington (WA) Detailed Stats
Data:
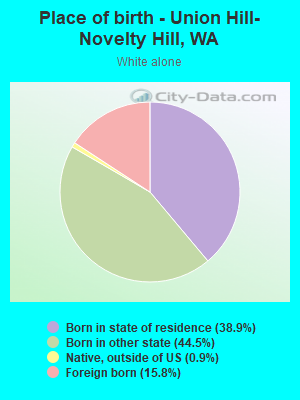
Races - White alone (%)
Races - White alone (% change since 2000)
Races - Black alone (%)
Races - Black alone (% change since 2000)
Races - American Indian alone (%)
Races - American Indian alone (% change since 2000)
Races - Asian alone (%)
Races - Asian alone (% change since 2000)
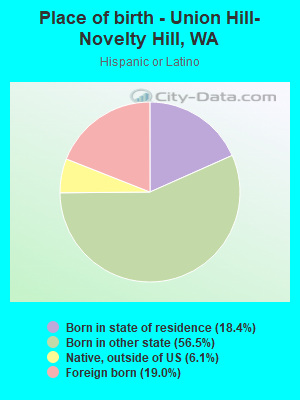
Races - Hispanic (%)
Races - Hispanic (% change since 2000)
Races - Native Hawaiian and Other Pacific Islander alone (%)
Races - Native Hawaiian and Other Pacific Islander alone (% change since 2000)
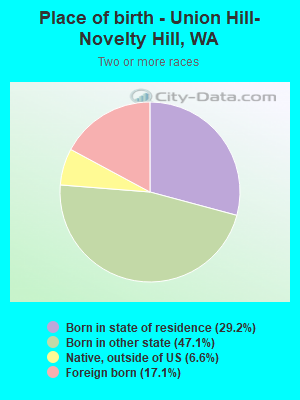
Races - Two or more races(%)
Races - Two or more races(% change since 2000)
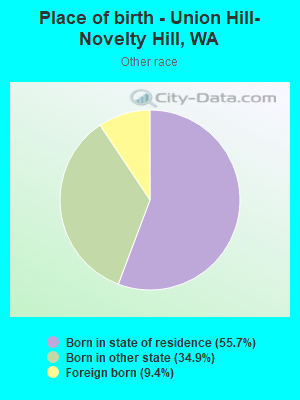
Races - Other race alone (%)
Races - Other race alone (% change since 2000)
Racial diversity
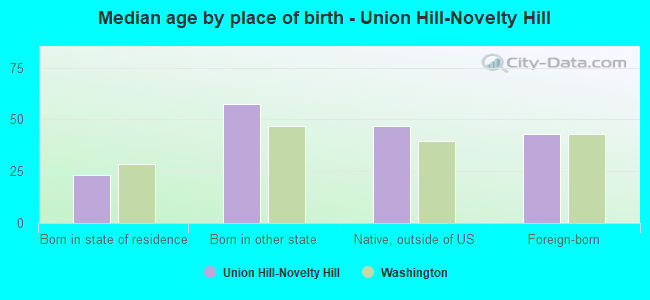
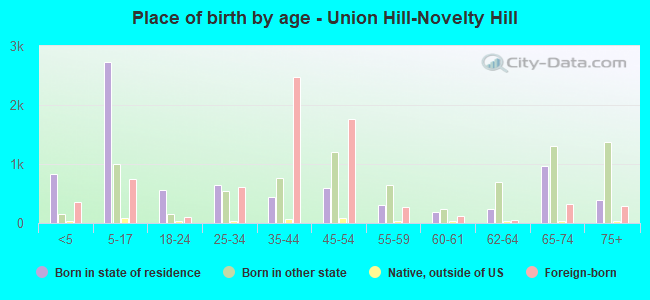
Place of birth - Born in state of residence (%)
Place of birth - Born in state of residence (%) - White
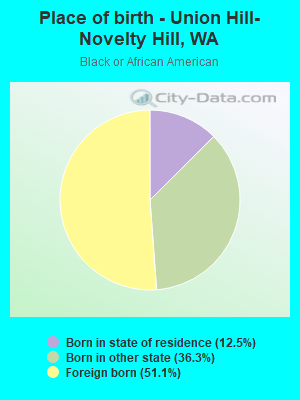
Place of birth - Born in state of residence (%) - Black or African American
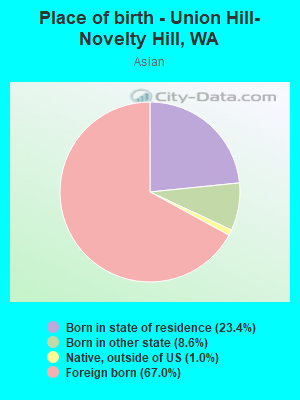
Place of birth - Born in state of residence (%) - Asian
Place of birth - Born in state of residence (%) - Hispanic or Latino
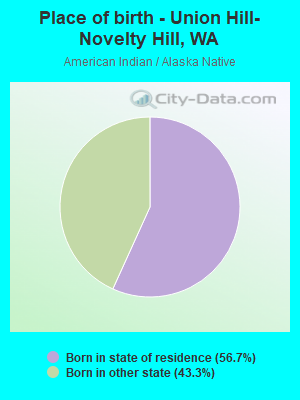
Place of birth - Born in state of residence (%) - American Indian and Alaska Native
Place of birth - Born in state of residence (%) - Multirace
Place of birth - Born in state of residence (%) - Other Race
Place of birth - Born in other state (%)
Place of birth - Born in other state (%) - White
Place of birth - Born in other state (%) - Black or African American
Place of birth - Born in other state (%) - Asian
Place of birth - Born in other state (%) - Hispanic or Latino
Place of birth - Born in other state (%) - American Indian and Alaska Native
Place of birth - Born in other state (%) - Multirace
Place of birth - Born in other state (%) - Other Race
Place of birth - Native, outside of US (%)
Place of birth - Native, outside of US (%) - White
Place of birth - Native, outside of US (%) - Black or African American
Place of birth - Native, outside of US (%) - Asian
Place of birth - Native, outside of US (%) - Hispanic or Latino
Place of birth - Native, outside of US (%) - American Indian and Alaska Native
Place of birth - Native, outside of US (%) - Multirace
Place of birth - Native, outside of US (%) - Other Race
Place of birth - Foreign born (%)
Place of birth - Foreign born (%) - White
Place of birth - Foreign born (%) - Black or African American
Place of birth - Foreign born (%) - Asian
Place of birth - Foreign born (%) - Hispanic or Latino
Place of birth - Foreign born (%) - American Indian and Alaska Native
Place of birth - Foreign born (%) - Multirace
Place of birth - Foreign born (%) - Other Race
Residents speaking English at home (%)
Residents speaking English at home - Born in the United States (%)
Residents speaking English at home - Native, born elsewhere (%)
Residents speaking English at home - Foreign born (%)
Residents speaking Spanish at home (%)
Residents speaking Spanish at home - Born in the United States (%)
Residents speaking Spanish at home - Native, born elsewhere (%)
Residents speaking Spanish at home - Foreign born (%)
Residents speaking other language at home (%)
Residents speaking other language at home - Born in the United States (%)
Residents speaking other language at home - Native, born elsewhere (%)
Residents speaking other language at home - Foreign born (%)
Marital status - Never married (%)
Marital status - Now married (%)
Marital status - Separated (%)
Marital status - Widowed (%)
Marital status - Divorced (%)
Ancestries Reported - Arab (%)
Ancestries Reported - Czech (%)
Ancestries Reported - Danish (%)
Ancestries Reported - Dutch (%)
Ancestries Reported - English (%)
Ancestries Reported - French (%)
Ancestries Reported - French Canadian (%)
Ancestries Reported - German (%)
Ancestries Reported - Greek (%)
Ancestries Reported - Hungarian (%)
Ancestries Reported - Irish (%)
Ancestries Reported - Italian (%)
Ancestries Reported - Lithuanian (%)
Ancestries Reported - Norwegian (%)
Ancestries Reported - Polish (%)
Ancestries Reported - Portuguese (%)
Ancestries Reported - Russian (%)
Ancestries Reported - Scotch-Irish (%)
Ancestries Reported - Scottish (%)
Ancestries Reported - Slovak (%)
Ancestries Reported - Subsaharan African (%)
Ancestries Reported - Swedish (%)
Ancestries Reported - Swiss (%)
Ancestries Reported - Ukrainian (%)
Ancestries Reported - United States (%)
Ancestries Reported - Welsh (%)
Ancestries Reported - West Indian (%)
Ancestries Reported - Other (%)
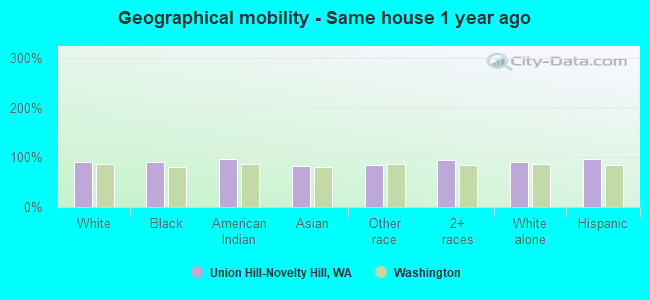
Geographical mobility - Same house 1 year ago (%)
Geographical mobility - Same house 1 year ago (%) - White
Geographical mobility - Same house 1 year ago (%) - Black or African American
Geographical mobility - Same house 1 year ago (%) - Asian
Geographical mobility - Same house 1 year ago (%) - Hispanic or Latino
Geographical mobility - Same house 1 year ago (%) - American Indian and Alaska Native
Geographical mobility - Same house 1 year ago (%) - Multirace
Geographical mobility - Same house 1 year ago (%) - Other Race
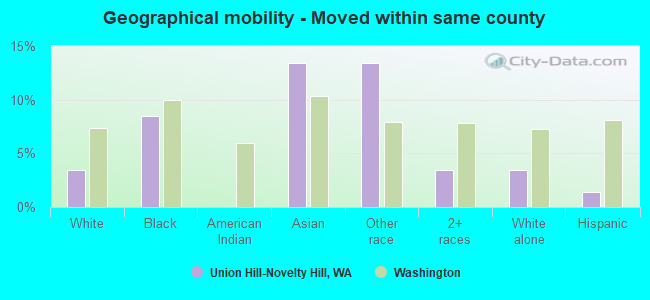
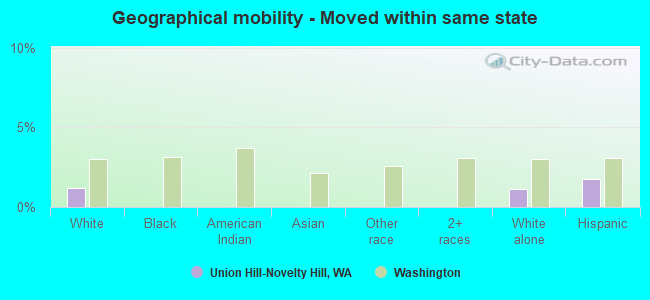
Geographical mobility - Moved within same county (%)
Geographical mobility - Moved within same county (%) - White
Geographical mobility - Moved within same county (%) - Black or African American
Geographical mobility - Moved within same county (%) - Asian
Geographical mobility - Moved within same county (%) - Hispanic or Latino
Geographical mobility - Moved within same county (%) - American Indian and Alaska Native
Geographical mobility - Moved within same county (%) - Multirace
Geographical mobility - Moved within same county (%) - Other Race
Geographical mobility - Moved from different county within same state (%)
Geographical mobility - Moved from different county within same state (%) - White
Geographical mobility - Moved from different county within same state (%) - Black or African American
Geographical mobility - Moved from different county within same state (%) - Asian
Geographical mobility - Moved from different county within same state (%) - Hispanic or Latino
Geographical mobility - Moved from different county within same state (%) - American Indian and Alaska Native
Geographical mobility - Moved from different county within same state (%) - Multirace
Geographical mobility - Moved from different county within same state (%) - Other Race
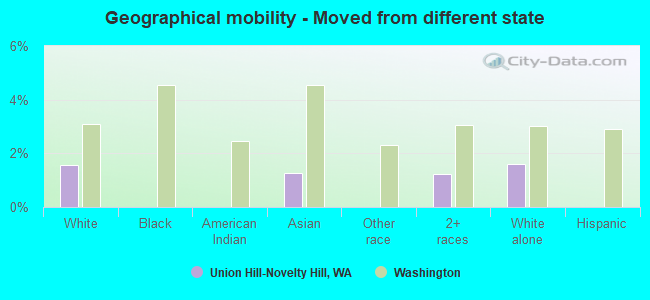
Geographical mobility - Moved from different state (%)
Geographical mobility - Moved from different state (%) - White
Geographical mobility - Moved from different state (%) - Black or African American
Geographical mobility - Moved from different state (%) - Asian
Geographical mobility - Moved from different state (%) - Hispanic or Latino
Geographical mobility - Moved from different state (%) - American Indian and Alaska Native
Geographical mobility - Moved from different state (%) - Multirace
Geographical mobility - Moved from different state (%) - Other Race
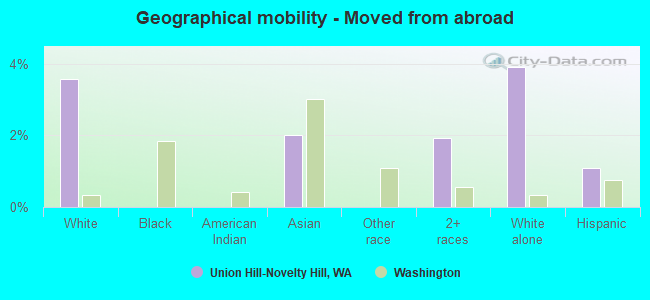
Geographical mobility - Moved from abroad (%)
Geographical mobility - Moved from abroad (%) - White
Geographical mobility - Moved from abroad (%) - Black or African American
Geographical mobility - Moved from abroad (%) - Asian
Geographical mobility - Moved from abroad (%) - Hispanic or Latino
Geographical mobility - Moved from abroad (%) - American Indian and Alaska Native
Geographical mobility - Moved from abroad (%) - Multirace
Geographical mobility - Moved from abroad (%) - Other Race
Place of birth for the foreign-born population - Ireland (%)
Place of birth for the foreign-born population - Denmark (%)
Place of birth for the foreign-born population - Norway (%)
Place of birth for the foreign-born population - Sweden (%)
Place of birth for the foreign-born population - United Kingdom (%)
Place of birth for the foreign-born population - England (%)
Place of birth for the foreign-born population - Scotland (%)
Place of birth for the foreign-born population - Other Northern Europe (%)
Place of birth for the foreign-born population - Austria (%)
Place of birth for the foreign-born population - Belgium (%)
Place of birth for the foreign-born population - France (%)
Place of birth for the foreign-born population - Germany (%)
Place of birth for the foreign-born population - Netherlands (%)
Place of birth for the foreign-born population - Switzerland (%)
Place of birth for the foreign-born population - Other Western Europe (%)
Place of birth for the foreign-born population - Greece (%)
Place of birth for the foreign-born population - Italy (%)
Place of birth for the foreign-born population - Portugal (%)
Place of birth for the foreign-born population - Spain (%)
Place of birth for the foreign-born population - Other Southern Europe (%)
Place of birth for the foreign-born population - Albania (%)
Place of birth for the foreign-born population - Belarus (%)
Place of birth for the foreign-born population - Bosnia and Herzegovina (%)
Place of birth for the foreign-born population - Bulgaria (%)
Place of birth for the foreign-born population - Croatia (%)
Place of birth for the foreign-born population - Czechoslovakia (%)
Place of birth for the foreign-born population - Hungary (%)
Place of birth for the foreign-born population - Latvia (%)
Place of birth for the foreign-born population - Lithuania (%)
Place of birth for the foreign-born population - North Macedonia (Macedonia) (%)
Place of birth for the foreign-born population - Moldova (%)
Place of birth for the foreign-born population - Poland (%)
Place of birth for the foreign-born population - Romania (%)
Place of birth for the foreign-born population - Russia (%)
Place of birth for the foreign-born population - Serbia (%)
Place of birth for the foreign-born population - Ukraine (%)
Place of birth for the foreign-born population - Other Eastern Europe (%)
Place of birth for the foreign-born population - China (%)
Place of birth for the foreign-born population - Hong Kong (%)
Place of birth for the foreign-born population - Taiwan (%)
Place of birth for the foreign-born population - Japan (%)
Place of birth for the foreign-born population - Korea (%)
Place of birth for the foreign-born population - Other Eastern Asia (%)
Place of birth for the foreign-born population - Afghanistan (%)
Place of birth for the foreign-born population - Bangladesh (%)
Place of birth for the foreign-born population - India (%)
Place of birth for the foreign-born population - Iran (%)
Place of birth for the foreign-born population - Kazakhstan (%)
Place of birth for the foreign-born population - Nepal (%)
Place of birth for the foreign-born population - Pakistan (%)
Place of birth for the foreign-born population - Sri Lanka (%)
Place of birth for the foreign-born population - Uzbekistan (%)
Place of birth for the foreign-born population - Other South Central Asia (%)
Place of birth for the foreign-born population - Burma (%)
Place of birth for the foreign-born population - Cambodia (%)
Place of birth for the foreign-born population - Indonesia (%)
Place of birth for the foreign-born population - Laos (%)
Place of birth for the foreign-born population - Malaysia (%)
Place of birth for the foreign-born population - Philippines (%)
Place of birth for the foreign-born population - Singapore (%)
Place of birth for the foreign-born population - Thailand (%)
Place of birth for the foreign-born population - Vietnam (%)
Place of birth for the foreign-born population - Other South Eastern Asia (%)
Place of birth for the foreign-born population - Armenia (%)
Place of birth for the foreign-born population - Iraq (%)
Place of birth for the foreign-born population - Israel (%)
Place of birth for the foreign-born population - Jordan (%)
Place of birth for the foreign-born population - Kuwait (%)
Place of birth for the foreign-born population - Lebanon (%)
Place of birth for the foreign-born population - Saudi Arabia (%)
Place of birth for the foreign-born population - Syria (%)
Place of birth for the foreign-born population - Turkey (%)
Place of birth for the foreign-born population - Yemen (%)
Place of birth for the foreign-born population - Other Western Asia (%)
Place of birth for the foreign-born population - Eritrea (%)
Place of birth for the foreign-born population - Ethiopia (%)
Place of birth for the foreign-born population - Kenya (%)
Place of birth for the foreign-born population - Somalia (%)
Place of birth for the foreign-born population - Uganda (%)
Place of birth for the foreign-born population - Zimbabwe (%)
Place of birth for the foreign-born population - Other Eastern Africa (%)
Place of birth for the foreign-born population - Cameroon (%)
Place of birth for the foreign-born population - Congo (%)
Place of birth for the foreign-born population - Democratic Republic of Congo (Zaire) (%)
Place of birth for the foreign-born population - Other Middle Africa (%)
Place of birth for the foreign-born population - Egypt (%)
Place of birth for the foreign-born population - Morocco (%)
Place of birth for the foreign-born population - Sudan (%)
Place of birth for the foreign-born population - Other Northern Africa (%)
Place of birth for the foreign-born population - South Africa (%)
Place of birth for the foreign-born population - Other Southern Africa (%)
Place of birth for the foreign-born population - Cabo Verde (%)
Place of birth for the foreign-born population - Ghana (%)
Place of birth for the foreign-born population - Liberia (%)
Place of birth for the foreign-born population - Nigeria (%)
Place of birth for the foreign-born population - Senegal (%)
Place of birth for the foreign-born population - Sierra Leone (%)
Place of birth for the foreign-born population - Other Western Africa (%)
Place of birth for the foreign-born population - Australia (%)
Place of birth for the foreign-born population - New Zealand (%)
Place of birth for the foreign-born population - Fiji (%)
Place of birth for the foreign-born population - Micronesia (%)
Place of birth for the foreign-born population - Bahamas (%)
Place of birth for the foreign-born population - Barbados (%)
Place of birth for the foreign-born population - Cuba (%)
Place of birth for the foreign-born population - Dominica (%)
Place of birth for the foreign-born population - Dominican Republic (%)
Place of birth for the foreign-born population - Grenada (%)
Place of birth for the foreign-born population - Haiti (%)
Place of birth for the foreign-born population - Jamaica (%)
Place of birth for the foreign-born population - St. Vincent and the Grenadines (%)
Place of birth for the foreign-born population - Trinidad and Tobago (%)
Place of birth for the foreign-born population - West Indies (%)
Place of birth for the foreign-born population - Other Caribbean (%)
Place of birth for the foreign-born population - Belize (%)
Place of birth for the foreign-born population - Costa Rica (%)
Place of birth for the foreign-born population - El Salvador (%)
Place of birth for the foreign-born population - Guatemala (%)
Place of birth for the foreign-born population - Honduras (%)
Place of birth for the foreign-born population - Mexico (%)
Place of birth for the foreign-born population - Nicaragua (%)
Place of birth for the foreign-born population - Panama (%)
Place of birth for the foreign-born population - Other Central America (%)
Place of birth for the foreign-born population - Argentina (%)
Place of birth for the foreign-born population - Bolivia (%)
Place of birth for the foreign-born population - Brazil (%)
Place of birth for the foreign-born population - Chile (%)
Place of birth for the foreign-born population - Colombia (%)
Place of birth for the foreign-born population - Ecuador (%)
Place of birth for the foreign-born population - Guyana (%)
Place of birth for the foreign-born population - Peru (%)
Place of birth for the foreign-born population - Uruguay (%)
Place of birth for the foreign-born population - Venezuela (%)
Place of birth for the foreign-born population - Other South America (%)
Place of birth for the foreign-born population - Canada (%)
Place of birth for the foreign-born population - Other Northern America (%)
Place of birth for the foreign-born population - Other (%)
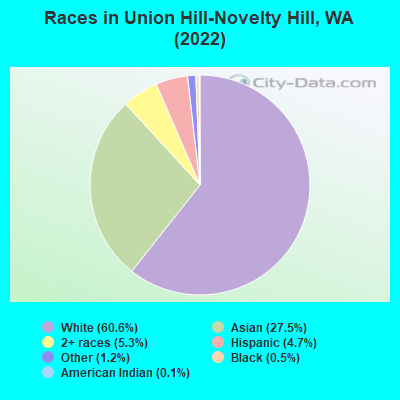
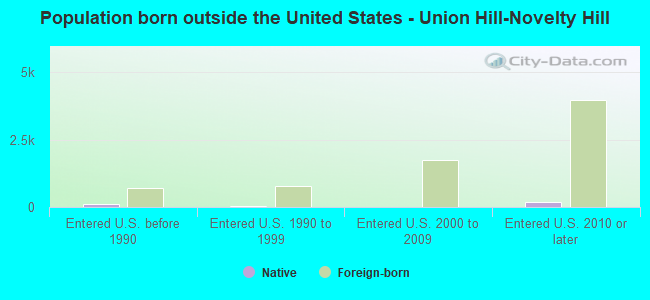
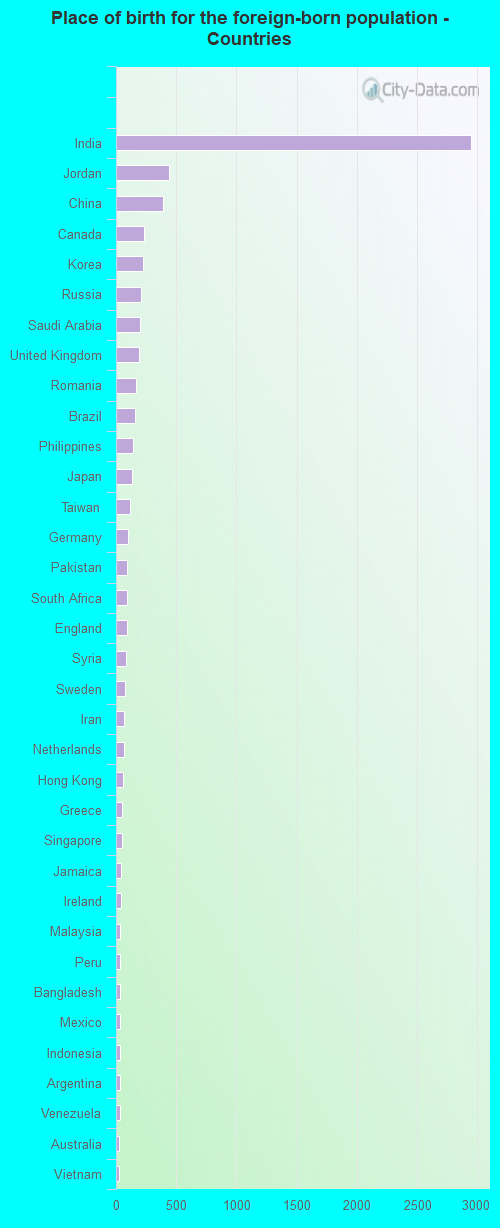
According to 2022 data, the most numerous races in Union Hill-Novelty Hill, WA are White alone (14,110 residents), Hispanic (1,085 residents), and Asian alone (6,409 residents). 68.0% of Union Hill-Novelty Hill residents speak English at home. 30.3% of Union Hill-Novelty Hill, WA residents are foreign-born (21.2% born in Asia, 4.6% born in Europe), which is 50.5% greater than the foreign-born rate of 15.0% across the entire state of Washington.
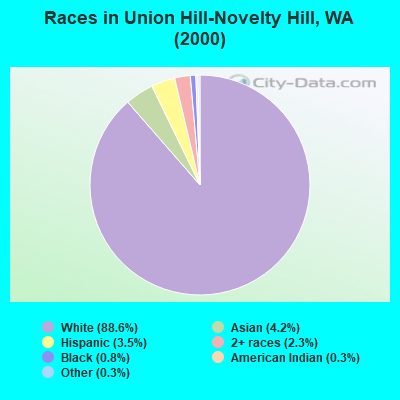
Race distribution in Union Hill-Novelty Hill
2000 2022
4,652,490 78.9% White alone 441,509 7.5% Hispanic 319,401 5.4% Asian alone 184,631 3.1% Black alone 175,926 3.0% Two or more races 85,396 1.4% American Indian alone 22,779 0.4% Native Hawaiian and Other 11,989 0.2% Other race alone
4,941,456 63.5% White alone 1,093,313 14.0% Hispanic 755,832 9.7% Asian alone 523,448 6.7% Two or more races 299,537 3.8% Black alone 69,024 0.9% American Indian alone 52,231 0.7% Native Hawaiian and Other 50,945 0.7% Other race alone
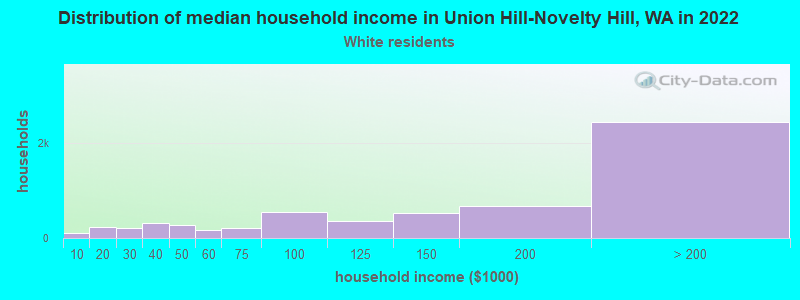
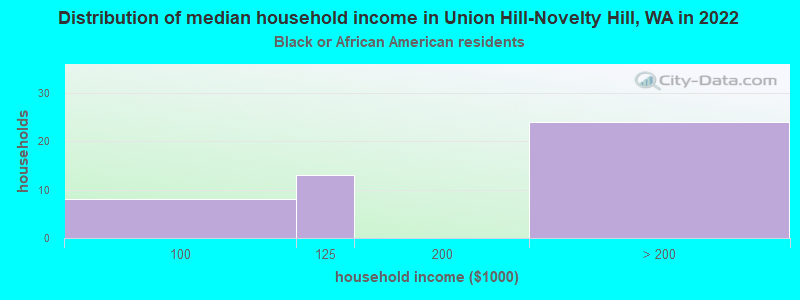
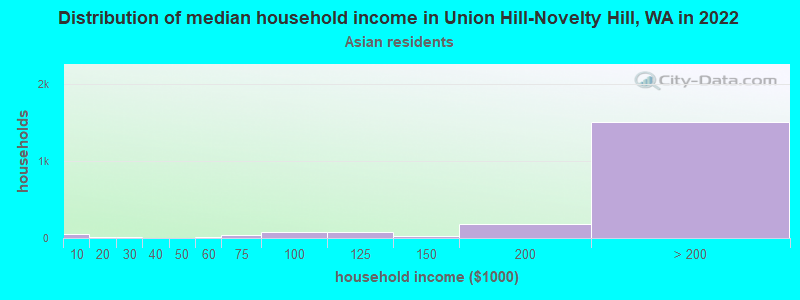
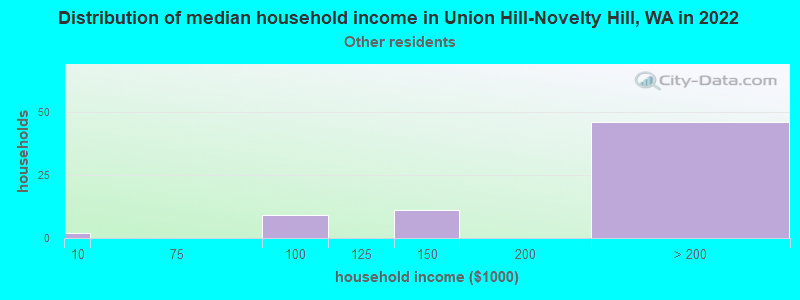
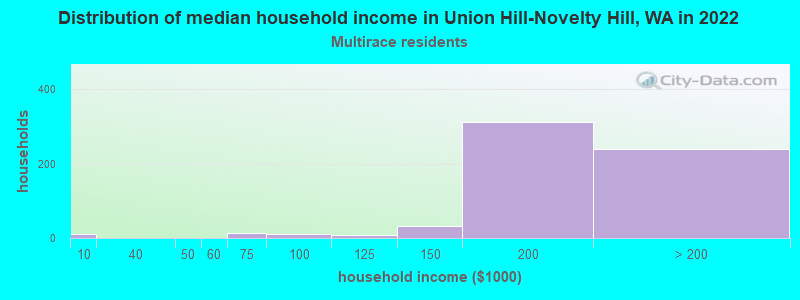
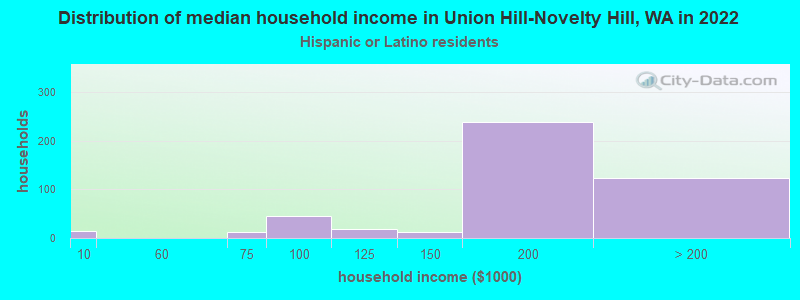
Income and house value in Union Hill-Novelty Hill Median household income in 2022 $150,423 White non-Hispanic householdersover $200,000 Asian householdersover $200,000 Some other race householders$172,183 Two or more races householders$177,194 Hispanic or Latino race householdersMedian 2022 house value over $1,000,000 White Non-Hispanic householders$823,792 Black or African American householders$581,555 American Indian or Alaska Native householders over $1,000,000 Asian householdersover $1,000,000 Two or more races householders$852,948 Hispanic or Latino householders
Median age by race in Union Hill-Novelty Hill
50.1 Median age for White residents49.4 51.5 54.6 Median age for Black or African American residents67.1 47.7 10.2 Median age for American Indian / Alaska Native residents6.9 -631,249,999.4 38.7 Median age for Asian residents40.7 37.4 -653,927,812.5 Median age for Native Hawaiian / Pacific Islander residents-664,509,168.7 -651,945,320.1 39.9 Median age for Other race residents51.7 32.5 35.2 Median age for Two or more races residents23.0 36.9 49.6 Median age for White alone residents49.3 50.5 49.8 Median age for Hispanic or Latino residents45.8 52.1
Owner/renter occupied households by race in Union Hill-Novelty Hill
House owners and renters - White residents 4,901 82.2% Owner occupied1,061 17.8% Renter occupiedHouse owners and renters - Black or African American residents 39 100.0% Owner occupiedHouse owners and renters - Asian residents 1,743 87.6% Owner occupied247 12.4% Renter occupiedHouse owners and renters - Other race residents 61 100.0% Owner occupiedHouse owners and renters - Two or more races residents 621 96.2% Owner occupied24 3.8% Renter occupiedHouse owners and renters - White alone residents 4,862 82.3% Owner occupied1,045 17.7% Renter occupiedHouse owners and renters - Hispanic or Latino residents 403 91.2% Owner occupied39 8.8% Renter occupied
Language usage in Union Hill-Novelty Hill
English speakers - Total 68.0% of residents of Union Hill-Novelty Hill speak English at home.
2.3% of residents speak Spanish at home 412 82.2% Speak English very well89 17.8% Speak English less than very well30.0% of residents speak other language at home 5,358 81.2% Speak English very well1,241 18.8% Speak English less than very well
English speakers - Born in the United States 93.4% of residents of Union Hill-Novelty Hill speak English at home.
1.9% of residents speak Spanish at home 149 100.0% Speak English very well4.3% of residents speak other language at home 326 96.2% Speak English very well13 3.8% Speak English less than very well
English speakers - Native, born elsewhere 61.3% of residents of Union Hill-Novelty Hill speak English at home.
24.9% of residents speak Spanish at home 76 100.0% Speak English very well15.1% of residents speak other language at home 36 78.3% Speak English very well10 21.7% Speak English less than very well
English speakers - Foreign-born 18.8% of residents of Union Hill-Novelty Hill speak English at home.
3.0% of residents speak Spanish at home 161 79.7% Speak English very well41 20.3% Speak English less than very well79.4% of residents speak other language at home 4,254 79.7% Speak English very well1,084 20.3% Speak English less than very well
White (Caucasian) - Speak only English Native:
95.5% (10,790)Foreign-born:
35.2% (648)
White (Caucasian) - Speak another language Native:
4.6% (514)Foreign-born:
64.7% (1,191)
Black or African American - Speak only English Native:
100.0% (59)Foreign-born:
85.7% (49)
Asian - Speak only English Native:
59.4% (1,159)Foreign-born:
10.6% (455)
Asian - Speak another language Native:
40.1% (782)Foreign-born:
89.4% (3,843)
Other race - Speak another language Native:
8.5% (32)Foreign-born:
100.0% (39)
Two or more races - Speak only English Native:
86.3% (1,285)Foreign-born:
21.0% (72)
Two or more races - Speak another language Native:
13.1% (195)Foreign-born:
78.8% (269)
White alone - Speak only English Native:
95.6% (10,741)Foreign-born:
33.6% (652)
White alone - Speak another language Native:
4.5% (503)Foreign-born:
66.1% (1,283)
Hispanic or Latino - Speak only English Native:
72.8% (625)Foreign-born:
8.8% (18)
Hispanic or Latino - Speak another language Native:
25.9% (223)Foreign-born:
90.8% (187)
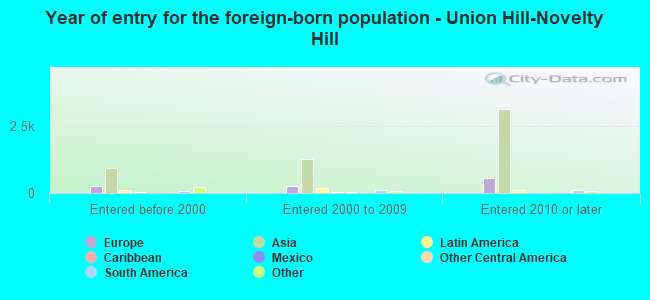
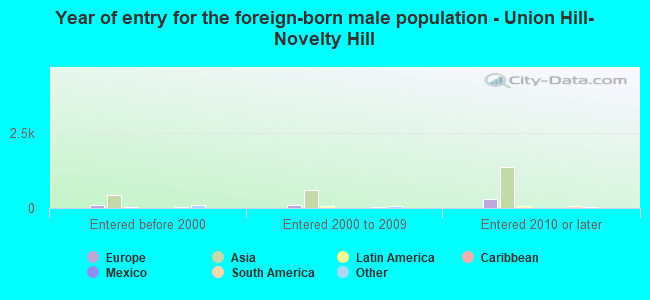
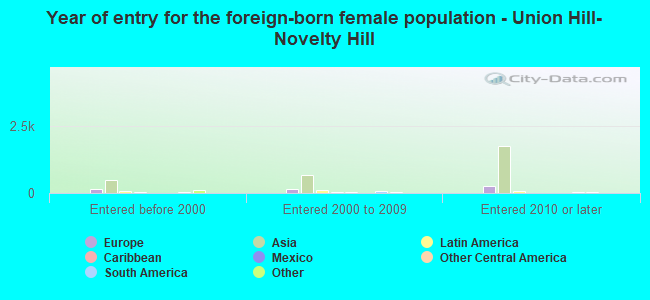
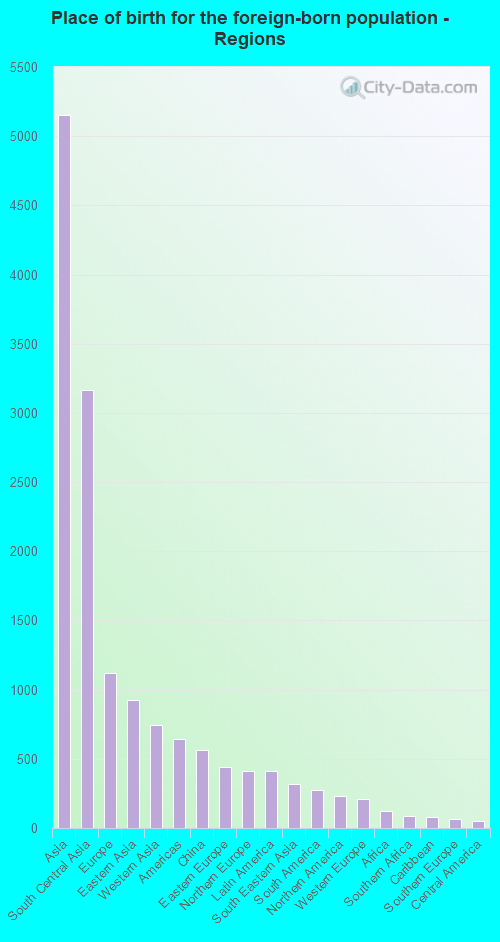
Foreign-born residents in Union Hill-Novelty Hill 7,067 residents are foreign born (21.2% Asia , 4.6% Europe ).
This city:
30.3%Washington:
14.9%
Marital status for residents in Union Hill-Novelty Hill Marital status - White (Caucasian) population 15 years and over
Males 16.1% Never married77.0% Now married0.3% Separated2.0% Widowed4.6% DivorcedFemales 16.4% Never married64.0% Now married0.8% Separated7.5% Widowed11.2% DivorcedWomen who gave birth in the past 12 months Now married:
100.0% (88)Unmarried:
0.0% (0)
Women who did not give birth in the past 12 months Now married:
60.0% (1,427)Unmarried:
40.0% (950)
Marital status - Black or African American population 15 years and over
Males 23.6% Never married76.4% Now married0.0% Separated0.0% Widowed0.0% DivorcedFemales 34.5% Never married32.8% Now married13.8% Separated0.0% Widowed19.0% DivorcedWomen who did not give birth in the past 12 months Now married:
53.5% (23)Unmarried:
46.5% (20)
Marital status - Asian population 15 years and over
Males 14.8% Never married82.0% Now married0.6% Separated0.6% Widowed2.1% DivorcedFemales 9.4% Never married84.4% Now married0.5% Separated2.0% Widowed3.6% DivorcedWomen who gave birth in the past 12 months Now married:
50.0% (22)Unmarried:
50.0% (22)
Women who did not give birth in the past 12 months Now married:
88.7% (1,597)Unmarried:
11.3% (203)
Marital status - Other race population 15 years and over
Males 32.1% Never married64.7% Now married0.0% Separated0.0% Widowed3.2% DivorcedFemales 49.6% Never married50.4% Now married0.0% Separated0.0% Widowed0.0% DivorcedWomen who gave birth in the past 12 months Now married:
100.0% (9)Unmarried:
0.0% (0)
Women who did not give birth in the past 12 months Now married:
6.8% (6)Unmarried:
93.2% (84)
Marital status - Two or more races population 15 years and over
Males 71.7% Never married26.6% Now married0.5% Separated0.0% Widowed1.3% DivorcedFemales 30.3% Never married64.5% Now married0.0% Separated3.4% Widowed1.8% DivorcedWomen who did not give birth in the past 12 months Now married:
45.9% (185)Unmarried:
54.1% (217)
Marital status - White alone, not Hispanic / Latino population 15 years and over
Males 15.6% Never married77.3% Now married0.3% Separated2.1% Widowed4.7% DivorcedFemales 16.7% Never married63.9% Now married0.8% Separated7.4% Widowed11.2% DivorcedWomen who gave birth in the past 12 months Now married:
100.0% (72)Unmarried:
0.0% (0)
Women who did not give birth in the past 12 months Now married:
59.9% (1,442)Unmarried:
40.1% (964)
Marital status - Hispanic or Latino population 15 years and over
Males 66.7% Never married32.2% Now married0.0% Separated0.0% Widowed1.0% DivorcedFemales 10.6% Never married74.5% Now married0.0% Separated8.7% Widowed6.2% DivorcedWomen who gave birth in the past 12 months Now married:
100.0% (27)Unmarried:
0.0% (0)
Women who did not give birth in the past 12 months Now married:
65.8% (76)Unmarried:
34.2% (40)
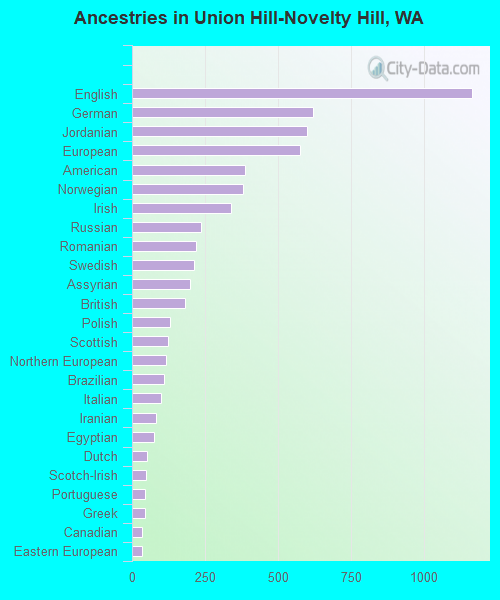
Ancestries in Union Hill-Novelty Hill
1,166 9.1% English620 4.8% German600 4.7% Jordanian575 4.5% European387 3.0% American382 3.0% Norwegian340 2.7% Irish237 1.8% Russian220 1.7% Romanian214 1.7% Swedish200 1.6% Assyrian181 1.4% British131 1.0% Polish124 1.0% Scottish118 0.9% Northern European111 0.9% Brazilian100 0.8% Italian82 0.6% Iranian75 0.6% Egyptian51 0.4% Dutch49 0.4% Scotch-Irish43 0.3% Portuguese43 0.3% Greek36 0.3% Canadian33 0.3% Eastern European33 0.3% Latvian30 0.2% Jamaican29 0.2% Scandinavian29 0.2% French26 0.2% Serbian21 0.2% Belgian18 0.1% French Canadian15 0.1% Australian14 0.1% Danish14 0.1% Austrian9 0.07% Swiss9 0.07% West Indian8 0.06% South African6 0.05% Welsh5 0.04% New Zealander4 0.03% Hungarian3 0.02% Finnish3 0.02% Estonian3 0.02% Icelander2 0.02% Ukrainian1 0.01% Armenian
Geographical mobility in Union Hill-Novelty Hill Same house 1 year ago 12,693 90.4% White (Caucasian)105 91.4% Black or African American32 96.7% American Indian / Alaska Native5,347 83.1% Asian345 85.3% Other race1,850 95.4% Two or more races12,667 90.1% White alone, not Hispanic / Latino1,025 96.1% Hispanic or LatinoMoved within same county 479 3.4% White / Caucasian10 8.5% Black or African American866 13.5% Asian54 13.4% Other race66 3.4% Two or more races488 3.5% White alone, not Hispanic / Latino15 1.4% Hispanic or LatinoMoved within same state 167 1.2% White / Caucasian157 1.1% White alone, not Hispanic / Latino19 1.7% Hispanic or LatinoMoved from different state 221 1.6% White / Caucasian81 1.3% Asian24 1.2% Two or more races227 1.6% White alone, not Hispanic / LatinoMoved from abroad 504 3.6% White130 2.0% Asian37 1.9% Two or more races549 3.9% White alone, not Hispanic / Latino11 1.1% Hispanic or Latino
Children Nativity (place of birth) in Union Hill-Novelty Hill
Children under 6 years - Living with two parents Both parents native 312 100.0% NativeBoth parents foreign-born 469 59.3% Native322 40.7% Foreign-bornOne native, one foreign-born parent 287 100.0% NativeChildren under 6 years - Living with one parent Native parent 222 100.0% NativeChildren 6 to 17 years - Living with two parents Both parents native 1,159 100.0% NativeBoth parents foreign-born 1,390 67.8% Native661 32.2% Foreign-bornOne native, one foreign-born parent 587 98.6% Native8 1.4% Foreign-bornChildren 6 to 17 years - Living with one parent Native parent 212 100.0% NativeForeign-born parent 79 62.1% Native48 37.9% Foreign-born
Grandparents responsible for own grandchildren in Union Hill-Novelty Hill
Grandparents (30 to 59 years) White / Caucasian 19 100.0% Not responsible for grandchildrenWhite alone, not Hispanic / Latino 21 100.0% Not responsible for grandchildrenGrandparents (60 years and over) White / Caucasian 68 33.7% Responsible for grandchildren135 66.3% Not responsible for grandchildrenWhite alone, not Hispanic / Latino 68 33.1% Responsible for grandchildren137 66.9% Not responsible for grandchildren