Races in Union City, Tennessee (TN) Detailed Stats
Ancestries, Foreign-born residents, place of birth
Settings
X


Recent posts about races in Union City, Tennessee on our local forum with over 2,400,000 registered users:
 | Tennessee's 2020 Census results (74 replies) |
| Looking for house/wooded acreage in NW Tennessee (18 replies) |
| Tennessee house in ashes after homeowner 'forgot' to pay $75 fee (77 replies) |
| Tennessee city populations 2015 (15 replies) |
| 2014 Population Estimates for Tennessee Cities (15 replies) |
| Memphis long term sustainability: The elephant in the room (40 replies) |
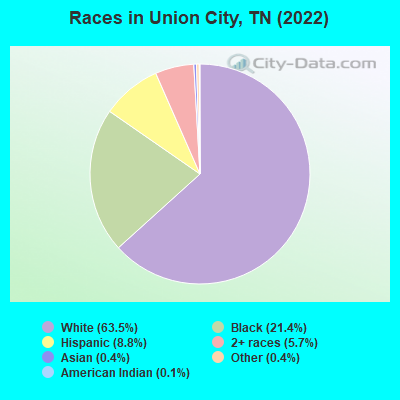
According to 2022 data, the most numerous races in Union City, TN are White alone (7,158 residents), Black alone (2,408 residents), and Hispanic (994 residents). 90.4% of Union City residents speak English at home. 4.7% of Union City, TN residents are foreign-born (4.1% born in Latin America), which is 6.3% less than the foreign-born rate of 5.0% across the entire state of Tennessee.
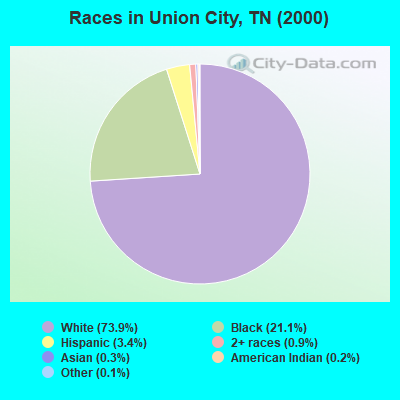
Race distribution in Union City
2000
2022

- 8,03873.9%White alone
- 2,29921.1%Black alone
- 3713.4%Hispanic
- 970.9%Two or more races
- 310.3%Asian alone
- 190.2%American Indian alone
- 150.1%Other race alone
- 60.06%Native Hawaiian and Other
Pacific Islander alone
-
- 7,15863.5%White alone
- 2,40821.4%Black alone
- 9948.8%Hispanic
- 6425.7%Two or more races
- 460.4%Asian alone
- 450.4%Other race alone
- 130.1%American Indian alone
2000
2022
-
- 4,505,93079.2%White alone
- 928,20416.3%Black alone
- 123,8382.2%Hispanic
- 54,8241.0%Two or more races
- 56,0771.0%Asian alone
- 13,8200.2%American Indian alone
- 4,7800.08%Other race alone
- 1,8100.03%Native Hawaiian and Other
Pacific Islander alone

-
- 5,070,02671.9%White alone
- 1,089,73815.5%Black alone
- 442,6296.3%Hispanic
- 279,3814.0%Two or more races
- 131,8171.9%Asian alone
- 26,9720.4%Other race alone
- 6,3870.09%American Indian alone
- 4,3890.06%Native Hawaiian and Other
Pacific Islander alone

Income and house value in Union City
- Median household income in 2022
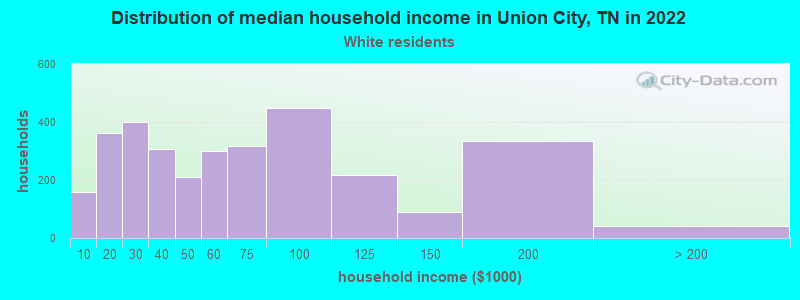
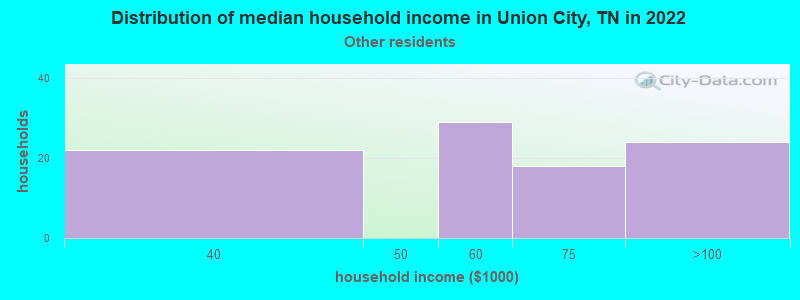
- $51,831White non-Hispanic householders
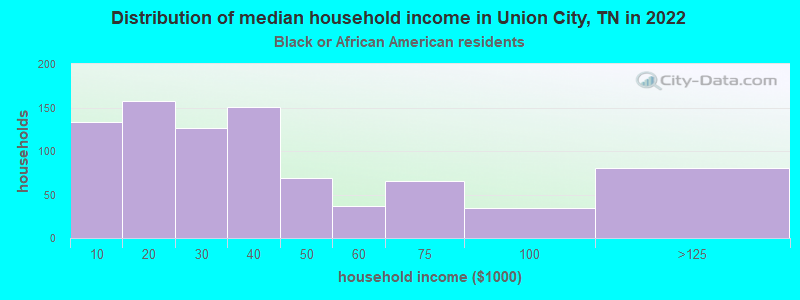
- $30,952Black householders
- $58,726Some other race householders
- $11,312Two or more races householders
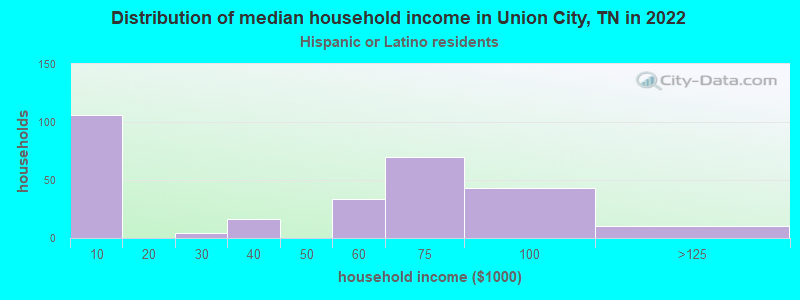
- $57,834Hispanic or Latino race householders
- Median 2022 house value
- $184,708White Non-Hispanic householders
- $107,394Black or African American householders
- $199,748Asian householders
- $223,248Native Hawaiian and other Pacific Islander householders
- $138,178Some other race householders
- $105,749Two or more races householders
- $162,853Hispanic or Latino householders
Household income for White non-Hispanic householders
Household income for Black householders
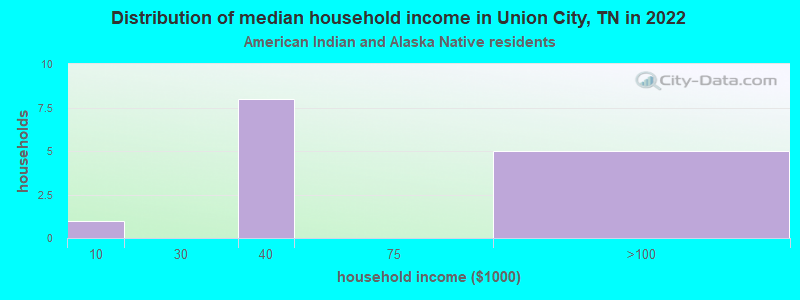
Household income for American Indian and Alaska Native householders
Household income for Some other race householders
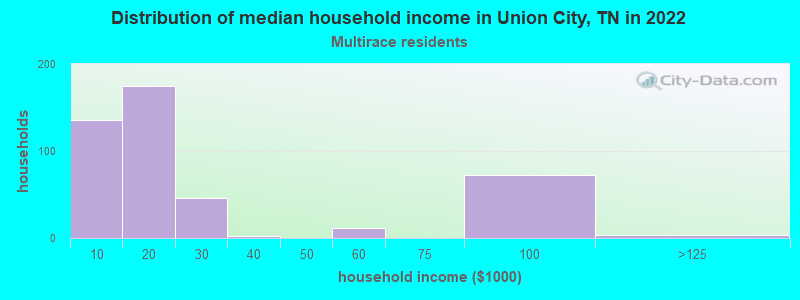
Household income for Two or more races householders
Household income for Hispanic or Latino race householders
Median age by race in Union City
- 42.1Median age for White residents
- 41.5Males
- 42.6Females
- 33.5Median age for Black or African American residents
- 34.7Males
- 32.4Females
- 46.3Median age for American Indian / Alaska Native residents
- 43.0Males
- -801,477,376.9Females
- 40.5Median age for Asian residents
- -662,846,226.7Males
- -686,648,500.7Females
- -885,813,147.9Median age for Native Hawaiian / Pacific Islander residents
- -951,707,890.7Males
- -735,930,735.2Females
- 34.3Median age for Other race residents
- 40.4Males
- 19.9Females
- 36.4Median age for Two or more races residents
- 24.5Males
- 38.6Females
- 42.1Median age for White alone residents
- 40.4Males
- 42.9Females
- 32.4Median age for Hispanic or Latino residents
- 32.7Males
- 26.8Females
Owner/renter occupied households by race in Union City
- House owners and renters - White residents
- 2,00662.3%Owner occupied
- 1,21337.7%Renter occupied
- House owners and renters - Black or African American residents
- 21924.3%Owner occupied
- 68075.7%Renter occupied
- House owners and renters - American Indian / Alaska Native residents
- 642.8%Owner occupied
- 857.2%Renter occupied
- House owners and renters - Asian residents
- 23100.0%Renter occupied
- House owners and renters - Other race residents
- 6163.5%Owner occupied
- 3536.5%Renter occupied
- House owners and renters - Two or more races residents
- 9420.7%Owner occupied
- 36179.3%Renter occupied
- House owners and renters - White alone residents
- 1,93560.9%Owner occupied
- 1,24239.1%Renter occupied
- House owners and renters - Hispanic or Latino residents
- 14653.3%Owner occupied
- 12846.7%Renter occupied
Language usage in Union City
- English speakers - Total
- 90.4% of residents of Union City speak English at home.
- 8.3% of residents speak Spanish at home
- 59367.2%Speak English very well
- 28932.8%Speak English less than very well
- 1.2% of residents speak other language at home
- 126100.0%Speak English very well
- English speakers - Born in the United States
- 95.9% of residents of Union City speak English at home.
- 2.2% of residents speak Spanish at home
- 59100.0%Speak English very well
- 2.0% of residents speak other language at home
- 54100.0%Speak English very well
All residents speak only English at home
- English speakers - Foreign-born
- 3.2% of residents of Union City speak English at home.
- 86.8% of residents speak Spanish at home
- 19742.9%Speak English very well
- 26257.1%Speak English less than very well
- 10.2% of residents speak other language at home
- 54100.0%Speak English very well
White (Caucasian) - Speak only English
| Native: | 97.0% (6,714) |
| Foreign-born: | 14.1% (15) |
White (Caucasian) - Speak another language
| Native: | 2.7% (189) |
| Foreign-born: | 80.2% (88) |
American Indian / Alaska Native - Speak another language
| Native: | 79.8% (15) |
| Foreign-born: | 100.0% (11) |
Asian - Speak another language
| Native: | 100.0% (12) |
| Foreign-born: | 100.0% (35) |
Other race - Speak another language
| Native: | 66.2% (105) |
| Foreign-born: | 100.0% (116) |
Two or more races - Speak another language
| Native: | 27.8% (240) |
| Foreign-born: | 99.8% (390) |
White alone - Speak another language
| Native: | 0.8% (54) |
| Foreign-born: | 100.0% (17) |
Hispanic or Latino - Speak only English
| Native: | 12.2% (63) |
| Foreign-born: | 3.4% (17) |
Hispanic or Latino - Speak another language
| Native: | 84.1% (430) |
| Foreign-born: | 97.0% (473) |
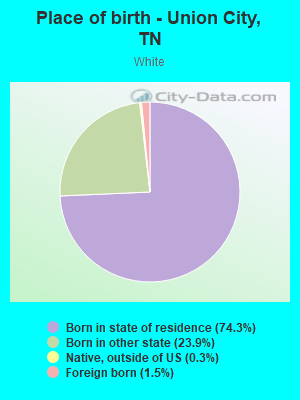
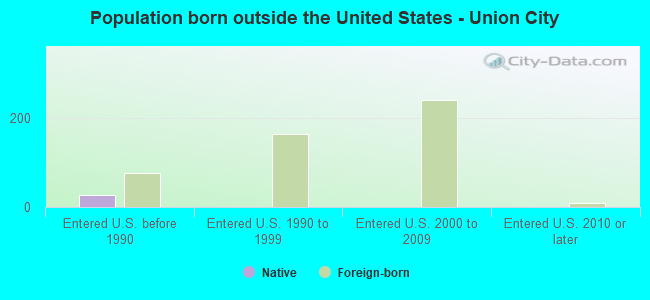
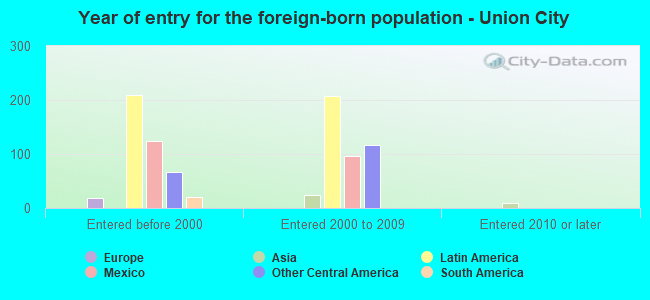
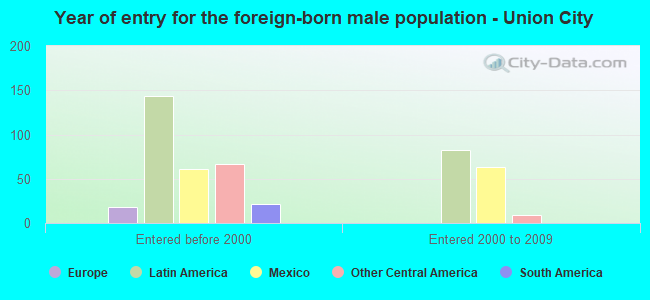
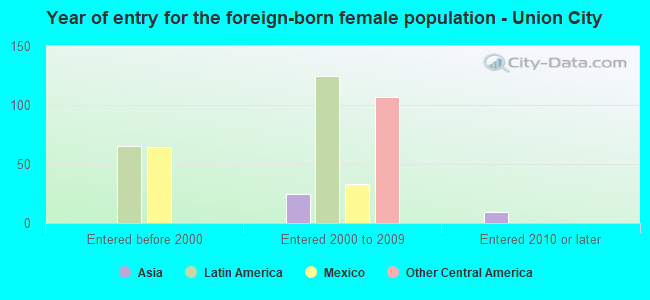
Foreign-born residents in Union City
530 residents are foreign born (4.1% Latin America).
| This city: | 4.7% |
| Tennessee: | 5.4% |
Marital status for residents in Union City
Marital status - White (Caucasian) population 15 years and over
- Males
- 26.8%Never married
- 57.6%Now married
- 1.9%Separated
- 2.7%Widowed
- 11.0%Divorced
- Females
- 24.1%Never married
- 44.6%Now married
- 2.8%Separated
- 16.9%Widowed
- 11.6%Divorced
Women who gave birth in the past 12 months
| Now married: | 100.0% (25) |
| Unmarried: | 0.0% (0) |
Women who did not give birth in the past 12 months
| Now married: | 47.4% (843) |
| Unmarried: | 52.6% (934) |
Marital status - Black or African American population 15 years and over
- Males
- 43.3%Never married
- 36.5%Now married
- 6.5%Separated
- 2.3%Widowed
- 11.4%Divorced
- Females
- 48.2%Never married
- 22.1%Now married
- 4.3%Separated
- 12.5%Widowed
- 13.0%Divorced
Women who gave birth in the past 12 months
| Now married: | 28.2% (32) |
| Unmarried: | 71.8% (82) |
Women who did not give birth in the past 12 months
| Now married: | 30.1% (141) |
| Unmarried: | 69.9% (326) |
Marital status - American Indian / Alaska Native population 15 years and over
- Males
- 0.0%Never married
- 23.8%Now married
- 38.1%Separated
- 0.0%Widowed
- 38.1%Divorced
- Females
- 0.0%Never married
- 100.0%Now married
- 0.0%Separated
- 0.0%Widowed
- 0.0%Divorced
Marital status - Asian population 15 years and over
- Males
- 100.0%Never married
- 0.0%Now married
- 0.0%Separated
- 0.0%Widowed
- 0.0%Divorced
- Females
- 0.0%Never married
- 23.5%Now married
- 0.0%Separated
- 0.0%Widowed
- 76.5%Divorced
Women who did not give birth in the past 12 months
| Now married: | 23.5% (8) |
| Unmarried: | 76.5% (27) |
Marital status - Other race population 15 years and over
- Males
- 22.4%Never married
- 77.6%Now married
- 0.0%Separated
- 0.0%Widowed
- 0.0%Divorced
- Females
- 75.2%Never married
- 24.8%Now married
- 0.0%Separated
- 0.0%Widowed
- 0.0%Divorced
Women who did not give birth in the past 12 months
| Now married: | 29.1% (38) |
| Unmarried: | 70.9% (93) |
Marital status - Two or more races population 15 years and over
- Males
- 9.9%Never married
- 53.6%Now married
- 1.5%Separated
- 14.6%Widowed
- 20.4%Divorced
- Females
- 40.7%Never married
- 28.6%Now married
- 0.3%Separated
- 8.4%Widowed
- 22.0%Divorced
Women who did not give birth in the past 12 months
| Now married: | 48.2% (143) |
| Unmarried: | 51.8% (153) |
Marital status - White alone, not Hispanic / Latino population 15 years and over
- Males
- 26.5%Never married
- 57.7%Now married
- 2.0%Separated
- 2.8%Widowed
- 11.0%Divorced
- Females
- 24.5%Never married
- 43.7%Now married
- 2.8%Separated
- 17.2%Widowed
- 11.8%Divorced
Women who gave birth in the past 12 months
| Now married: | 100.0% (25) |
| Unmarried: | 0.0% (0) |
Women who did not give birth in the past 12 months
| Now married: | 45.8% (804) |
| Unmarried: | 54.2% (950) |
Marital status - Hispanic or Latino population 15 years and over
- Males
- 22.5%Never married
- 71.1%Now married
- 2.3%Separated
- 0.0%Widowed
- 4.1%Divorced
- Females
- 35.7%Never married
- 63.2%Now married
- 0.0%Separated
- 1.1%Widowed
- 0.0%Divorced
Women who did not give birth in the past 12 months
| Now married: | 68.6% (197) |
| Unmarried: | 31.4% (90) |
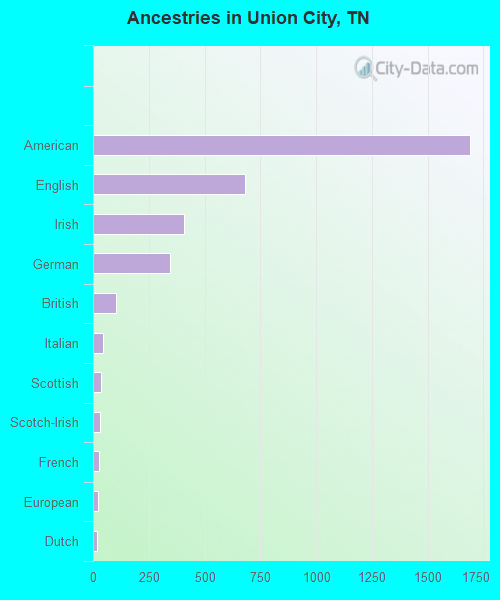
Ancestries in Union City

- 1,69125.1%American
- 68310.2%English
- 4106.1%Irish
- 3475.2%German
- 1031.5%British
- 450.7%Italian
- 360.5%Scottish
- 310.5%Scotch-Irish
- 270.4%French
- 210.3%European
- 160.2%Dutch
- 120.2%Polish
- 90.1%Canadian
- 30.04%Swedish
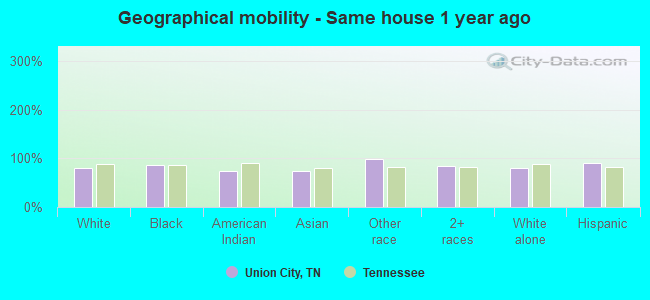
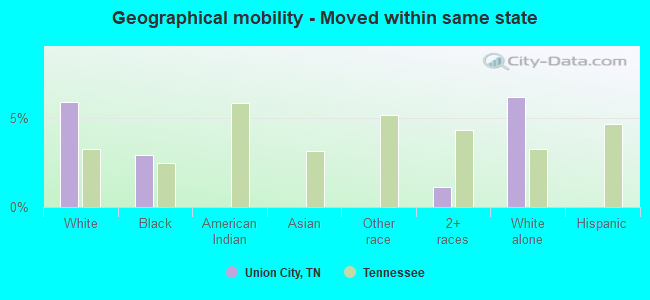
Geographical mobility in Union City

- Same house 1 year ago
- 5,89580.5%White (Caucasian)
- 2,07886.3%Black or African American
- 2074.0%American Indian / Alaska Native
- 3573.5%Asian
- 26599.0%Other race
- 1,11484.9%Two or more races
- 5,67279.7%White alone, not Hispanic / Latino
- 90691.0%Hispanic or Latino
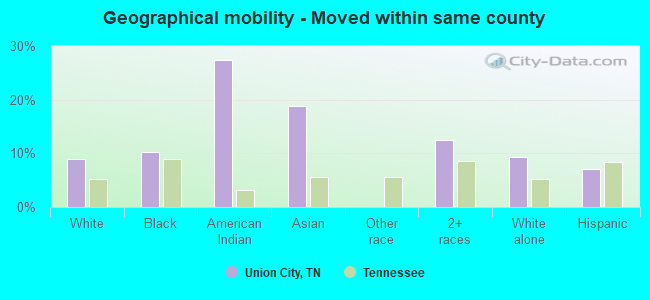
-
- Moved within same county
- 6609.0%White / Caucasian
- 24410.2%Black or African American
- 727.4%American Indian / Alaska Native
- 918.9%Asian
- 16312.4%Two or more races
- 6689.4%White alone, not Hispanic / Latino
- 717.1%Hispanic or Latino
-
- Moved within same state
- 4325.9%White / Caucasian
- 702.9%Black or African American
- 151.1%Two or more races
- 4386.1%White alone, not Hispanic / Latino
-
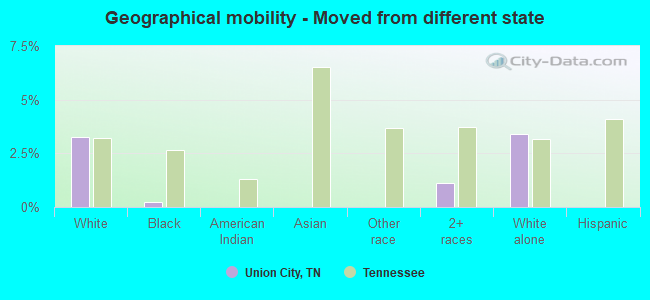
- Moved from different state
- 2393.3%White / Caucasian
- 50.2%Black or African American
- 151.1%Two or more races
- 2433.4%White alone, not Hispanic / Latino
-
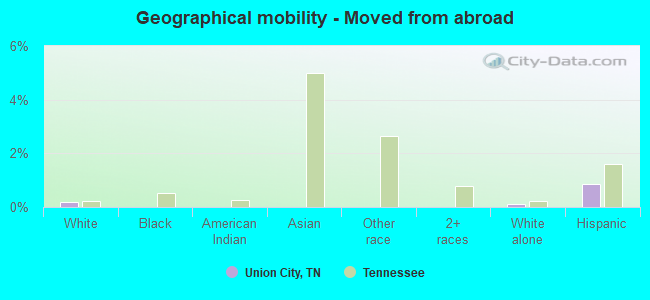
- Moved from abroad
- 140.2%White
- 80.1%White alone, not Hispanic / Latino
- 80.8%Hispanic or Latino
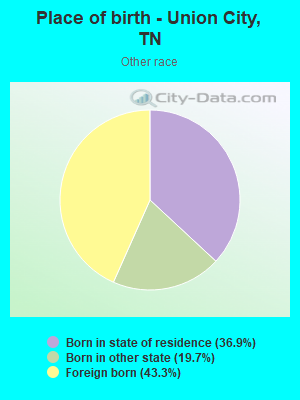
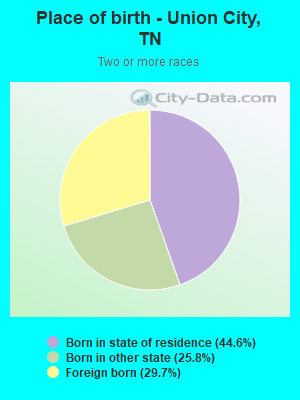
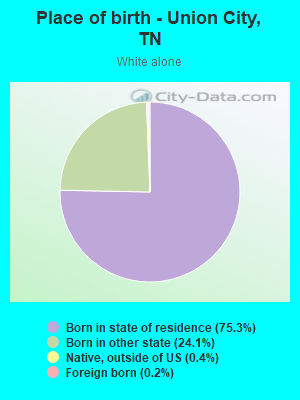
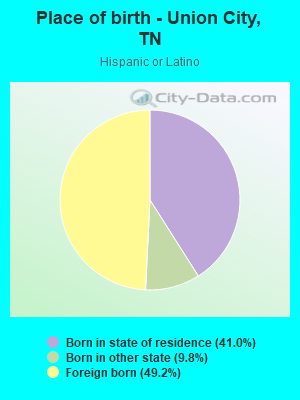
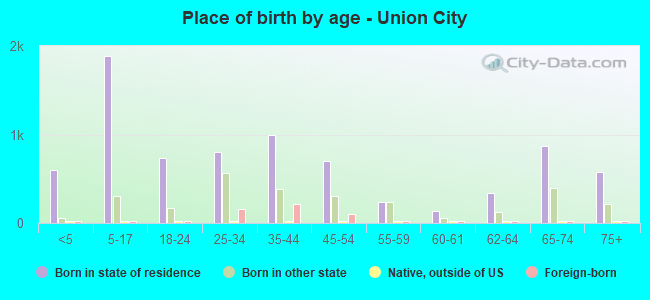
Children Nativity (place of birth) in Union City
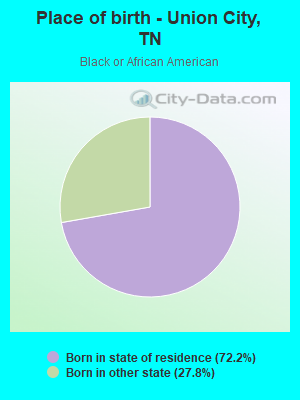
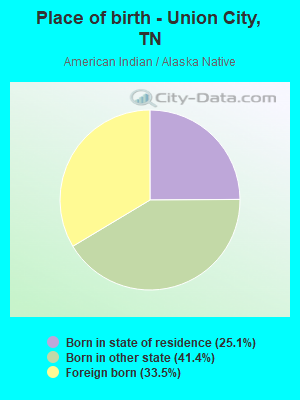
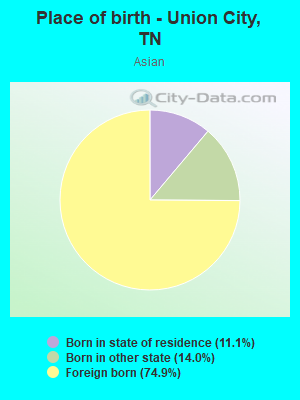
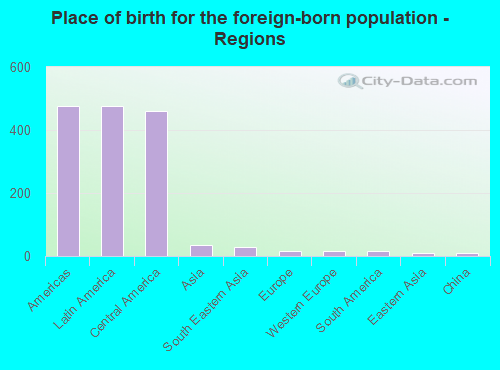
Place of birth for residents in Union City
![Place of birth for the foreign-born population - Regions]()
- 477Americas
- 477Latin America
- 459Central America
- 35Asia
- 27South Eastern Asia
- 17Europe
- 17Western Europe
- 17South America
- 8Eastern Asia
- 8China
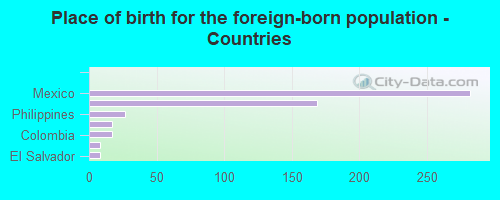
![Place of birth for the foreign-born population - Countries]()
- 282Mexico
- 169Guatemala
- 27Philippines
- 17Germany
- 17Colombia
- 8China
- 8El Salvador
Grandparents responsible for own grandchildren in Union City
Zip codes: 38261.