Races in Union City, Georgia (GA) Detailed Stats
Data:
Races - White alone (%)
Races - White alone (% change since 2000)
Races - Black alone (%)
Races - Black alone (% change since 2000)
Races - American Indian alone (%)
Races - American Indian alone (% change since 2000)
Races - Asian alone (%)
Races - Asian alone (% change since 2000)
Races - Hispanic (%)
Races - Hispanic (% change since 2000)
Races - Native Hawaiian and Other Pacific Islander alone (%)
Races - Native Hawaiian and Other Pacific Islander alone (% change since 2000)
Races - Two or more races(%)
Races - Two or more races(% change since 2000)
Races - Other race alone (%)
Races - Other race alone (% change since 2000)
Racial diversity
Place of birth - Born in state of residence (%)
Place of birth - Born in state of residence (%) - White
Place of birth - Born in state of residence (%) - Black or African American
Place of birth - Born in state of residence (%) - Asian
Place of birth - Born in state of residence (%) - Hispanic or Latino
Place of birth - Born in state of residence (%) - American Indian and Alaska Native
Place of birth - Born in state of residence (%) - Multirace
Place of birth - Born in state of residence (%) - Other Race
Place of birth - Born in other state (%)
Place of birth - Born in other state (%) - White
Place of birth - Born in other state (%) - Black or African American
Place of birth - Born in other state (%) - Asian
Place of birth - Born in other state (%) - Hispanic or Latino
Place of birth - Born in other state (%) - American Indian and Alaska Native
Place of birth - Born in other state (%) - Multirace
Place of birth - Born in other state (%) - Other Race
Place of birth - Native, outside of US (%)
Place of birth - Native, outside of US (%) - White
Place of birth - Native, outside of US (%) - Black or African American
Place of birth - Native, outside of US (%) - Asian
Place of birth - Native, outside of US (%) - Hispanic or Latino
Place of birth - Native, outside of US (%) - American Indian and Alaska Native
Place of birth - Native, outside of US (%) - Multirace
Place of birth - Native, outside of US (%) - Other Race
Place of birth - Foreign born (%)
Place of birth - Foreign born (%) - White
Place of birth - Foreign born (%) - Black or African American
Place of birth - Foreign born (%) - Asian
Place of birth - Foreign born (%) - Hispanic or Latino
Place of birth - Foreign born (%) - American Indian and Alaska Native
Place of birth - Foreign born (%) - Multirace
Place of birth - Foreign born (%) - Other Race
Residents speaking English at home (%)
Residents speaking English at home - Born in the United States (%)
Residents speaking English at home - Native, born elsewhere (%)
Residents speaking English at home - Foreign born (%)
Residents speaking Spanish at home (%)
Residents speaking Spanish at home - Born in the United States (%)
Residents speaking Spanish at home - Native, born elsewhere (%)
Residents speaking Spanish at home - Foreign born (%)
Residents speaking other language at home (%)
Residents speaking other language at home - Born in the United States (%)
Residents speaking other language at home - Native, born elsewhere (%)
Residents speaking other language at home - Foreign born (%)
Marital status - Never married (%)
Marital status - Now married (%)
Marital status - Separated (%)
Marital status - Widowed (%)
Marital status - Divorced (%)
Ancestries Reported - Arab (%)
Ancestries Reported - Czech (%)
Ancestries Reported - Danish (%)
Ancestries Reported - Dutch (%)
Ancestries Reported - English (%)
Ancestries Reported - French (%)
Ancestries Reported - French Canadian (%)
Ancestries Reported - German (%)
Ancestries Reported - Greek (%)
Ancestries Reported - Hungarian (%)
Ancestries Reported - Irish (%)
Ancestries Reported - Italian (%)
Ancestries Reported - Lithuanian (%)
Ancestries Reported - Norwegian (%)
Ancestries Reported - Polish (%)
Ancestries Reported - Portuguese (%)
Ancestries Reported - Russian (%)
Ancestries Reported - Scotch-Irish (%)
Ancestries Reported - Scottish (%)
Ancestries Reported - Slovak (%)
Ancestries Reported - Subsaharan African (%)
Ancestries Reported - Swedish (%)
Ancestries Reported - Swiss (%)
Ancestries Reported - Ukrainian (%)
Ancestries Reported - United States (%)
Ancestries Reported - Welsh (%)
Ancestries Reported - West Indian (%)
Ancestries Reported - Other (%)
Geographical mobility - Same house 1 year ago (%)
Geographical mobility - Same house 1 year ago (%) - White
Geographical mobility - Same house 1 year ago (%) - Black or African American
Geographical mobility - Same house 1 year ago (%) - Asian
Geographical mobility - Same house 1 year ago (%) - Hispanic or Latino
Geographical mobility - Same house 1 year ago (%) - American Indian and Alaska Native
Geographical mobility - Same house 1 year ago (%) - Multirace
Geographical mobility - Same house 1 year ago (%) - Other Race
Geographical mobility - Moved within same county (%)
Geographical mobility - Moved within same county (%) - White
Geographical mobility - Moved within same county (%) - Black or African American
Geographical mobility - Moved within same county (%) - Asian
Geographical mobility - Moved within same county (%) - Hispanic or Latino
Geographical mobility - Moved within same county (%) - American Indian and Alaska Native
Geographical mobility - Moved within same county (%) - Multirace
Geographical mobility - Moved within same county (%) - Other Race
Geographical mobility - Moved from different county within same state (%)
Geographical mobility - Moved from different county within same state (%) - White
Geographical mobility - Moved from different county within same state (%) - Black or African American
Geographical mobility - Moved from different county within same state (%) - Asian
Geographical mobility - Moved from different county within same state (%) - Hispanic or Latino
Geographical mobility - Moved from different county within same state (%) - American Indian and Alaska Native
Geographical mobility - Moved from different county within same state (%) - Multirace
Geographical mobility - Moved from different county within same state (%) - Other Race
Geographical mobility - Moved from different state (%)
Geographical mobility - Moved from different state (%) - White
Geographical mobility - Moved from different state (%) - Black or African American
Geographical mobility - Moved from different state (%) - Asian
Geographical mobility - Moved from different state (%) - Hispanic or Latino
Geographical mobility - Moved from different state (%) - American Indian and Alaska Native
Geographical mobility - Moved from different state (%) - Multirace
Geographical mobility - Moved from different state (%) - Other Race
Geographical mobility - Moved from abroad (%)
Geographical mobility - Moved from abroad (%) - White
Geographical mobility - Moved from abroad (%) - Black or African American
Geographical mobility - Moved from abroad (%) - Asian
Geographical mobility - Moved from abroad (%) - Hispanic or Latino
Geographical mobility - Moved from abroad (%) - American Indian and Alaska Native
Geographical mobility - Moved from abroad (%) - Multirace
Geographical mobility - Moved from abroad (%) - Other Race
Place of birth for the foreign-born population - Ireland (%)
Place of birth for the foreign-born population - Denmark (%)
Place of birth for the foreign-born population - Norway (%)
Place of birth for the foreign-born population - Sweden (%)
Place of birth for the foreign-born population - United Kingdom (%)
Place of birth for the foreign-born population - England (%)
Place of birth for the foreign-born population - Scotland (%)
Place of birth for the foreign-born population - Other Northern Europe (%)
Place of birth for the foreign-born population - Austria (%)
Place of birth for the foreign-born population - Belgium (%)
Place of birth for the foreign-born population - France (%)
Place of birth for the foreign-born population - Germany (%)
Place of birth for the foreign-born population - Netherlands (%)
Place of birth for the foreign-born population - Switzerland (%)
Place of birth for the foreign-born population - Other Western Europe (%)
Place of birth for the foreign-born population - Greece (%)
Place of birth for the foreign-born population - Italy (%)
Place of birth for the foreign-born population - Portugal (%)
Place of birth for the foreign-born population - Spain (%)
Place of birth for the foreign-born population - Other Southern Europe (%)
Place of birth for the foreign-born population - Albania (%)
Place of birth for the foreign-born population - Belarus (%)
Place of birth for the foreign-born population - Bosnia and Herzegovina (%)
Place of birth for the foreign-born population - Bulgaria (%)
Place of birth for the foreign-born population - Croatia (%)
Place of birth for the foreign-born population - Czechoslovakia (%)
Place of birth for the foreign-born population - Hungary (%)
Place of birth for the foreign-born population - Latvia (%)
Place of birth for the foreign-born population - Lithuania (%)
Place of birth for the foreign-born population - North Macedonia (Macedonia) (%)
Place of birth for the foreign-born population - Moldova (%)
Place of birth for the foreign-born population - Poland (%)
Place of birth for the foreign-born population - Romania (%)
Place of birth for the foreign-born population - Russia (%)
Place of birth for the foreign-born population - Serbia (%)
Place of birth for the foreign-born population - Ukraine (%)
Place of birth for the foreign-born population - Other Eastern Europe (%)
Place of birth for the foreign-born population - China (%)
Place of birth for the foreign-born population - Hong Kong (%)
Place of birth for the foreign-born population - Taiwan (%)
Place of birth for the foreign-born population - Japan (%)
Place of birth for the foreign-born population - Korea (%)
Place of birth for the foreign-born population - Other Eastern Asia (%)
Place of birth for the foreign-born population - Afghanistan (%)
Place of birth for the foreign-born population - Bangladesh (%)
Place of birth for the foreign-born population - India (%)
Place of birth for the foreign-born population - Iran (%)
Place of birth for the foreign-born population - Kazakhstan (%)
Place of birth for the foreign-born population - Nepal (%)
Place of birth for the foreign-born population - Pakistan (%)
Place of birth for the foreign-born population - Sri Lanka (%)
Place of birth for the foreign-born population - Uzbekistan (%)
Place of birth for the foreign-born population - Other South Central Asia (%)
Place of birth for the foreign-born population - Burma (%)
Place of birth for the foreign-born population - Cambodia (%)
Place of birth for the foreign-born population - Indonesia (%)
Place of birth for the foreign-born population - Laos (%)
Place of birth for the foreign-born population - Malaysia (%)
Place of birth for the foreign-born population - Philippines (%)
Place of birth for the foreign-born population - Singapore (%)
Place of birth for the foreign-born population - Thailand (%)
Place of birth for the foreign-born population - Vietnam (%)
Place of birth for the foreign-born population - Other South Eastern Asia (%)
Place of birth for the foreign-born population - Armenia (%)
Place of birth for the foreign-born population - Iraq (%)
Place of birth for the foreign-born population - Israel (%)
Place of birth for the foreign-born population - Jordan (%)
Place of birth for the foreign-born population - Kuwait (%)
Place of birth for the foreign-born population - Lebanon (%)
Place of birth for the foreign-born population - Saudi Arabia (%)
Place of birth for the foreign-born population - Syria (%)
Place of birth for the foreign-born population - Turkey (%)
Place of birth for the foreign-born population - Yemen (%)
Place of birth for the foreign-born population - Other Western Asia (%)
Place of birth for the foreign-born population - Eritrea (%)
Place of birth for the foreign-born population - Ethiopia (%)
Place of birth for the foreign-born population - Kenya (%)
Place of birth for the foreign-born population - Somalia (%)
Place of birth for the foreign-born population - Uganda (%)
Place of birth for the foreign-born population - Zimbabwe (%)
Place of birth for the foreign-born population - Other Eastern Africa (%)
Place of birth for the foreign-born population - Cameroon (%)
Place of birth for the foreign-born population - Congo (%)
Place of birth for the foreign-born population - Democratic Republic of Congo (Zaire) (%)
Place of birth for the foreign-born population - Other Middle Africa (%)
Place of birth for the foreign-born population - Egypt (%)
Place of birth for the foreign-born population - Morocco (%)
Place of birth for the foreign-born population - Sudan (%)
Place of birth for the foreign-born population - Other Northern Africa (%)
Place of birth for the foreign-born population - South Africa (%)
Place of birth for the foreign-born population - Other Southern Africa (%)
Place of birth for the foreign-born population - Cabo Verde (%)
Place of birth for the foreign-born population - Ghana (%)
Place of birth for the foreign-born population - Liberia (%)
Place of birth for the foreign-born population - Nigeria (%)
Place of birth for the foreign-born population - Senegal (%)
Place of birth for the foreign-born population - Sierra Leone (%)
Place of birth for the foreign-born population - Other Western Africa (%)
Place of birth for the foreign-born population - Australia (%)
Place of birth for the foreign-born population - New Zealand (%)
Place of birth for the foreign-born population - Fiji (%)
Place of birth for the foreign-born population - Micronesia (%)
Place of birth for the foreign-born population - Bahamas (%)
Place of birth for the foreign-born population - Barbados (%)
Place of birth for the foreign-born population - Cuba (%)
Place of birth for the foreign-born population - Dominica (%)
Place of birth for the foreign-born population - Dominican Republic (%)
Place of birth for the foreign-born population - Grenada (%)
Place of birth for the foreign-born population - Haiti (%)
Place of birth for the foreign-born population - Jamaica (%)
Place of birth for the foreign-born population - St. Vincent and the Grenadines (%)
Place of birth for the foreign-born population - Trinidad and Tobago (%)
Place of birth for the foreign-born population - West Indies (%)
Place of birth for the foreign-born population - Other Caribbean (%)
Place of birth for the foreign-born population - Belize (%)
Place of birth for the foreign-born population - Costa Rica (%)
Place of birth for the foreign-born population - El Salvador (%)
Place of birth for the foreign-born population - Guatemala (%)
Place of birth for the foreign-born population - Honduras (%)
Place of birth for the foreign-born population - Mexico (%)
Place of birth for the foreign-born population - Nicaragua (%)
Place of birth for the foreign-born population - Panama (%)
Place of birth for the foreign-born population - Other Central America (%)
Place of birth for the foreign-born population - Argentina (%)
Place of birth for the foreign-born population - Bolivia (%)
Place of birth for the foreign-born population - Brazil (%)
Place of birth for the foreign-born population - Chile (%)
Place of birth for the foreign-born population - Colombia (%)
Place of birth for the foreign-born population - Ecuador (%)
Place of birth for the foreign-born population - Guyana (%)
Place of birth for the foreign-born population - Peru (%)
Place of birth for the foreign-born population - Uruguay (%)
Place of birth for the foreign-born population - Venezuela (%)
Place of birth for the foreign-born population - Other South America (%)
Place of birth for the foreign-born population - Canada (%)
Place of birth for the foreign-born population - Other Northern America (%)
Place of birth for the foreign-born population - Other (%)
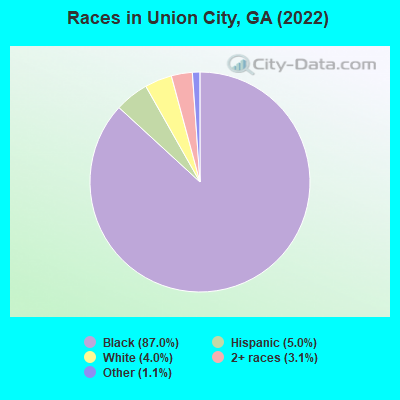
According to 2022 data, the most numerous races in Union City, GA are White alone (1,086 residents), Black alone (23,664 residents), and Hispanic (1,357 residents). 94.3% of Union City residents speak English at home. 5.3% of Union City, GA residents are foreign-born (3.6% born in Latin America, 1.2% born in Africa), which is 88.6% less than the foreign-born rate of 10.0% across the entire state of Georgia.
Race distribution in Union City
2000 2022
5,128,661 62.6% White alone 2,331,465 28.5% Black alone 435,227 5.3% Hispanic 171,513 2.1% Asian alone 87,364 1.1% Two or more races 17,670 0.2% American Indian alone 11,275 0.1% Other race alone 3,278 0.04% Native Hawaiian and Other
5,415,657 49.6% White alone 3,349,240 30.7% Black alone 1,132,604 10.4% Hispanic 479,156 4.4% Asian alone 462,923 4.2% Two or more races 54,416 0.5% Other race alone 11,923 0.1% American Indian alone 6,957 0.06% Native Hawaiian and Other
Income and house value in Union City Median household income in 2022 $32,241 White non-Hispanic householders$54,815 Black householders$42,454 Some other race householders$57,907 Hispanic or Latino race householdersMedian 2022 house value $271,290 White Non-Hispanic householders$216,731 Black or African American householdersover $1,000,000 American Indian or Alaska Native householders $226,075 Asian householders$214,922 Some other race householders$414,472 Two or more races householders$222,458 Hispanic or Latino householders
Median age by race in Union City
65.9 Median age for White residents48.8 68.4 32.4 Median age for Black or African American residents28.4 35.2 -764,932,561.9 Median age for American Indian / Alaska Native residents-507,017,543.4 -1,009,920,633.9 -699,516,907.5 Median age for Asian residents-696,165,191.0 -704,761,904.1 -866,062,436.2 Median age for Native Hawaiian / Pacific Islander residents-658,602,149.9 -776,776,776.0 25.3 Median age for Other race residents31.2 21.3 30.6 Median age for Two or more races residents21.6 44.7 65.3 Median age for White alone residents48.4 67.7 25.0 Median age for Hispanic or Latino residents28.4 24.6
Owner/renter occupied households by race in Union City
House owners and renters - White residents 403 56.0% Owner occupied317 44.0% Renter occupiedHouse owners and renters - Black or African American residents 4,328 44.1% Owner occupied5,487 55.9% Renter occupiedHouse owners and renters - Other race residents 270 53.2% Owner occupied238 46.8% Renter occupiedHouse owners and renters - Two or more races residents 228 32.2% Owner occupied479 67.8% Renter occupiedHouse owners and renters - White alone residents 409 56.7% Owner occupied313 43.3% Renter occupiedHouse owners and renters - Hispanic or Latino residents 221 53.3% Owner occupied194 46.7% Renter occupied
Language usage in Union City
English speakers - Total 94.3% of residents of Union City speak English at home.
3.4% of residents speak Spanish at home 647 74.0% Speak English very well227 26.0% Speak English less than very well2.3% of residents speak other language at home 498 82.7% Speak English very well104 17.3% Speak English less than very well
English speakers - Born in the United States 97.2% of residents of Union City speak English at home.
1.4% of residents speak Spanish at home 100 100.0% Speak English very well1.3% of residents speak other language at home 99 100.0% Speak English very well
English speakers - Native, born elsewhere 84.5% of residents of Union City speak English at home.
21.4% of residents speak other language at home 112 100.0% Speak English very well
English speakers - Foreign-born 37.5% of residents of Union City speak English at home.
38.0% of residents speak Spanish at home 271 53.1% Speak English very well239 46.9% Speak English less than very well26.6% of residents speak other language at home 256 71.7% Speak English very well101 28.3% Speak English less than very well
Black or African American - Speak only English Native:
98.8% (21,152)Foreign-born:
57.0% (578)
Black or African American - Speak another language Native:
1.3% (280)Foreign-born:
43.4% (440)
Other race - Speak only English Native:
49.5% (276)Foreign-born:
8.1% (38)
Other race - Speak another language Native:
49.6% (276)Foreign-born:
91.5% (426)
Two or more races - Speak another language Native:
11.0% (143)Foreign-born:
100.0% (274)
Hispanic or Latino - Speak only English Native:
73.6% (472)Foreign-born:
1.8% (9)
Hispanic or Latino - Speak another language Native:
27.4% (176)Foreign-born:
99.6% (509)
Foreign-born residents in Union City 1,442 residents are foreign born (3.6% Latin America , 1.2% Africa ).
This city:
5.3%Georgia:
10.4%
Marital status for residents in Union City Marital status - White (Caucasian) population 15 years and over
Males 15.4% Never married47.4% Now married10.3% Separated17.5% Widowed9.4% DivorcedFemales 33.2% Never married12.9% Now married0.0% Separated36.6% Widowed17.2% DivorcedWomen who did not give birth in the past 12 months Now married:
27.6% (50)Unmarried:
72.4% (131)
Marital status - Black or African American population 15 years and over
Males 54.4% Never married28.1% Now married2.9% Separated2.0% Widowed12.5% DivorcedFemales 50.9% Never married18.5% Now married4.0% Separated4.2% Widowed22.4% DivorcedWomen who gave birth in the past 12 months Now married:
65.1% (219)Unmarried:
34.9% (118)
Women who did not give birth in the past 12 months Now married:
23.5% (1,612)Unmarried:
76.5% (5,240)
Marital status - Other race population 15 years and over
Males 67.3% Never married25.0% Now married0.0% Separated0.0% Widowed7.7% DivorcedFemales 70.5% Never married29.5% Now married0.0% Separated0.0% Widowed0.0% DivorcedWomen who gave birth in the past 12 months Now married:
100.0% (63)Unmarried:
0.0% (0)
Women who did not give birth in the past 12 months Now married:
21.0% (38)Unmarried:
79.0% (144)
Marital status - Two or more races population 15 years and over
Males 30.5% Never married48.6% Now married20.9% Separated0.0% Widowed0.0% DivorcedFemales 10.1% Never married19.3% Now married0.0% Separated0.0% Widowed70.7% DivorcedWomen who gave birth in the past 12 months Now married:
0.0% (0)Unmarried:
100.0% (117)
Women who did not give birth in the past 12 months Now married:
50.0% (102)Unmarried:
50.0% (102)
Marital status - White alone, not Hispanic / Latino population 15 years and over
Males 10.3% Never married50.3% Now married10.9% Separated18.6% Widowed9.9% DivorcedFemales 33.2% Never married12.9% Now married0.0% Separated36.6% Widowed17.2% DivorcedWomen who did not give birth in the past 12 months Now married:
27.6% (52)Unmarried:
72.4% (136)
Marital status - Hispanic or Latino population 15 years and over
Males 51.1% Never married48.9% Now married0.0% Separated0.0% Widowed0.0% DivorcedFemales 37.3% Never married62.7% Now married0.0% Separated0.0% Widowed0.0% DivorcedWomen who gave birth in the past 12 months Now married:
100.0% (45)Unmarried:
0.0% (0)
Women who did not give birth in the past 12 months Now married:
54.1% (139)Unmarried:
45.9% (118)
Ancestries in Union City
790 4.2% African426 2.3% Nigerian297 1.6% Jamaican216 1.2% American156 0.8% English99 0.5% German84 0.4% West Indian49 0.3% Irish46 0.2% European44 0.2% Scotch-Irish38 0.2% Canadian37 0.2% Haitian35 0.2% Portuguese12 0.06% Ghanaian
Children Nativity (place of birth) in Union City
Children under 6 years - Living with two parents Both parents native 729 100.0% NativeBoth parents foreign-born 64 100.0% NativeOne native, one foreign-born parent 90 100.0% NativeChildren under 6 years - Living with one parent Native parent 1,080 100.0% NativeForeign-born parent 51 66.6% Native25 33.4% Foreign-bornChildren 6 to 17 years - Living with two parents Both parents native 1,239 99.5% Native7 0.5% Foreign-bornBoth parents foreign-born 45 100.0% NativeOne native, one foreign-born parent 113 84.8% Native20 15.2% Foreign-bornChildren 6 to 17 years - Living with one parent Native parent 3,414 100.0% NativeForeign-born parent 193 55.9% Native152 44.1% Foreign-born
Grandparents responsible for own grandchildren in Union City
Grandparents (30 to 59 years) Black or African American 99 79.6% Responsible for grandchildren25 20.4% Not responsible for grandchildrenGrandparents (60 years and over) Black or African American 50 16.7% Responsible for grandchildren248 83.3% Not responsible for grandchildren