Races in Tumwater, Washington (WA) Detailed Stats
Data:
Races - White alone (%)
Races - White alone (% change since 2000)
Races - Black alone (%)
Races - Black alone (% change since 2000)
Races - American Indian alone (%)
Races - American Indian alone (% change since 2000)
Races - Asian alone (%)
Races - Asian alone (% change since 2000)
Races - Hispanic (%)
Races - Hispanic (% change since 2000)
Races - Native Hawaiian and Other Pacific Islander alone (%)
Races - Native Hawaiian and Other Pacific Islander alone (% change since 2000)
Races - Two or more races(%)
Races - Two or more races(% change since 2000)
Races - Other race alone (%)
Races - Other race alone (% change since 2000)
Racial diversity
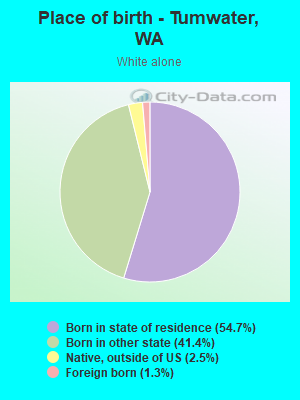
Place of birth - Born in state of residence (%)
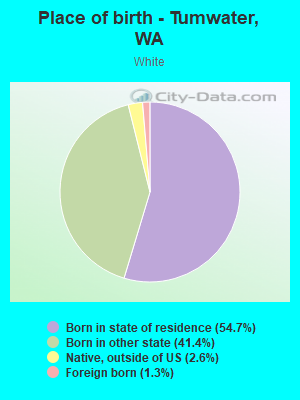
Place of birth - Born in state of residence (%) - White
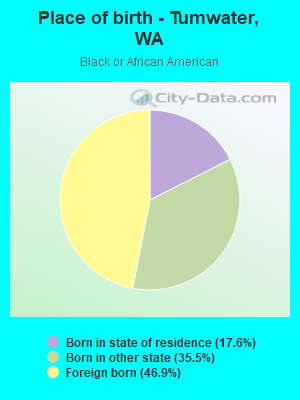
Place of birth - Born in state of residence (%) - Black or African American
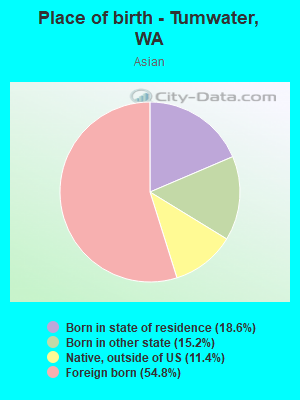
Place of birth - Born in state of residence (%) - Asian
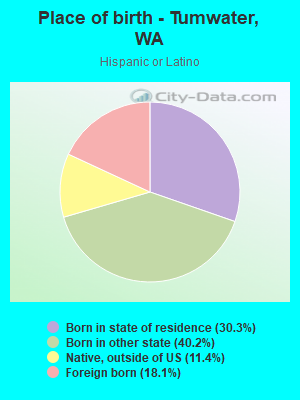
Place of birth - Born in state of residence (%) - Hispanic or Latino
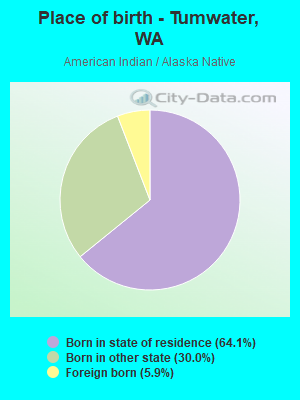
Place of birth - Born in state of residence (%) - American Indian and Alaska Native
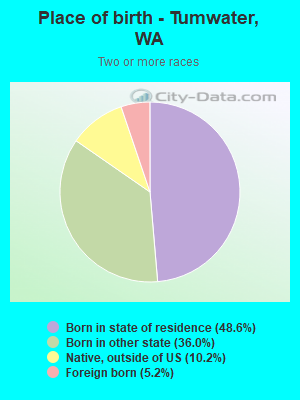
Place of birth - Born in state of residence (%) - Multirace
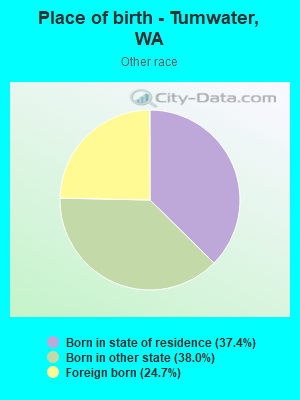
Place of birth - Born in state of residence (%) - Other Race
Place of birth - Born in other state (%)
Place of birth - Born in other state (%) - White
Place of birth - Born in other state (%) - Black or African American
Place of birth - Born in other state (%) - Asian
Place of birth - Born in other state (%) - Hispanic or Latino
Place of birth - Born in other state (%) - American Indian and Alaska Native
Place of birth - Born in other state (%) - Multirace
Place of birth - Born in other state (%) - Other Race
Place of birth - Native, outside of US (%)
Place of birth - Native, outside of US (%) - White
Place of birth - Native, outside of US (%) - Black or African American
Place of birth - Native, outside of US (%) - Asian
Place of birth - Native, outside of US (%) - Hispanic or Latino
Place of birth - Native, outside of US (%) - American Indian and Alaska Native
Place of birth - Native, outside of US (%) - Multirace
Place of birth - Native, outside of US (%) - Other Race
Place of birth - Foreign born (%)
Place of birth - Foreign born (%) - White
Place of birth - Foreign born (%) - Black or African American
Place of birth - Foreign born (%) - Asian
Place of birth - Foreign born (%) - Hispanic or Latino
Place of birth - Foreign born (%) - American Indian and Alaska Native
Place of birth - Foreign born (%) - Multirace
Place of birth - Foreign born (%) - Other Race
Residents speaking English at home (%)
Residents speaking English at home - Born in the United States (%)
Residents speaking English at home - Native, born elsewhere (%)
Residents speaking English at home - Foreign born (%)
Residents speaking Spanish at home (%)
Residents speaking Spanish at home - Born in the United States (%)
Residents speaking Spanish at home - Native, born elsewhere (%)
Residents speaking Spanish at home - Foreign born (%)
Residents speaking other language at home (%)
Residents speaking other language at home - Born in the United States (%)
Residents speaking other language at home - Native, born elsewhere (%)
Residents speaking other language at home - Foreign born (%)
Marital status - Never married (%)
Marital status - Now married (%)
Marital status - Separated (%)
Marital status - Widowed (%)
Marital status - Divorced (%)
Ancestries Reported - Arab (%)
Ancestries Reported - Czech (%)
Ancestries Reported - Danish (%)
Ancestries Reported - Dutch (%)
Ancestries Reported - English (%)
Ancestries Reported - French (%)
Ancestries Reported - French Canadian (%)
Ancestries Reported - German (%)
Ancestries Reported - Greek (%)
Ancestries Reported - Hungarian (%)
Ancestries Reported - Irish (%)
Ancestries Reported - Italian (%)
Ancestries Reported - Lithuanian (%)
Ancestries Reported - Norwegian (%)
Ancestries Reported - Polish (%)
Ancestries Reported - Portuguese (%)
Ancestries Reported - Russian (%)
Ancestries Reported - Scotch-Irish (%)
Ancestries Reported - Scottish (%)
Ancestries Reported - Slovak (%)
Ancestries Reported - Subsaharan African (%)
Ancestries Reported - Swedish (%)
Ancestries Reported - Swiss (%)
Ancestries Reported - Ukrainian (%)
Ancestries Reported - United States (%)
Ancestries Reported - Welsh (%)
Ancestries Reported - West Indian (%)
Ancestries Reported - Other (%)
Geographical mobility - Same house 1 year ago (%)
Geographical mobility - Same house 1 year ago (%) - White
Geographical mobility - Same house 1 year ago (%) - Black or African American
Geographical mobility - Same house 1 year ago (%) - Asian
Geographical mobility - Same house 1 year ago (%) - Hispanic or Latino
Geographical mobility - Same house 1 year ago (%) - American Indian and Alaska Native
Geographical mobility - Same house 1 year ago (%) - Multirace
Geographical mobility - Same house 1 year ago (%) - Other Race
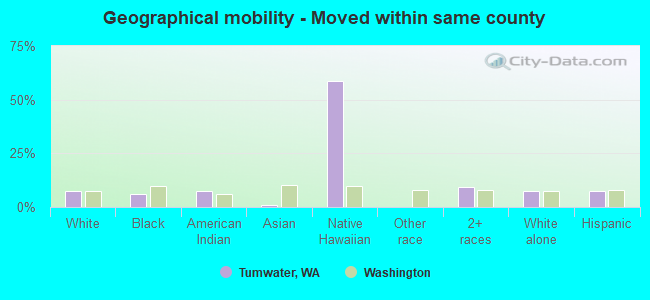
Geographical mobility - Moved within same county (%)
Geographical mobility - Moved within same county (%) - White
Geographical mobility - Moved within same county (%) - Black or African American
Geographical mobility - Moved within same county (%) - Asian
Geographical mobility - Moved within same county (%) - Hispanic or Latino
Geographical mobility - Moved within same county (%) - American Indian and Alaska Native
Geographical mobility - Moved within same county (%) - Multirace
Geographical mobility - Moved within same county (%) - Other Race
Geographical mobility - Moved from different county within same state (%)
Geographical mobility - Moved from different county within same state (%) - White
Geographical mobility - Moved from different county within same state (%) - Black or African American
Geographical mobility - Moved from different county within same state (%) - Asian
Geographical mobility - Moved from different county within same state (%) - Hispanic or Latino
Geographical mobility - Moved from different county within same state (%) - American Indian and Alaska Native
Geographical mobility - Moved from different county within same state (%) - Multirace
Geographical mobility - Moved from different county within same state (%) - Other Race
Geographical mobility - Moved from different state (%)
Geographical mobility - Moved from different state (%) - White
Geographical mobility - Moved from different state (%) - Black or African American
Geographical mobility - Moved from different state (%) - Asian
Geographical mobility - Moved from different state (%) - Hispanic or Latino
Geographical mobility - Moved from different state (%) - American Indian and Alaska Native
Geographical mobility - Moved from different state (%) - Multirace
Geographical mobility - Moved from different state (%) - Other Race
Geographical mobility - Moved from abroad (%)
Geographical mobility - Moved from abroad (%) - White
Geographical mobility - Moved from abroad (%) - Black or African American
Geographical mobility - Moved from abroad (%) - Asian
Geographical mobility - Moved from abroad (%) - Hispanic or Latino
Geographical mobility - Moved from abroad (%) - American Indian and Alaska Native
Geographical mobility - Moved from abroad (%) - Multirace
Geographical mobility - Moved from abroad (%) - Other Race
Place of birth for the foreign-born population - Ireland (%)
Place of birth for the foreign-born population - Denmark (%)
Place of birth for the foreign-born population - Norway (%)
Place of birth for the foreign-born population - Sweden (%)
Place of birth for the foreign-born population - United Kingdom (%)
Place of birth for the foreign-born population - England (%)
Place of birth for the foreign-born population - Scotland (%)
Place of birth for the foreign-born population - Other Northern Europe (%)
Place of birth for the foreign-born population - Austria (%)
Place of birth for the foreign-born population - Belgium (%)
Place of birth for the foreign-born population - France (%)
Place of birth for the foreign-born population - Germany (%)
Place of birth for the foreign-born population - Netherlands (%)
Place of birth for the foreign-born population - Switzerland (%)
Place of birth for the foreign-born population - Other Western Europe (%)
Place of birth for the foreign-born population - Greece (%)
Place of birth for the foreign-born population - Italy (%)
Place of birth for the foreign-born population - Portugal (%)
Place of birth for the foreign-born population - Spain (%)
Place of birth for the foreign-born population - Other Southern Europe (%)
Place of birth for the foreign-born population - Albania (%)
Place of birth for the foreign-born population - Belarus (%)
Place of birth for the foreign-born population - Bosnia and Herzegovina (%)
Place of birth for the foreign-born population - Bulgaria (%)
Place of birth for the foreign-born population - Croatia (%)
Place of birth for the foreign-born population - Czechoslovakia (%)
Place of birth for the foreign-born population - Hungary (%)
Place of birth for the foreign-born population - Latvia (%)
Place of birth for the foreign-born population - Lithuania (%)
Place of birth for the foreign-born population - North Macedonia (Macedonia) (%)
Place of birth for the foreign-born population - Moldova (%)
Place of birth for the foreign-born population - Poland (%)
Place of birth for the foreign-born population - Romania (%)
Place of birth for the foreign-born population - Russia (%)
Place of birth for the foreign-born population - Serbia (%)
Place of birth for the foreign-born population - Ukraine (%)
Place of birth for the foreign-born population - Other Eastern Europe (%)
Place of birth for the foreign-born population - China (%)
Place of birth for the foreign-born population - Hong Kong (%)
Place of birth for the foreign-born population - Taiwan (%)
Place of birth for the foreign-born population - Japan (%)
Place of birth for the foreign-born population - Korea (%)
Place of birth for the foreign-born population - Other Eastern Asia (%)
Place of birth for the foreign-born population - Afghanistan (%)
Place of birth for the foreign-born population - Bangladesh (%)
Place of birth for the foreign-born population - India (%)
Place of birth for the foreign-born population - Iran (%)
Place of birth for the foreign-born population - Kazakhstan (%)
Place of birth for the foreign-born population - Nepal (%)
Place of birth for the foreign-born population - Pakistan (%)
Place of birth for the foreign-born population - Sri Lanka (%)
Place of birth for the foreign-born population - Uzbekistan (%)
Place of birth for the foreign-born population - Other South Central Asia (%)
Place of birth for the foreign-born population - Burma (%)
Place of birth for the foreign-born population - Cambodia (%)
Place of birth for the foreign-born population - Indonesia (%)
Place of birth for the foreign-born population - Laos (%)
Place of birth for the foreign-born population - Malaysia (%)
Place of birth for the foreign-born population - Philippines (%)
Place of birth for the foreign-born population - Singapore (%)
Place of birth for the foreign-born population - Thailand (%)
Place of birth for the foreign-born population - Vietnam (%)
Place of birth for the foreign-born population - Other South Eastern Asia (%)
Place of birth for the foreign-born population - Armenia (%)
Place of birth for the foreign-born population - Iraq (%)
Place of birth for the foreign-born population - Israel (%)
Place of birth for the foreign-born population - Jordan (%)
Place of birth for the foreign-born population - Kuwait (%)
Place of birth for the foreign-born population - Lebanon (%)
Place of birth for the foreign-born population - Saudi Arabia (%)
Place of birth for the foreign-born population - Syria (%)
Place of birth for the foreign-born population - Turkey (%)
Place of birth for the foreign-born population - Yemen (%)
Place of birth for the foreign-born population - Other Western Asia (%)
Place of birth for the foreign-born population - Eritrea (%)
Place of birth for the foreign-born population - Ethiopia (%)
Place of birth for the foreign-born population - Kenya (%)
Place of birth for the foreign-born population - Somalia (%)
Place of birth for the foreign-born population - Uganda (%)
Place of birth for the foreign-born population - Zimbabwe (%)
Place of birth for the foreign-born population - Other Eastern Africa (%)
Place of birth for the foreign-born population - Cameroon (%)
Place of birth for the foreign-born population - Congo (%)
Place of birth for the foreign-born population - Democratic Republic of Congo (Zaire) (%)
Place of birth for the foreign-born population - Other Middle Africa (%)
Place of birth for the foreign-born population - Egypt (%)
Place of birth for the foreign-born population - Morocco (%)
Place of birth for the foreign-born population - Sudan (%)
Place of birth for the foreign-born population - Other Northern Africa (%)
Place of birth for the foreign-born population - South Africa (%)
Place of birth for the foreign-born population - Other Southern Africa (%)
Place of birth for the foreign-born population - Cabo Verde (%)
Place of birth for the foreign-born population - Ghana (%)
Place of birth for the foreign-born population - Liberia (%)
Place of birth for the foreign-born population - Nigeria (%)
Place of birth for the foreign-born population - Senegal (%)
Place of birth for the foreign-born population - Sierra Leone (%)
Place of birth for the foreign-born population - Other Western Africa (%)
Place of birth for the foreign-born population - Australia (%)
Place of birth for the foreign-born population - New Zealand (%)
Place of birth for the foreign-born population - Fiji (%)
Place of birth for the foreign-born population - Micronesia (%)
Place of birth for the foreign-born population - Bahamas (%)
Place of birth for the foreign-born population - Barbados (%)
Place of birth for the foreign-born population - Cuba (%)
Place of birth for the foreign-born population - Dominica (%)
Place of birth for the foreign-born population - Dominican Republic (%)
Place of birth for the foreign-born population - Grenada (%)
Place of birth for the foreign-born population - Haiti (%)
Place of birth for the foreign-born population - Jamaica (%)
Place of birth for the foreign-born population - St. Vincent and the Grenadines (%)
Place of birth for the foreign-born population - Trinidad and Tobago (%)
Place of birth for the foreign-born population - West Indies (%)
Place of birth for the foreign-born population - Other Caribbean (%)
Place of birth for the foreign-born population - Belize (%)
Place of birth for the foreign-born population - Costa Rica (%)
Place of birth for the foreign-born population - El Salvador (%)
Place of birth for the foreign-born population - Guatemala (%)
Place of birth for the foreign-born population - Honduras (%)
Place of birth for the foreign-born population - Mexico (%)
Place of birth for the foreign-born population - Nicaragua (%)
Place of birth for the foreign-born population - Panama (%)
Place of birth for the foreign-born population - Other Central America (%)
Place of birth for the foreign-born population - Argentina (%)
Place of birth for the foreign-born population - Bolivia (%)
Place of birth for the foreign-born population - Brazil (%)
Place of birth for the foreign-born population - Chile (%)
Place of birth for the foreign-born population - Colombia (%)
Place of birth for the foreign-born population - Ecuador (%)
Place of birth for the foreign-born population - Guyana (%)
Place of birth for the foreign-born population - Peru (%)
Place of birth for the foreign-born population - Uruguay (%)
Place of birth for the foreign-born population - Venezuela (%)
Place of birth for the foreign-born population - Other South America (%)
Place of birth for the foreign-born population - Canada (%)
Place of birth for the foreign-born population - Other Northern America (%)
Place of birth for the foreign-born population - Other (%)
Latest news about races in Tumwater, WA collected exclusively by city-data.com from local newspapers, TV, and radio stations
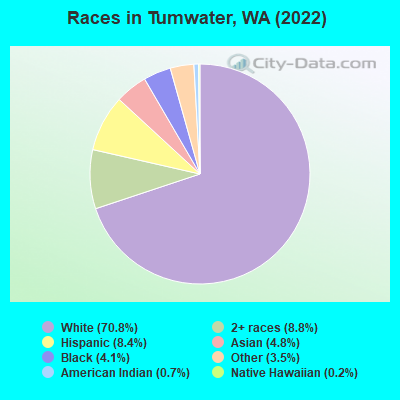
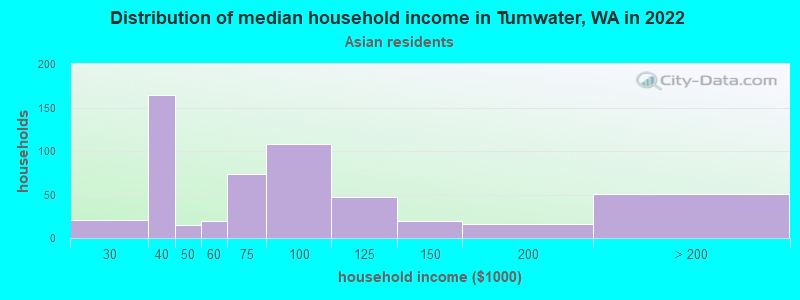
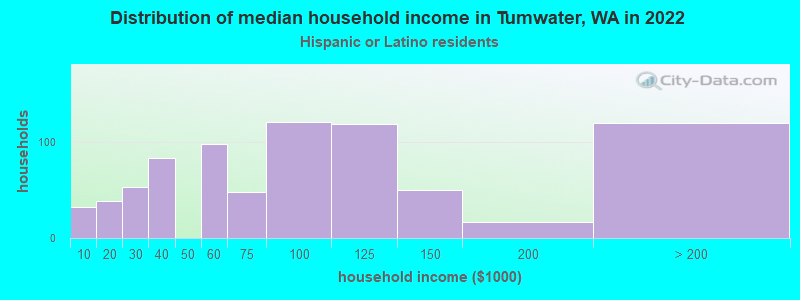
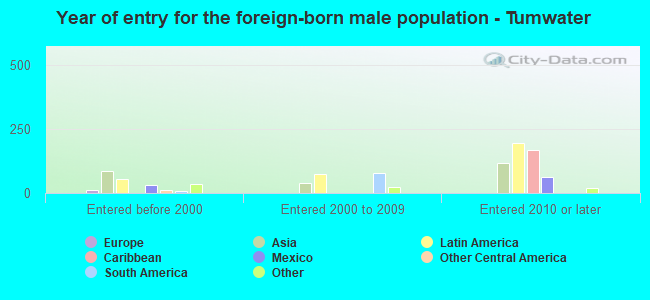
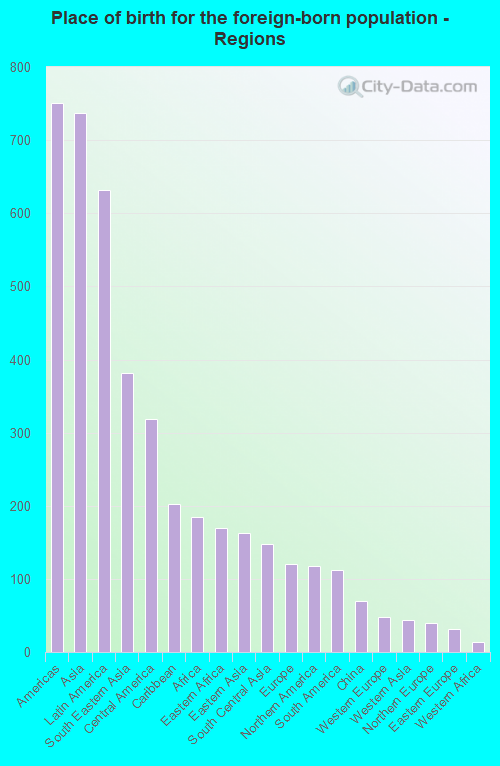
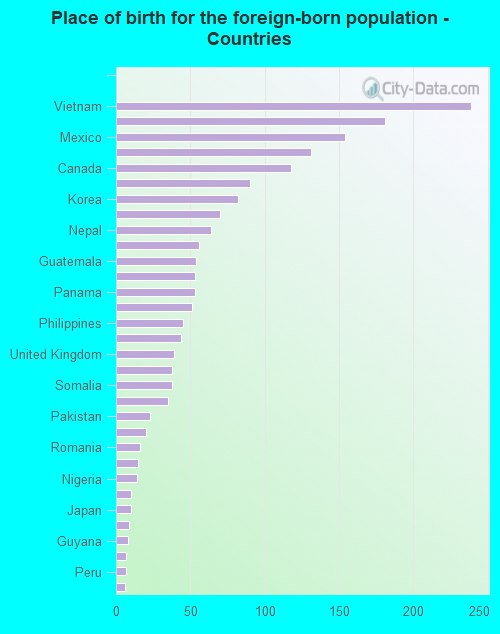
According to 2022 data, the most numerous races in Tumwater, WA are White alone (18,405 residents), Hispanic (2,192 residents), and Asian alone (1,246 residents). 92.5% of Tumwater residents speak English at home. 6.9% of Tumwater, WA residents are foreign-born (2.8% born in Asia, 2.4% born in Latin America, 0.7% born in Africa), which is 117.5% less than the foreign-born rate of 15.0% across the entire state of Washington.
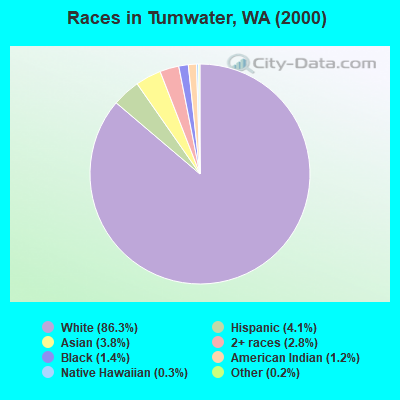
Race distribution in Tumwater
2000 2022
4,652,490 78.9% White alone 441,509 7.5% Hispanic 319,401 5.4% Asian alone 184,631 3.1% Black alone 175,926 3.0% Two or more races 85,396 1.4% American Indian alone 22,779 0.4% Native Hawaiian and Other 11,989 0.2% Other race alone
4,941,456 63.5% White alone 1,093,313 14.0% Hispanic 755,832 9.7% Asian alone 523,448 6.7% Two or more races 299,537 3.8% Black alone 69,024 0.9% American Indian alone 52,231 0.7% Native Hawaiian and Other 50,945 0.7% Other race alone
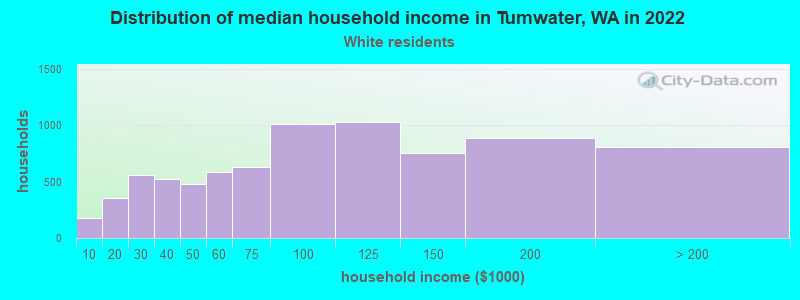
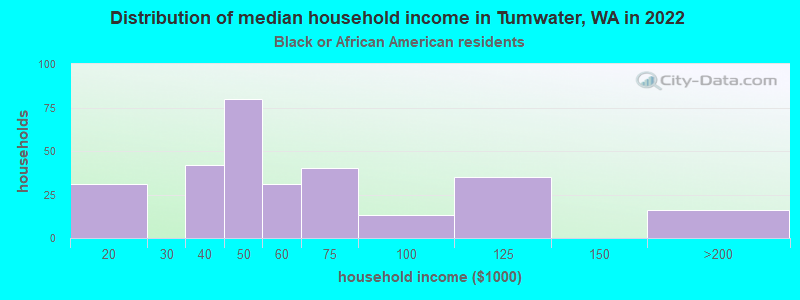
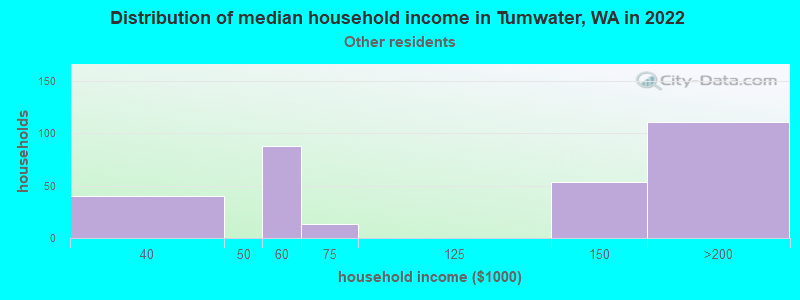
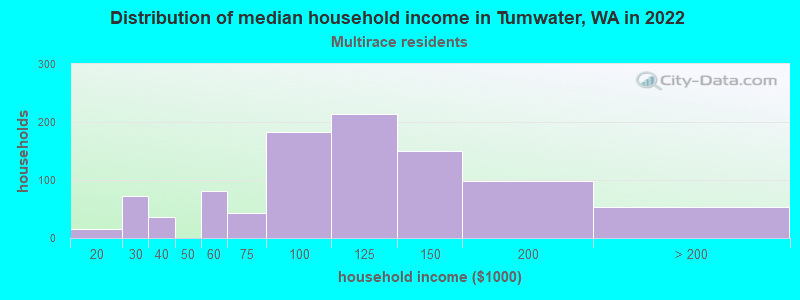
Income and house value in Tumwater Median household income in 2022 $86,842 White non-Hispanic householders$43,137 Black householders$109,731 American Indian and Alaska Native householders$68,056 Asian householders$114,230 Two or more races householders$75,445 Hispanic or Latino race householdersMedian 2022 house value $525,277 White Non-Hispanic householders$514,794 Black or African American householders$694,129 American Indian or Alaska Native householders $511,050 Asian householders$514,794 Native Hawaiian and other Pacific Islander householders$769,757 Two or more races householders$708,731 Hispanic or Latino householders
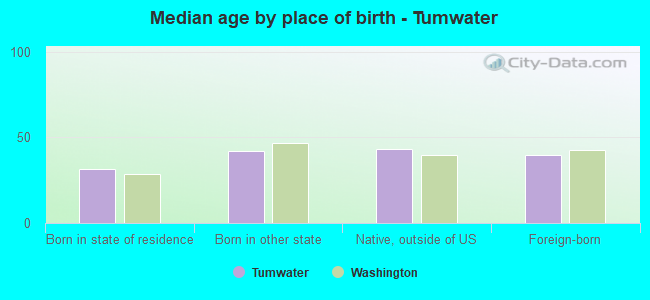
Median age by race in Tumwater
39.4 Median age for White residents39.4 40.5 29.2 Median age for Black or African American residents21.1 33.6 29.4 Median age for American Indian / Alaska Native residents24.4 31.9 46.5 Median age for Asian residents40.9 48.3 27.3 Median age for Native Hawaiian / Pacific Islander residents-810,861,422.4 22.8 36.2 Median age for Other race residents42.0 38.8 19.8 Median age for Two or more races residents19.9 26.3 39.4 Median age for White alone residents38.9 40.3 28.3 Median age for Hispanic or Latino residents35.0 26.8
Owner/renter occupied households by race in Tumwater
House owners and renters - White residents 4,700 58.7% Owner occupied3,304 41.3% Renter occupiedHouse owners and renters - Black or African American residents 68 21.2% Owner occupied255 78.8% Renter occupiedHouse owners and renters - American Indian / Alaska Native residents 53 49.3% Owner occupied54 50.7% Renter occupiedHouse owners and renters - Asian residents 376 75.5% Owner occupied122 24.5% Renter occupiedHouse owners and renters - Native Hawaiian / Pacific Islander residents 35 100.0% Renter occupiedHouse owners and renters - Other race residents 155 47.1% Owner occupied174 52.9% Renter occupiedHouse owners and renters - Two or more races residents 638 70.4% Owner occupied268 29.6% Renter occupiedHouse owners and renters - White alone residents 4,682 60.1% Owner occupied3,104 39.9% Renter occupiedHouse owners and renters - Hispanic or Latino residents 242 30.9% Owner occupied540 69.1% Renter occupied
Language usage in Tumwater
English speakers - Total 92.5% of residents of Tumwater speak English at home.
2.1% of residents speak Spanish at home 421 81.7% Speak English very well94 18.3% Speak English less than very well5.5% of residents speak other language at home 789 57.2% Speak English very well590 42.8% Speak English less than very well
English speakers - Born in the United States 98.0% of residents of Tumwater speak English at home.
1.6% of residents speak Spanish at home 131 81.4% Speak English very well30 18.6% Speak English less than very well0.9% of residents speak other language at home 75 84.3% Speak English very well14 15.7% Speak English less than very well
English speakers - Native, born elsewhere 83.7% of residents of Tumwater speak English at home.
5.5% of residents speak Spanish at home 51 100.0% Speak English very well4.7% of residents speak other language at home 43 100.0% Speak English very well
English speakers - Foreign-born 24.4% of residents of Tumwater speak English at home.
15.1% of residents speak Spanish at home 215 81.7% Speak English very well48 18.3% Speak English less than very well61.7% of residents speak other language at home 531 49.4% Speak English very well544 50.6% Speak English less than very well
White (Caucasian) - Speak only English Native:
99.2% (17,957)Foreign-born:
64.5% (161)
White (Caucasian) - Speak another language Native:
1.3% (236)Foreign-born:
38.6% (96)
Black or African American - Speak only English Native:
100.0% (538)Foreign-born:
30.7% (128)
American Indian / Alaska Native - Speak only English Native:
73.6% (179)Foreign-born:
67.1% (6)
Asian - Speak only English Native:
88.6% (454)Foreign-born:
4.5% (30)
Asian - Speak another language Native:
17.1% (88)Foreign-born:
95.7% (639)
Other race - Speak another language Native:
1.4% (9)Foreign-born:
77.6% (158)
Two or more races - Speak only English Native:
92.4% (2,834)Foreign-born:
72.1% (138)
Two or more races - Speak another language Native:
4.6% (141)Foreign-born:
25.3% (49)
White alone - Speak only English Native:
99.2% (17,454)Foreign-born:
68.6% (168)
White alone - Speak another language Native:
1.1% (191)Foreign-born:
33.4% (82)
Hispanic or Latino - Speak only English Native:
92.8% (1,477)Foreign-born:
33.3% (131)
Hispanic or Latino - Speak another language Native:
10.4% (165)Foreign-born:
67.9% (266)
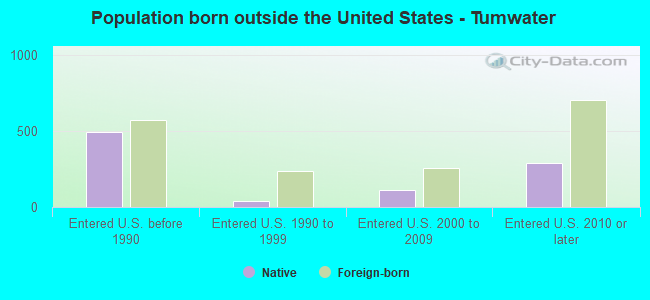
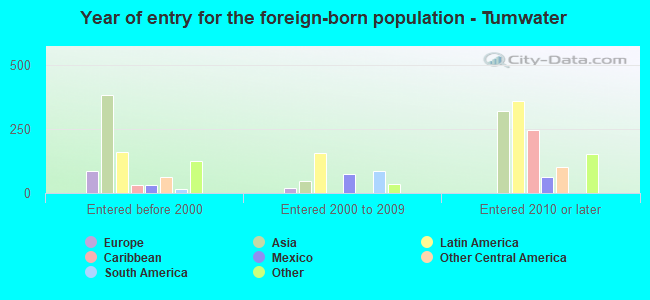
Foreign-born residents in Tumwater 1,794 residents are foreign born (2.8% Asia , 2.4% Latin America , 0.7% Africa ).
This city:
6.9%Washington:
14.9%
Marital status for residents in Tumwater Marital status - White (Caucasian) population 15 years and over
Males 33.8% Never married50.8% Now married2.0% Separated4.5% Widowed8.9% DivorcedFemales 28.0% Never married47.9% Now married0.3% Separated7.1% Widowed16.7% DivorcedWomen who gave birth in the past 12 months Now married:
67.1% (101)Unmarried:
32.9% (50)
Women who did not give birth in the past 12 months Now married:
46.8% (2,208)Unmarried:
53.2% (2,506)
Marital status - Black or African American population 15 years and over
Males 69.0% Never married25.9% Now married0.0% Separated1.7% Widowed3.4% DivorcedFemales 53.5% Never married14.4% Now married0.0% Separated5.2% Widowed26.8% DivorcedWomen who gave birth in the past 12 months Now married:
100.0% (16)Unmarried:
0.0% (0)
Women who did not give birth in the past 12 months Now married:
11.8% (48)Unmarried:
88.2% (360)
Marital status - American Indian / Alaska Native population 15 years and over
Males 83.8% Never married16.2% Now married0.0% Separated0.0% Widowed0.0% DivorcedFemales 74.4% Never married23.3% Now married0.0% Separated0.0% Widowed2.3% DivorcedWomen who gave birth in the past 12 months Now married:
0.0% (0)Unmarried:
100.0% (44)
Women who did not give birth in the past 12 months Now married:
0.0% (0)Unmarried:
100.0% (73)
Marital status - Asian population 15 years and over
Males 35.8% Never married61.2% Now married0.0% Separated0.0% Widowed3.1% DivorcedFemales 30.1% Never married39.5% Now married0.8% Separated5.4% Widowed24.2% DivorcedWomen who did not give birth in the past 12 months Now married:
31.7% (137)Unmarried:
68.3% (295)
Marital status - Other race population 15 years and over
Males 54.1% Never married45.9% Now married0.0% Separated0.0% Widowed0.0% DivorcedFemales 44.2% Never married39.3% Now married0.0% Separated0.0% Widowed16.5% DivorcedWomen who did not give birth in the past 12 months Now married:
39.3% (103)Unmarried:
60.7% (160)
Marital status - Two or more races population 15 years and over
Males 50.6% Never married35.2% Now married1.1% Separated1.1% Widowed12.0% DivorcedFemales 24.3% Never married45.6% Now married7.7% Separated6.0% Widowed16.4% DivorcedWomen who did not give birth in the past 12 months Now married:
53.9% (370)Unmarried:
46.1% (316)
Marital status - White alone, not Hispanic / Latino population 15 years and over
Males 33.2% Never married51.9% Now married2.1% Separated4.7% Widowed8.1% DivorcedFemales 27.5% Never married48.4% Now married0.3% Separated7.0% Widowed16.8% DivorcedWomen who gave birth in the past 12 months Now married:
90.4% (103)Unmarried:
9.6% (11)
Women who did not give birth in the past 12 months Now married:
47.1% (2,153)Unmarried:
52.9% (2,420)
Marital status - Hispanic or Latino population 15 years and over
Males 51.9% Never married31.5% Now married0.0% Separated1.2% Widowed15.4% DivorcedFemales 43.7% Never married33.0% Now married4.4% Separated5.0% Widowed14.0% DivorcedWomen who gave birth in the past 12 months Now married:
0.0% (0)Unmarried:
100.0% (45)
Women who did not give birth in the past 12 months Now married:
38.8% (200)Unmarried:
61.2% (316)
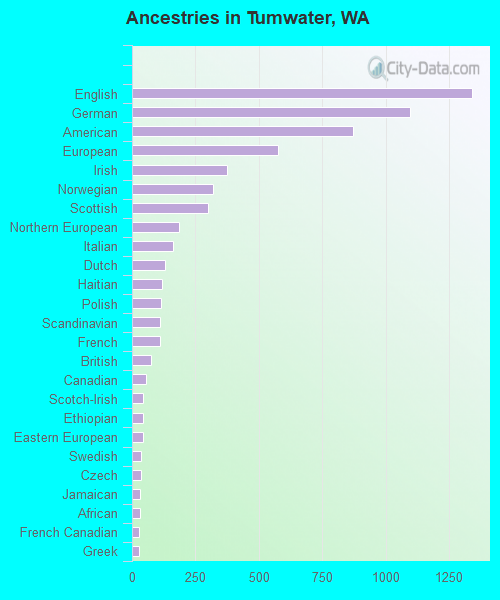
Ancestries in Tumwater
1,341 13.4% English1,096 10.9% German873 8.7% American577 5.8% European374 3.7% Irish320 3.2% Norwegian299 3.0% Scottish186 1.9% Northern European161 1.6% Italian132 1.3% Dutch117 1.2% Haitian115 1.1% Polish112 1.1% Scandinavian111 1.1% French73 0.7% British56 0.6% Canadian44 0.4% Scotch-Irish44 0.4% Ethiopian42 0.4% Eastern European36 0.4% Swedish35 0.3% Czech31 0.3% Jamaican31 0.3% African27 0.3% French Canadian26 0.3% Greek26 0.3% Croatian25 0.2% Danish22 0.2% Nigerian20 0.2% Romanian16 0.2% Iraqi15 0.1% Finnish15 0.1% Slovene15 0.1% Belgian14 0.1% Brazilian11 0.1% Lithuanian7 0.07% Welsh4 0.04% Afghan
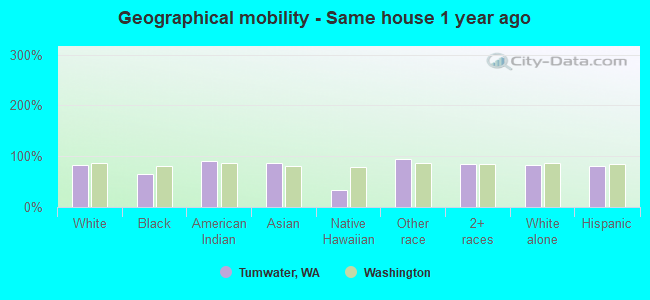
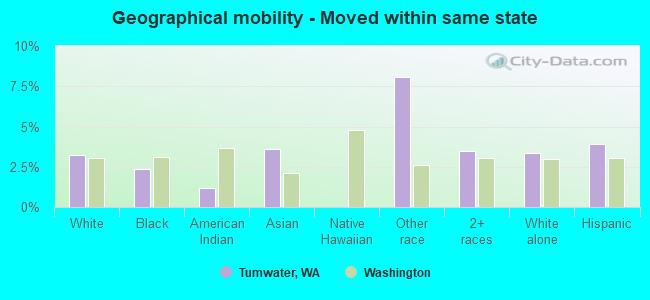
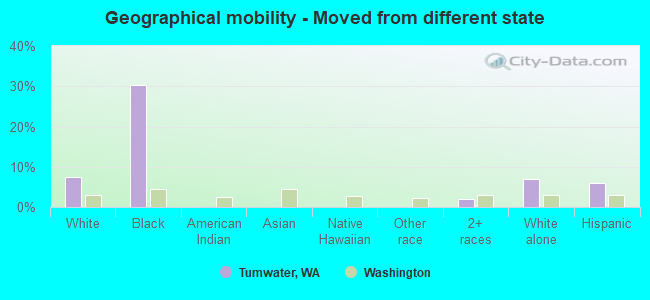
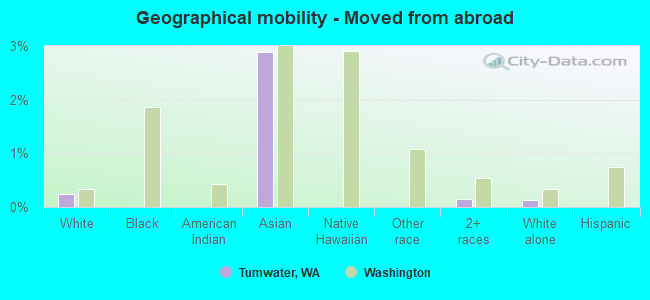
Geographical mobility in Tumwater Same house 1 year ago 15,511 82.4% White (Caucasian)707 64.1% Black or African American235 91.3% American Indian / Alaska Native1,069 86.4% Asian18 33.6% Native Hawaiian / Pacific Islander776 94.3% Other race3,062 84.8% Two or more races15,124 82.3% White alone, not Hispanic / Latino1,674 79.9% Hispanic or LatinoMoved within same county 1,368 7.3% White / Caucasian65 5.9% Black or African American19 7.2% American Indian / Alaska Native11 0.9% Asian31 58.5% Native Hawaiian / Pacific Islander335 9.3% Two or more races1,366 7.4% White alone, not Hispanic / Latino158 7.6% Hispanic or LatinoMoved within same state 609 3.2% White / Caucasian26 2.4% Black or African American3 1.2% American Indian / Alaska Native45 3.6% Asian67 8.1% Other race125 3.5% Two or more races616 3.4% White alone, not Hispanic / Latino82 3.9% Hispanic or LatinoMoved from different state 1,383 7.4% White / Caucasian333 30.2% Black or African American70 1.9% Two or more races1,299 7.1% White alone, not Hispanic / Latino123 5.9% Hispanic or LatinoMoved from abroad 44 0.2% White36 2.9% Asian5 0.1% Two or more races24 0.1% White alone, not Hispanic / Latino
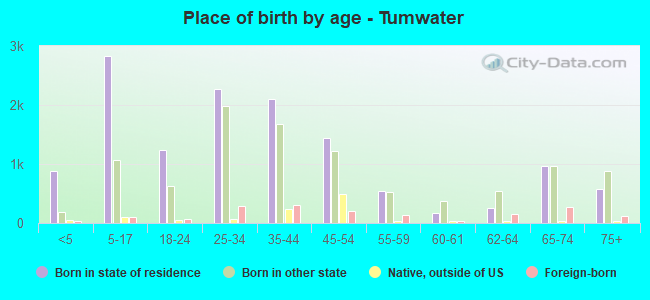
Children Nativity (place of birth) in Tumwater
Children under 6 years - Living with two parents Both parents native 960 100.0% NativeBoth parents foreign-born 29 59.5% Native20 40.5% Foreign-bornOne native, one foreign-born parent 84 100.0% NativeChildren under 6 years - Living with one parent Native parent 343 100.0% NativeForeign-born parent 4 100.0% NativeChildren 6 to 17 years - Living with two parents Both parents native 2,303 97.8% Native53 2.2% Foreign-bornBoth parents foreign-born 85 100.0% Foreign-bornOne native, one foreign-born parent 66 100.0% NativeChildren 6 to 17 years - Living with one parent Native parent 921 97.8% Native21 2.2% Foreign-bornForeign-born parent 103 74.3% Native36 25.7% Foreign-born
Grandparents responsible for own grandchildren in Tumwater
Grandparents (30 to 59 years) White / Caucasian 49 32.2% Responsible for grandchildren104 67.8% Not responsible for grandchildrenOther race 56 100.0% Not responsible for grandchildrenTwo or more races 16 54.3% Responsible for grandchildren13 45.7% Not responsible for grandchildrenWhite alone, not Hispanic / Latino 49 30.3% Responsible for grandchildren114 69.7% Not responsible for grandchildrenHispanic or Latino 44 100.0% Not responsible for grandchildrenGrandparents (60 years and over) White / Caucasian 10 10.5% Responsible for grandchildren83 89.5% Not responsible for grandchildrenTwo or more races 76 100.0% Not responsible for grandchildrenWhite alone, not Hispanic / Latino 10 9.7% Responsible for grandchildren91 90.3% Not responsible for grandchildren