Races in Travilah, Maryland (MD) Detailed Stats
Data:
Races - White alone (%)
Races - White alone (% change since 2000)
Races - Black alone (%)
Races - Black alone (% change since 2000)
Races - American Indian alone (%)
Races - American Indian alone (% change since 2000)
Races - Asian alone (%)
Races - Asian alone (% change since 2000)
Races - Hispanic (%)
Races - Hispanic (% change since 2000)
Races - Native Hawaiian and Other Pacific Islander alone (%)
Races - Native Hawaiian and Other Pacific Islander alone (% change since 2000)
Races - Two or more races(%)
Races - Two or more races(% change since 2000)
Races - Other race alone (%)
Races - Other race alone (% change since 2000)
Racial diversity
Place of birth - Born in state of residence (%)
Place of birth - Born in state of residence (%) - White
Place of birth - Born in state of residence (%) - Black or African American
Place of birth - Born in state of residence (%) - Asian
Place of birth - Born in state of residence (%) - Hispanic or Latino
Place of birth - Born in state of residence (%) - American Indian and Alaska Native
Place of birth - Born in state of residence (%) - Multirace
Place of birth - Born in state of residence (%) - Other Race
Place of birth - Born in other state (%)
Place of birth - Born in other state (%) - White
Place of birth - Born in other state (%) - Black or African American
Place of birth - Born in other state (%) - Asian
Place of birth - Born in other state (%) - Hispanic or Latino
Place of birth - Born in other state (%) - American Indian and Alaska Native
Place of birth - Born in other state (%) - Multirace
Place of birth - Born in other state (%) - Other Race
Place of birth - Native, outside of US (%)
Place of birth - Native, outside of US (%) - White
Place of birth - Native, outside of US (%) - Black or African American
Place of birth - Native, outside of US (%) - Asian
Place of birth - Native, outside of US (%) - Hispanic or Latino
Place of birth - Native, outside of US (%) - American Indian and Alaska Native
Place of birth - Native, outside of US (%) - Multirace
Place of birth - Native, outside of US (%) - Other Race
Place of birth - Foreign born (%)
Place of birth - Foreign born (%) - White
Place of birth - Foreign born (%) - Black or African American
Place of birth - Foreign born (%) - Asian
Place of birth - Foreign born (%) - Hispanic or Latino
Place of birth - Foreign born (%) - American Indian and Alaska Native
Place of birth - Foreign born (%) - Multirace
Place of birth - Foreign born (%) - Other Race
Residents speaking English at home (%)
Residents speaking English at home - Born in the United States (%)
Residents speaking English at home - Native, born elsewhere (%)
Residents speaking English at home - Foreign born (%)
Residents speaking Spanish at home (%)
Residents speaking Spanish at home - Born in the United States (%)
Residents speaking Spanish at home - Native, born elsewhere (%)
Residents speaking Spanish at home - Foreign born (%)
Residents speaking other language at home (%)
Residents speaking other language at home - Born in the United States (%)
Residents speaking other language at home - Native, born elsewhere (%)
Residents speaking other language at home - Foreign born (%)
Marital status - Never married (%)
Marital status - Now married (%)
Marital status - Separated (%)
Marital status - Widowed (%)
Marital status - Divorced (%)
Ancestries Reported - Arab (%)
Ancestries Reported - Czech (%)
Ancestries Reported - Danish (%)
Ancestries Reported - Dutch (%)
Ancestries Reported - English (%)
Ancestries Reported - French (%)
Ancestries Reported - French Canadian (%)
Ancestries Reported - German (%)
Ancestries Reported - Greek (%)
Ancestries Reported - Hungarian (%)
Ancestries Reported - Irish (%)
Ancestries Reported - Italian (%)
Ancestries Reported - Lithuanian (%)
Ancestries Reported - Norwegian (%)
Ancestries Reported - Polish (%)
Ancestries Reported - Portuguese (%)
Ancestries Reported - Russian (%)
Ancestries Reported - Scotch-Irish (%)
Ancestries Reported - Scottish (%)
Ancestries Reported - Slovak (%)
Ancestries Reported - Subsaharan African (%)
Ancestries Reported - Swedish (%)
Ancestries Reported - Swiss (%)
Ancestries Reported - Ukrainian (%)
Ancestries Reported - United States (%)
Ancestries Reported - Welsh (%)
Ancestries Reported - West Indian (%)
Ancestries Reported - Other (%)
Geographical mobility - Same house 1 year ago (%)
Geographical mobility - Same house 1 year ago (%) - White
Geographical mobility - Same house 1 year ago (%) - Black or African American
Geographical mobility - Same house 1 year ago (%) - Asian
Geographical mobility - Same house 1 year ago (%) - Hispanic or Latino
Geographical mobility - Same house 1 year ago (%) - American Indian and Alaska Native
Geographical mobility - Same house 1 year ago (%) - Multirace
Geographical mobility - Same house 1 year ago (%) - Other Race
Geographical mobility - Moved within same county (%)
Geographical mobility - Moved within same county (%) - White
Geographical mobility - Moved within same county (%) - Black or African American
Geographical mobility - Moved within same county (%) - Asian
Geographical mobility - Moved within same county (%) - Hispanic or Latino
Geographical mobility - Moved within same county (%) - American Indian and Alaska Native
Geographical mobility - Moved within same county (%) - Multirace
Geographical mobility - Moved within same county (%) - Other Race
Geographical mobility - Moved from different county within same state (%)
Geographical mobility - Moved from different county within same state (%) - White
Geographical mobility - Moved from different county within same state (%) - Black or African American
Geographical mobility - Moved from different county within same state (%) - Asian
Geographical mobility - Moved from different county within same state (%) - Hispanic or Latino
Geographical mobility - Moved from different county within same state (%) - American Indian and Alaska Native
Geographical mobility - Moved from different county within same state (%) - Multirace
Geographical mobility - Moved from different county within same state (%) - Other Race
Geographical mobility - Moved from different state (%)
Geographical mobility - Moved from different state (%) - White
Geographical mobility - Moved from different state (%) - Black or African American
Geographical mobility - Moved from different state (%) - Asian
Geographical mobility - Moved from different state (%) - Hispanic or Latino
Geographical mobility - Moved from different state (%) - American Indian and Alaska Native
Geographical mobility - Moved from different state (%) - Multirace
Geographical mobility - Moved from different state (%) - Other Race
Geographical mobility - Moved from abroad (%)
Geographical mobility - Moved from abroad (%) - White
Geographical mobility - Moved from abroad (%) - Black or African American
Geographical mobility - Moved from abroad (%) - Asian
Geographical mobility - Moved from abroad (%) - Hispanic or Latino
Geographical mobility - Moved from abroad (%) - American Indian and Alaska Native
Geographical mobility - Moved from abroad (%) - Multirace
Geographical mobility - Moved from abroad (%) - Other Race
Place of birth for the foreign-born population - Ireland (%)
Place of birth for the foreign-born population - Denmark (%)
Place of birth for the foreign-born population - Norway (%)
Place of birth for the foreign-born population - Sweden (%)
Place of birth for the foreign-born population - United Kingdom (%)
Place of birth for the foreign-born population - England (%)
Place of birth for the foreign-born population - Scotland (%)
Place of birth for the foreign-born population - Other Northern Europe (%)
Place of birth for the foreign-born population - Austria (%)
Place of birth for the foreign-born population - Belgium (%)
Place of birth for the foreign-born population - France (%)
Place of birth for the foreign-born population - Germany (%)
Place of birth for the foreign-born population - Netherlands (%)
Place of birth for the foreign-born population - Switzerland (%)
Place of birth for the foreign-born population - Other Western Europe (%)
Place of birth for the foreign-born population - Greece (%)
Place of birth for the foreign-born population - Italy (%)
Place of birth for the foreign-born population - Portugal (%)
Place of birth for the foreign-born population - Spain (%)
Place of birth for the foreign-born population - Other Southern Europe (%)
Place of birth for the foreign-born population - Albania (%)
Place of birth for the foreign-born population - Belarus (%)
Place of birth for the foreign-born population - Bosnia and Herzegovina (%)
Place of birth for the foreign-born population - Bulgaria (%)
Place of birth for the foreign-born population - Croatia (%)
Place of birth for the foreign-born population - Czechoslovakia (%)
Place of birth for the foreign-born population - Hungary (%)
Place of birth for the foreign-born population - Latvia (%)
Place of birth for the foreign-born population - Lithuania (%)
Place of birth for the foreign-born population - North Macedonia (Macedonia) (%)
Place of birth for the foreign-born population - Moldova (%)
Place of birth for the foreign-born population - Poland (%)
Place of birth for the foreign-born population - Romania (%)
Place of birth for the foreign-born population - Russia (%)
Place of birth for the foreign-born population - Serbia (%)
Place of birth for the foreign-born population - Ukraine (%)
Place of birth for the foreign-born population - Other Eastern Europe (%)
Place of birth for the foreign-born population - China (%)
Place of birth for the foreign-born population - Hong Kong (%)
Place of birth for the foreign-born population - Taiwan (%)
Place of birth for the foreign-born population - Japan (%)
Place of birth for the foreign-born population - Korea (%)
Place of birth for the foreign-born population - Other Eastern Asia (%)
Place of birth for the foreign-born population - Afghanistan (%)
Place of birth for the foreign-born population - Bangladesh (%)
Place of birth for the foreign-born population - India (%)
Place of birth for the foreign-born population - Iran (%)
Place of birth for the foreign-born population - Kazakhstan (%)
Place of birth for the foreign-born population - Nepal (%)
Place of birth for the foreign-born population - Pakistan (%)
Place of birth for the foreign-born population - Sri Lanka (%)
Place of birth for the foreign-born population - Uzbekistan (%)
Place of birth for the foreign-born population - Other South Central Asia (%)
Place of birth for the foreign-born population - Burma (%)
Place of birth for the foreign-born population - Cambodia (%)
Place of birth for the foreign-born population - Indonesia (%)
Place of birth for the foreign-born population - Laos (%)
Place of birth for the foreign-born population - Malaysia (%)
Place of birth for the foreign-born population - Philippines (%)
Place of birth for the foreign-born population - Singapore (%)
Place of birth for the foreign-born population - Thailand (%)
Place of birth for the foreign-born population - Vietnam (%)
Place of birth for the foreign-born population - Other South Eastern Asia (%)
Place of birth for the foreign-born population - Armenia (%)
Place of birth for the foreign-born population - Iraq (%)
Place of birth for the foreign-born population - Israel (%)
Place of birth for the foreign-born population - Jordan (%)
Place of birth for the foreign-born population - Kuwait (%)
Place of birth for the foreign-born population - Lebanon (%)
Place of birth for the foreign-born population - Saudi Arabia (%)
Place of birth for the foreign-born population - Syria (%)
Place of birth for the foreign-born population - Turkey (%)
Place of birth for the foreign-born population - Yemen (%)
Place of birth for the foreign-born population - Other Western Asia (%)
Place of birth for the foreign-born population - Eritrea (%)
Place of birth for the foreign-born population - Ethiopia (%)
Place of birth for the foreign-born population - Kenya (%)
Place of birth for the foreign-born population - Somalia (%)
Place of birth for the foreign-born population - Uganda (%)
Place of birth for the foreign-born population - Zimbabwe (%)
Place of birth for the foreign-born population - Other Eastern Africa (%)
Place of birth for the foreign-born population - Cameroon (%)
Place of birth for the foreign-born population - Congo (%)
Place of birth for the foreign-born population - Democratic Republic of Congo (Zaire) (%)
Place of birth for the foreign-born population - Other Middle Africa (%)
Place of birth for the foreign-born population - Egypt (%)
Place of birth for the foreign-born population - Morocco (%)
Place of birth for the foreign-born population - Sudan (%)
Place of birth for the foreign-born population - Other Northern Africa (%)
Place of birth for the foreign-born population - South Africa (%)
Place of birth for the foreign-born population - Other Southern Africa (%)
Place of birth for the foreign-born population - Cabo Verde (%)
Place of birth for the foreign-born population - Ghana (%)
Place of birth for the foreign-born population - Liberia (%)
Place of birth for the foreign-born population - Nigeria (%)
Place of birth for the foreign-born population - Senegal (%)
Place of birth for the foreign-born population - Sierra Leone (%)
Place of birth for the foreign-born population - Other Western Africa (%)
Place of birth for the foreign-born population - Australia (%)
Place of birth for the foreign-born population - New Zealand (%)
Place of birth for the foreign-born population - Fiji (%)
Place of birth for the foreign-born population - Micronesia (%)
Place of birth for the foreign-born population - Bahamas (%)
Place of birth for the foreign-born population - Barbados (%)
Place of birth for the foreign-born population - Cuba (%)
Place of birth for the foreign-born population - Dominica (%)
Place of birth for the foreign-born population - Dominican Republic (%)
Place of birth for the foreign-born population - Grenada (%)
Place of birth for the foreign-born population - Haiti (%)
Place of birth for the foreign-born population - Jamaica (%)
Place of birth for the foreign-born population - St. Vincent and the Grenadines (%)
Place of birth for the foreign-born population - Trinidad and Tobago (%)
Place of birth for the foreign-born population - West Indies (%)
Place of birth for the foreign-born population - Other Caribbean (%)
Place of birth for the foreign-born population - Belize (%)
Place of birth for the foreign-born population - Costa Rica (%)
Place of birth for the foreign-born population - El Salvador (%)
Place of birth for the foreign-born population - Guatemala (%)
Place of birth for the foreign-born population - Honduras (%)
Place of birth for the foreign-born population - Mexico (%)
Place of birth for the foreign-born population - Nicaragua (%)
Place of birth for the foreign-born population - Panama (%)
Place of birth for the foreign-born population - Other Central America (%)
Place of birth for the foreign-born population - Argentina (%)
Place of birth for the foreign-born population - Bolivia (%)
Place of birth for the foreign-born population - Brazil (%)
Place of birth for the foreign-born population - Chile (%)
Place of birth for the foreign-born population - Colombia (%)
Place of birth for the foreign-born population - Ecuador (%)
Place of birth for the foreign-born population - Guyana (%)
Place of birth for the foreign-born population - Peru (%)
Place of birth for the foreign-born population - Uruguay (%)
Place of birth for the foreign-born population - Venezuela (%)
Place of birth for the foreign-born population - Other South America (%)
Place of birth for the foreign-born population - Canada (%)
Place of birth for the foreign-born population - Other Northern America (%)
Place of birth for the foreign-born population - Other (%)
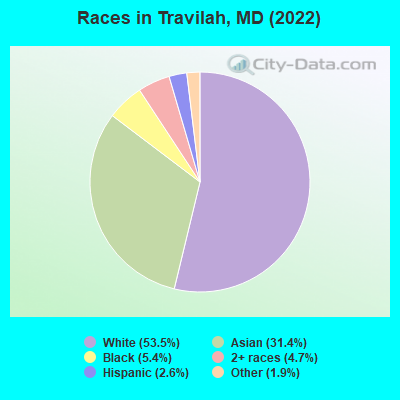
According to 2022 data, the most numerous races in Travilah, MD are White alone (5,780 residents), Black alone (579 residents), and Hispanic (281 residents). 57.6% of Travilah residents speak English at home. 33.9% of Travilah, MD residents are foreign-born (24.9% born in Asia), which is 52.8% greater than the foreign-born rate of 16.0% across the entire state of Maryland.
Race distribution in Travilah
2000 2022
3,286,547 62.1% White alone 1,464,735 27.7% Black alone 227,916 4.3% Hispanic 209,738 4.0% Asian alone 82,946 1.6% Two or more races 13,312 0.3% American Indian alone 9,379 0.2% Other race alone 1,913 0.04% Native Hawaiian and Other
2,906,492 47.1% White alone 1,800,914 29.2% Black alone 705,842 11.4% Hispanic 401,818 6.5% Asian alone 291,317 4.7% Two or more races 46,930 0.8% Other race alone 8,930 0.1% American Indian alone 2,417 0.04% Native Hawaiian and Other
Income and house value in Travilah Median household income in 2022 over $200,000 White non-Hispanic householders$176,225 Black householdersover $200,000 Asian householders$168,691 Some other race householders$146,883 Two or more races householders$190,263 Hispanic or Latino race householdersMedian 2022 house value over $1,000,000 White Non-Hispanic householdersover $1,000,000 Black or African American householders$367,283 American Indian or Alaska Native householders over $1,000,000 Asian householders$269,341 Some other race householders$339,076 Two or more races householdersover $1,000,000 Hispanic or Latino householders
Median age by race in Travilah
54.6 Median age for White residents54.1 55.0 49.6 Median age for Black or African American residents49.7 53.2 -610,526,315.2 Median age for American Indian / Alaska Native residents-555,555,555.0 -671,704,449.4 52.0 Median age for Asian residents52.4 51.1 -763,333,332.6 Median age for Native Hawaiian / Pacific Islander residents-720,061,021.4 -760,942,760.2 34.1 Median age for Other race residents9.7 36.1 23.5 Median age for Two or more races residents24.2 22.6 53.4 Median age for White alone residents53.1 53.7 42.5 Median age for Hispanic or Latino residents41.1 43.1
Owner/renter occupied households by race in Travilah
House owners and renters - White residents 2,023 96.2% Owner occupied81 3.8% Renter occupiedHouse owners and renters - Black or African American residents 204 84.9% Owner occupied36 15.1% Renter occupiedHouse owners and renters - Asian residents 1,193 99.4% Owner occupied7 0.6% Renter occupiedHouse owners and renters - Other race residents 60 100.0% Owner occupiedHouse owners and renters - Two or more races residents 117 87.1% Owner occupied17 12.9% Renter occupiedHouse owners and renters - White alone residents 2,091 96.1% Owner occupied85 3.9% Renter occupiedHouse owners and renters - Hispanic or Latino residents 72 89.2% Owner occupied9 10.8% Renter occupied
Language usage in Travilah
English speakers - Total 57.6% of residents of Travilah speak English at home.
1.7% of residents speak Spanish at home 169 96.6% Speak English very well6 3.4% Speak English less than very well41.5% of residents speak other language at home 3,333 77.5% Speak English very well967 22.5% Speak English less than very well
English speakers - Born in the United States 87.2% of residents of Travilah speak English at home.
1.3% of residents speak Spanish at home 54 100.0% Speak English very well12.1% of residents speak other language at home 397 80.7% Speak English very well95 19.3% Speak English less than very well
English speakers - Native, born elsewhere 70.9% of residents of Travilah speak English at home.
29.7% of residents speak other language at home 61 61.0% Speak English very well39 39.0% Speak English less than very well
English speakers - Foreign-born 14.6% of residents of Travilah speak English at home.
3.3% of residents speak Spanish at home 113 95.0% Speak English very well6 5.0% Speak English less than very well82.5% of residents speak other language at home 2,206 73.6% Speak English very well790 26.4% Speak English less than very well
White (Caucasian) - Speak only English Native:
91.8% (4,217)Foreign-born:
26.8% (204)
White (Caucasian) - Speak another language Native:
8.0% (366)Foreign-born:
74.4% (567)
Black or African American - Speak only English Native:
57.2% (284)Foreign-born:
30.4% (29)
Black or African American - Speak another language Native:
45.9% (228)Foreign-born:
67.5% (65)
Asian - Speak only English Native:
50.1% (510)Foreign-born:
13.4% (298)
Asian - Speak another language Native:
49.3% (503)Foreign-born:
86.6% (1,926)
Other race - Speak another language Native:
53.5% (49)Foreign-born:
100.0% (130)
Two or more races - Speak only English Native:
78.1% (323)Foreign-born:
7.5% (14)
Two or more races - Speak another language Native:
18.6% (77)Foreign-born:
92.1% (167)
White alone - Speak only English Native:
89.8% (4,180)Foreign-born:
20.8% (206)
White alone - Speak another language Native:
9.8% (457)Foreign-born:
79.4% (785)
Hispanic or Latino - Speak another language Native:
35.2% (39)Foreign-born:
100.0% (131)
Foreign-born residents in Travilah 3,661 residents are foreign born (24.9% Asia ).
This city:
33.9%Maryland:
15.7%
Marital status for residents in Travilah Marital status - White (Caucasian) population 15 years and over
Males 20.8% Never married73.8% Now married0.4% Separated3.4% Widowed1.5% DivorcedFemales 20.2% Never married68.1% Now married0.5% Separated9.1% Widowed2.2% DivorcedWomen who gave birth in the past 12 months Now married:
100.0% (38)Unmarried:
0.0% (0)
Women who did not give birth in the past 12 months Now married:
47.7% (409)Unmarried:
52.3% (448)
Marital status - Black or African American population 15 years and over
Males 13.7% Never married50.2% Now married0.0% Separated0.0% Widowed36.1% DivorcedFemales 50.9% Never married27.5% Now married7.4% Separated14.2% Widowed0.0% DivorcedWomen who did not give birth in the past 12 months Now married:
8.2% (13)Unmarried:
91.8% (145)
Marital status - Asian population 15 years and over
Males 22.9% Never married73.5% Now married0.0% Separated1.8% Widowed1.8% DivorcedFemales 15.7% Never married67.9% Now married1.5% Separated10.7% Widowed4.3% DivorcedWomen who gave birth in the past 12 months Now married:
82.5% (33)Unmarried:
17.5% (7)
Women who did not give birth in the past 12 months Now married:
61.8% (382)Unmarried:
38.2% (236)
Marital status - Other race population 15 years and over
Males 22.7% Never married77.3% Now married0.0% Separated0.0% Widowed0.0% DivorcedFemales 0.0% Never married100.0% Now married0.0% Separated0.0% Widowed0.0% DivorcedWomen who gave birth in the past 12 months Now married:
100.0% (12)Unmarried:
0.0% (0)
Women who did not give birth in the past 12 months Now married:
100.0% (23)Unmarried:
0.0% (0)
Marital status - Two or more races population 15 years and over
Males 30.3% Never married61.7% Now married0.0% Separated0.0% Widowed8.0% DivorcedFemales 28.1% Never married71.2% Now married0.0% Separated0.7% Widowed0.0% DivorcedWomen who did not give birth in the past 12 months Now married:
41.1% (35)Unmarried:
58.9% (50)
Marital status - White alone, not Hispanic / Latino population 15 years and over
Males 20.9% Never married73.7% Now married0.4% Separated3.4% Widowed1.5% DivorcedFemales 19.2% Never married69.2% Now married0.5% Separated8.8% Widowed2.2% DivorcedWomen who gave birth in the past 12 months Now married:
100.0% (42)Unmarried:
0.0% (0)
Women who did not give birth in the past 12 months Now married:
48.8% (442)Unmarried:
51.2% (463)
Marital status - Hispanic or Latino population 15 years and over
Males 0.0% Never married100.0% Now married0.0% Separated0.0% Widowed0.0% DivorcedFemales 37.6% Never married53.0% Now married0.0% Separated9.4% Widowed0.0% DivorcedWomen who gave birth in the past 12 months Now married:
100.0% (3)Unmarried:
0.0% (0)
Women who did not give birth in the past 12 months Now married:
12.2% (5)Unmarried:
87.8% (36)
Ancestries in Travilah
610 9.0% Iranian546 8.0% English316 4.6% German249 3.7% Arab203 3.0% Irish177 2.6% European168 2.5% American140 2.1% Italian109 1.6% Ukrainian106 1.6% Eastern European76 1.1% Nigerian67 1.0% Sierra Leonean63 0.9% Russian61 0.9% Armenian60 0.9% Polish59 0.9% Scottish54 0.8% Canadian48 0.7% Sudanese36 0.5% Greek35 0.5% Egyptian33 0.5% Norwegian33 0.5% Turkish20 0.3% Dutch17 0.3% Ethiopian15 0.2% Portuguese15 0.2% South African11 0.2% French Canadian11 0.2% Scotch-Irish8 0.1% French8 0.1% Welsh7 0.1% Brazilian7 0.1% Czech5 0.07% Lebanese5 0.07% Northern European4 0.06% Israeli3 0.04% Moroccan
Children Nativity (place of birth) in Travilah
Children under 6 years - Living with two parents Both parents native 150 94.0% Native10 6.0% Foreign-bornBoth parents foreign-born 73 80.2% Native18 19.8% Foreign-bornOne native, one foreign-born parent 239 100.0% NativeChildren under 6 years - Living with one parent Native parent 8 100.0% NativeForeign-born parent 6 100.0% NativeChildren 6 to 17 years - Living with two parents Both parents native 665 100.0% Native0 0.0% Foreign-bornBoth parents foreign-born 472 91.3% Native45 8.7% Foreign-bornOne native, one foreign-born parent 246 100.0% NativeChildren 6 to 17 years - Living with one parent Native parent 83 100.0% NativeForeign-born parent 44 49.5% Native45 50.5% Foreign-born
Grandparents responsible for own grandchildren in Travilah
Grandparents (30 to 59 years) Asian 3 100.0% Not responsible for grandchildrenGrandparents (60 years and over) Asian 14 9.6% Responsible for grandchildren128 90.4% Not responsible for grandchildren