Races in Torrington, Connecticut (CT) Detailed Stats
Data:
Races - White alone (%)
Races - White alone (% change since 2000)
Races - Black alone (%)
Races - Black alone (% change since 2000)
Races - American Indian alone (%)
Races - American Indian alone (% change since 2000)
Races - Asian alone (%)
Races - Asian alone (% change since 2000)
Races - Hispanic (%)
Races - Hispanic (% change since 2000)
Races - Native Hawaiian and Other Pacific Islander alone (%)
Races - Native Hawaiian and Other Pacific Islander alone (% change since 2000)
Races - Two or more races(%)
Races - Two or more races(% change since 2000)
Races - Other race alone (%)
Races - Other race alone (% change since 2000)
Racial diversity
Place of birth - Born in state of residence (%)
Place of birth - Born in state of residence (%) - White
Place of birth - Born in state of residence (%) - Black or African American
Place of birth - Born in state of residence (%) - Asian
Place of birth - Born in state of residence (%) - Hispanic or Latino
Place of birth - Born in state of residence (%) - American Indian and Alaska Native
Place of birth - Born in state of residence (%) - Multirace
Place of birth - Born in state of residence (%) - Other Race
Place of birth - Born in other state (%)
Place of birth - Born in other state (%) - White
Place of birth - Born in other state (%) - Black or African American
Place of birth - Born in other state (%) - Asian
Place of birth - Born in other state (%) - Hispanic or Latino
Place of birth - Born in other state (%) - American Indian and Alaska Native
Place of birth - Born in other state (%) - Multirace
Place of birth - Born in other state (%) - Other Race
Place of birth - Native, outside of US (%)
Place of birth - Native, outside of US (%) - White
Place of birth - Native, outside of US (%) - Black or African American
Place of birth - Native, outside of US (%) - Asian
Place of birth - Native, outside of US (%) - Hispanic or Latino
Place of birth - Native, outside of US (%) - American Indian and Alaska Native
Place of birth - Native, outside of US (%) - Multirace
Place of birth - Native, outside of US (%) - Other Race
Place of birth - Foreign born (%)
Place of birth - Foreign born (%) - White
Place of birth - Foreign born (%) - Black or African American
Place of birth - Foreign born (%) - Asian
Place of birth - Foreign born (%) - Hispanic or Latino
Place of birth - Foreign born (%) - American Indian and Alaska Native
Place of birth - Foreign born (%) - Multirace
Place of birth - Foreign born (%) - Other Race
Residents speaking English at home (%)
Residents speaking English at home - Born in the United States (%)
Residents speaking English at home - Native, born elsewhere (%)
Residents speaking English at home - Foreign born (%)
Residents speaking Spanish at home (%)
Residents speaking Spanish at home - Born in the United States (%)
Residents speaking Spanish at home - Native, born elsewhere (%)
Residents speaking Spanish at home - Foreign born (%)
Residents speaking other language at home (%)
Residents speaking other language at home - Born in the United States (%)
Residents speaking other language at home - Native, born elsewhere (%)
Residents speaking other language at home - Foreign born (%)
Marital status - Never married (%)
Marital status - Now married (%)
Marital status - Separated (%)
Marital status - Widowed (%)
Marital status - Divorced (%)
Ancestries Reported - Arab (%)
Ancestries Reported - Czech (%)
Ancestries Reported - Danish (%)
Ancestries Reported - Dutch (%)
Ancestries Reported - English (%)
Ancestries Reported - French (%)
Ancestries Reported - French Canadian (%)
Ancestries Reported - German (%)
Ancestries Reported - Greek (%)
Ancestries Reported - Hungarian (%)
Ancestries Reported - Irish (%)
Ancestries Reported - Italian (%)
Ancestries Reported - Lithuanian (%)
Ancestries Reported - Norwegian (%)
Ancestries Reported - Polish (%)
Ancestries Reported - Portuguese (%)
Ancestries Reported - Russian (%)
Ancestries Reported - Scotch-Irish (%)
Ancestries Reported - Scottish (%)
Ancestries Reported - Slovak (%)
Ancestries Reported - Subsaharan African (%)
Ancestries Reported - Swedish (%)
Ancestries Reported - Swiss (%)
Ancestries Reported - Ukrainian (%)
Ancestries Reported - United States (%)
Ancestries Reported - Welsh (%)
Ancestries Reported - West Indian (%)
Ancestries Reported - Other (%)
Geographical mobility - Same house 1 year ago (%)
Geographical mobility - Same house 1 year ago (%) - White
Geographical mobility - Same house 1 year ago (%) - Black or African American
Geographical mobility - Same house 1 year ago (%) - Asian
Geographical mobility - Same house 1 year ago (%) - Hispanic or Latino
Geographical mobility - Same house 1 year ago (%) - American Indian and Alaska Native
Geographical mobility - Same house 1 year ago (%) - Multirace
Geographical mobility - Same house 1 year ago (%) - Other Race
Geographical mobility - Moved within same county (%)
Geographical mobility - Moved within same county (%) - White
Geographical mobility - Moved within same county (%) - Black or African American
Geographical mobility - Moved within same county (%) - Asian
Geographical mobility - Moved within same county (%) - Hispanic or Latino
Geographical mobility - Moved within same county (%) - American Indian and Alaska Native
Geographical mobility - Moved within same county (%) - Multirace
Geographical mobility - Moved within same county (%) - Other Race
Geographical mobility - Moved from different county within same state (%)
Geographical mobility - Moved from different county within same state (%) - White
Geographical mobility - Moved from different county within same state (%) - Black or African American
Geographical mobility - Moved from different county within same state (%) - Asian
Geographical mobility - Moved from different county within same state (%) - Hispanic or Latino
Geographical mobility - Moved from different county within same state (%) - American Indian and Alaska Native
Geographical mobility - Moved from different county within same state (%) - Multirace
Geographical mobility - Moved from different county within same state (%) - Other Race
Geographical mobility - Moved from different state (%)
Geographical mobility - Moved from different state (%) - White
Geographical mobility - Moved from different state (%) - Black or African American
Geographical mobility - Moved from different state (%) - Asian
Geographical mobility - Moved from different state (%) - Hispanic or Latino
Geographical mobility - Moved from different state (%) - American Indian and Alaska Native
Geographical mobility - Moved from different state (%) - Multirace
Geographical mobility - Moved from different state (%) - Other Race
Geographical mobility - Moved from abroad (%)
Geographical mobility - Moved from abroad (%) - White
Geographical mobility - Moved from abroad (%) - Black or African American
Geographical mobility - Moved from abroad (%) - Asian
Geographical mobility - Moved from abroad (%) - Hispanic or Latino
Geographical mobility - Moved from abroad (%) - American Indian and Alaska Native
Geographical mobility - Moved from abroad (%) - Multirace
Geographical mobility - Moved from abroad (%) - Other Race
Place of birth for the foreign-born population - Ireland (%)
Place of birth for the foreign-born population - Denmark (%)
Place of birth for the foreign-born population - Norway (%)
Place of birth for the foreign-born population - Sweden (%)
Place of birth for the foreign-born population - United Kingdom (%)
Place of birth for the foreign-born population - England (%)
Place of birth for the foreign-born population - Scotland (%)
Place of birth for the foreign-born population - Other Northern Europe (%)
Place of birth for the foreign-born population - Austria (%)
Place of birth for the foreign-born population - Belgium (%)
Place of birth for the foreign-born population - France (%)
Place of birth for the foreign-born population - Germany (%)
Place of birth for the foreign-born population - Netherlands (%)
Place of birth for the foreign-born population - Switzerland (%)
Place of birth for the foreign-born population - Other Western Europe (%)
Place of birth for the foreign-born population - Greece (%)
Place of birth for the foreign-born population - Italy (%)
Place of birth for the foreign-born population - Portugal (%)
Place of birth for the foreign-born population - Spain (%)
Place of birth for the foreign-born population - Other Southern Europe (%)
Place of birth for the foreign-born population - Albania (%)
Place of birth for the foreign-born population - Belarus (%)
Place of birth for the foreign-born population - Bosnia and Herzegovina (%)
Place of birth for the foreign-born population - Bulgaria (%)
Place of birth for the foreign-born population - Croatia (%)
Place of birth for the foreign-born population - Czechoslovakia (%)
Place of birth for the foreign-born population - Hungary (%)
Place of birth for the foreign-born population - Latvia (%)
Place of birth for the foreign-born population - Lithuania (%)
Place of birth for the foreign-born population - North Macedonia (Macedonia) (%)
Place of birth for the foreign-born population - Moldova (%)
Place of birth for the foreign-born population - Poland (%)
Place of birth for the foreign-born population - Romania (%)
Place of birth for the foreign-born population - Russia (%)
Place of birth for the foreign-born population - Serbia (%)
Place of birth for the foreign-born population - Ukraine (%)
Place of birth for the foreign-born population - Other Eastern Europe (%)
Place of birth for the foreign-born population - China (%)
Place of birth for the foreign-born population - Hong Kong (%)
Place of birth for the foreign-born population - Taiwan (%)
Place of birth for the foreign-born population - Japan (%)
Place of birth for the foreign-born population - Korea (%)
Place of birth for the foreign-born population - Other Eastern Asia (%)
Place of birth for the foreign-born population - Afghanistan (%)
Place of birth for the foreign-born population - Bangladesh (%)
Place of birth for the foreign-born population - India (%)
Place of birth for the foreign-born population - Iran (%)
Place of birth for the foreign-born population - Kazakhstan (%)
Place of birth for the foreign-born population - Nepal (%)
Place of birth for the foreign-born population - Pakistan (%)
Place of birth for the foreign-born population - Sri Lanka (%)
Place of birth for the foreign-born population - Uzbekistan (%)
Place of birth for the foreign-born population - Other South Central Asia (%)
Place of birth for the foreign-born population - Burma (%)
Place of birth for the foreign-born population - Cambodia (%)
Place of birth for the foreign-born population - Indonesia (%)
Place of birth for the foreign-born population - Laos (%)
Place of birth for the foreign-born population - Malaysia (%)
Place of birth for the foreign-born population - Philippines (%)
Place of birth for the foreign-born population - Singapore (%)
Place of birth for the foreign-born population - Thailand (%)
Place of birth for the foreign-born population - Vietnam (%)
Place of birth for the foreign-born population - Other South Eastern Asia (%)
Place of birth for the foreign-born population - Armenia (%)
Place of birth for the foreign-born population - Iraq (%)
Place of birth for the foreign-born population - Israel (%)
Place of birth for the foreign-born population - Jordan (%)
Place of birth for the foreign-born population - Kuwait (%)
Place of birth for the foreign-born population - Lebanon (%)
Place of birth for the foreign-born population - Saudi Arabia (%)
Place of birth for the foreign-born population - Syria (%)
Place of birth for the foreign-born population - Turkey (%)
Place of birth for the foreign-born population - Yemen (%)
Place of birth for the foreign-born population - Other Western Asia (%)
Place of birth for the foreign-born population - Eritrea (%)
Place of birth for the foreign-born population - Ethiopia (%)
Place of birth for the foreign-born population - Kenya (%)
Place of birth for the foreign-born population - Somalia (%)
Place of birth for the foreign-born population - Uganda (%)
Place of birth for the foreign-born population - Zimbabwe (%)
Place of birth for the foreign-born population - Other Eastern Africa (%)
Place of birth for the foreign-born population - Cameroon (%)
Place of birth for the foreign-born population - Congo (%)
Place of birth for the foreign-born population - Democratic Republic of Congo (Zaire) (%)
Place of birth for the foreign-born population - Other Middle Africa (%)
Place of birth for the foreign-born population - Egypt (%)
Place of birth for the foreign-born population - Morocco (%)
Place of birth for the foreign-born population - Sudan (%)
Place of birth for the foreign-born population - Other Northern Africa (%)
Place of birth for the foreign-born population - South Africa (%)
Place of birth for the foreign-born population - Other Southern Africa (%)
Place of birth for the foreign-born population - Cabo Verde (%)
Place of birth for the foreign-born population - Ghana (%)
Place of birth for the foreign-born population - Liberia (%)
Place of birth for the foreign-born population - Nigeria (%)
Place of birth for the foreign-born population - Senegal (%)
Place of birth for the foreign-born population - Sierra Leone (%)
Place of birth for the foreign-born population - Other Western Africa (%)
Place of birth for the foreign-born population - Australia (%)
Place of birth for the foreign-born population - New Zealand (%)
Place of birth for the foreign-born population - Fiji (%)
Place of birth for the foreign-born population - Micronesia (%)
Place of birth for the foreign-born population - Bahamas (%)
Place of birth for the foreign-born population - Barbados (%)
Place of birth for the foreign-born population - Cuba (%)
Place of birth for the foreign-born population - Dominica (%)
Place of birth for the foreign-born population - Dominican Republic (%)
Place of birth for the foreign-born population - Grenada (%)
Place of birth for the foreign-born population - Haiti (%)
Place of birth for the foreign-born population - Jamaica (%)
Place of birth for the foreign-born population - St. Vincent and the Grenadines (%)
Place of birth for the foreign-born population - Trinidad and Tobago (%)
Place of birth for the foreign-born population - West Indies (%)
Place of birth for the foreign-born population - Other Caribbean (%)
Place of birth for the foreign-born population - Belize (%)
Place of birth for the foreign-born population - Costa Rica (%)
Place of birth for the foreign-born population - El Salvador (%)
Place of birth for the foreign-born population - Guatemala (%)
Place of birth for the foreign-born population - Honduras (%)
Place of birth for the foreign-born population - Mexico (%)
Place of birth for the foreign-born population - Nicaragua (%)
Place of birth for the foreign-born population - Panama (%)
Place of birth for the foreign-born population - Other Central America (%)
Place of birth for the foreign-born population - Argentina (%)
Place of birth for the foreign-born population - Bolivia (%)
Place of birth for the foreign-born population - Brazil (%)
Place of birth for the foreign-born population - Chile (%)
Place of birth for the foreign-born population - Colombia (%)
Place of birth for the foreign-born population - Ecuador (%)
Place of birth for the foreign-born population - Guyana (%)
Place of birth for the foreign-born population - Peru (%)
Place of birth for the foreign-born population - Uruguay (%)
Place of birth for the foreign-born population - Venezuela (%)
Place of birth for the foreign-born population - Other South America (%)
Place of birth for the foreign-born population - Canada (%)
Place of birth for the foreign-born population - Other Northern America (%)
Place of birth for the foreign-born population - Other (%)
Latest news about races in Torrington, CT collected exclusively by city-data.com from local newspapers, TV, and radio stations
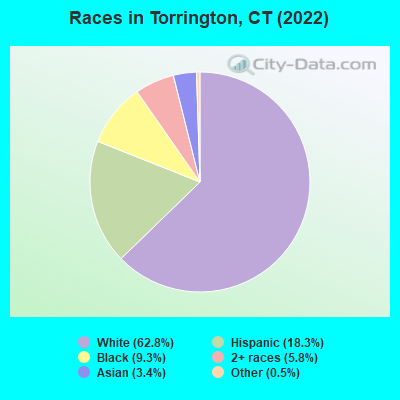
According to 2022 data, the most numerous races in Torrington, CT are White alone (22,392 residents), Hispanic (6,531 residents), and Black alone (3,312 residents). 82.9% of Torrington residents speak English at home. 14.0% of Torrington, CT residents are foreign-born (6.4% born in Latin America, 3.1% born in Europe, 2.8% born in Asia), which is 6.9% less than the foreign-born rate of 15.0% across the entire state of Connecticut.
Race distribution in Torrington
2000 2022
2,638,845 77.5% White alone 320,323 9.4% Hispanic 295,571 8.7% Black alone 81,564 2.4% Asian alone 52,896 1.6% Two or more races 8,141 0.2% Other race alone 7,267 0.2% American Indian alone 958 0.03% Native Hawaiian and Other
2,246,913 62.0% White alone 658,978 18.2% Hispanic 353,973 9.8% Black alone 172,929 4.8% Asian alone 159,631 4.4% Two or more races 29,761 0.8% Other race alone 3,428 0.09% American Indian alone 592 0.02% Native Hawaiian and Other
Income and house value in Torrington Median household income in 2022 $65,783 White non-Hispanic householders$66,626 Black householders$21,383 American Indian and Alaska Native householders$70,995 Asian householders$67,909 Some other race householders$78,907 Two or more races householders$58,738 Hispanic or Latino race householdersMedian 2022 house value $202,921 White Non-Hispanic householders$220,220 Black or African American householders $208,630 Asian householders$219,874 Some other race householders$165,035 Two or more races householders$203,094 Hispanic or Latino householders
Median age by race in Torrington
46.3 Median age for White residents43.7 50.5 33.2 Median age for Black or African American residents39.5 32.4 48.2 Median age for American Indian / Alaska Native residents-701,030,927.1 45.8 39.8 Median age for Asian residents33.0 41.9 -641,269,840.6 Median age for Native Hawaiian / Pacific Islander residents-414,239,481.8 -691,588,784.4 31.2 Median age for Other race residents30.9 30.5 32.8 Median age for Two or more races residents30.6 33.3 48.8 Median age for White alone residents45.2 52.4 29.1 Median age for Hispanic or Latino residents29.0 29.3
Owner/renter occupied households by race in Torrington
House owners and renters - White residents 7,537 69.2% Owner occupied3,350 30.8% Renter occupiedHouse owners and renters - Black or African American residents 604 41.8% Owner occupied842 58.2% Renter occupiedHouse owners and renters - American Indian / Alaska Native residents 1 2.6% Owner occupied43 97.4% Renter occupiedHouse owners and renters - Asian residents 229 54.4% Owner occupied193 45.6% Renter occupiedHouse owners and renters - Other race residents 494 62.0% Owner occupied303 38.0% Renter occupiedHouse owners and renters - Two or more races residents 734 60.3% Owner occupied484 39.7% Renter occupiedHouse owners and renters - White alone residents 7,299 69.8% Owner occupied3,158 30.2% Renter occupiedHouse owners and renters - Hispanic or Latino residents 1,023 48.0% Owner occupied1,108 52.0% Renter occupied
Language usage in Torrington
English speakers - Total 82.9% of residents of Torrington speak English at home.
11.4% of residents speak Spanish at home 2,061 53.2% Speak English very well1,811 46.8% Speak English less than very well5.5% of residents speak other language at home 1,258 68.0% Speak English very well591 32.0% Speak English less than very well
English speakers - Born in the United States 87.0% of residents of Torrington speak English at home.
11.9% of residents speak Spanish at home 893 100.0% Speak English very well1.5% of residents speak other language at home 107 94.7% Speak English very well6 5.3% Speak English less than very well
English speakers - Native, born elsewhere 37.2% of residents of Torrington speak English at home.
58.0% of residents speak Spanish at home 244 71.6% Speak English very well97 28.4% Speak English less than very well6.8% of residents speak other language at home 33 82.5% Speak English very well7 17.5% Speak English less than very well
English speakers - Foreign-born 30.8% of residents of Torrington speak English at home.
42.8% of residents speak Spanish at home 582 27.2% Speak English very well1,558 72.8% Speak English less than very well27.2% of residents speak other language at home 811 59.7% Speak English very well548 40.3% Speak English less than very well
White (Caucasian) - Speak only English Native:
98.0% (21,395)Foreign-born:
34.8% (492)
White (Caucasian) - Speak another language Native:
3.0% (648)Foreign-born:
65.9% (932)
Black or African American - Speak only English Native:
86.4% (2,331)Foreign-born:
76.1% (552)
Black or African American - Speak another language Native:
14.1% (382)Foreign-born:
26.4% (191)
American Indian / Alaska Native - Speak only English Native:
7.9% (1)Foreign-born:
72.2% (69)
American Indian / Alaska Native - Speak another language Native:
100.0% (11)Foreign-born:
42.8% (41)
Asian - Speak only English Native:
43.3% (94)Foreign-born:
42.8% (387)
Asian - Speak another language Native:
56.2% (122)Foreign-born:
55.5% (503)
Other race - Speak only English Native:
50.8% (471)Foreign-born:
3.5% (37)
Other race - Speak another language Native:
51.3% (475)Foreign-born:
97.1% (1,050)
Two or more races - Speak only English Native:
77.3% (2,282)Foreign-born:
1.4% (12)
Two or more races - Speak another language Native:
20.1% (594)Foreign-born:
100.0% (844)
White alone - Speak only English Native:
98.1% (20,343)Foreign-born:
42.5% (444)
White alone - Speak another language Native:
1.9% (393)Foreign-born:
57.8% (604)
Hispanic or Latino - Speak only English Native:
60.8% (2,229)Foreign-born:
4.7% (105)
Hispanic or Latino - Speak another language Native:
40.6% (1,487)Foreign-born:
95.5% (2,120)
Foreign-born residents in Torrington 5,004 residents are foreign born (6.4% Latin America , 3.1% Europe , 2.8% Asia ).
This city:
14.0%Connecticut:
15.0%
Marital status for residents in Torrington Marital status - White (Caucasian) population 15 years and over
Males 39.7% Never married43.9% Now married0.8% Separated4.1% Widowed11.5% DivorcedFemales 28.2% Never married42.5% Now married0.9% Separated13.3% Widowed15.1% DivorcedWomen who gave birth in the past 12 months Now married:
85.5% (108)Unmarried:
14.5% (18)
Women who did not give birth in the past 12 months Now married:
35.6% (1,750)Unmarried:
64.4% (3,160)
Marital status - Black or African American population 15 years and over
Males 48.0% Never married36.6% Now married0.0% Separated0.0% Widowed15.4% DivorcedFemales 45.0% Never married22.5% Now married0.0% Separated12.6% Widowed19.9% DivorcedWomen who gave birth in the past 12 months Now married:
0.0% (0)Unmarried:
100.0% (133)
Women who did not give birth in the past 12 months Now married:
8.7% (101)Unmarried:
91.3% (1,055)
Marital status - American Indian / Alaska Native population 15 years and over
Males 0.0% Never married0.0% Now married0.0% Separated0.0% Widowed100.0% DivorcedFemales 46.8% Never married40.3% Now married0.0% Separated0.0% Widowed13.0% DivorcedWomen who did not give birth in the past 12 months Now married:
40.3% (31)Unmarried:
59.7% (46)
Marital status - Asian population 15 years and over
Males 40.2% Never married59.8% Now married0.0% Separated0.0% Widowed0.0% DivorcedFemales 25.7% Never married55.7% Now married4.6% Separated5.7% Widowed8.3% DivorcedWomen who did not give birth in the past 12 months Now married:
60.0% (191)Unmarried:
40.0% (128)
Marital status - Other race population 15 years and over
Males 42.6% Never married53.4% Now married2.2% Separated1.8% Widowed0.0% DivorcedFemales 40.2% Never married35.3% Now married1.7% Separated9.1% Widowed13.6% DivorcedWomen who did not give birth in the past 12 months Now married:
37.3% (250)Unmarried:
62.7% (420)
Marital status - Two or more races population 15 years and over
Males 58.2% Never married39.6% Now married0.0% Separated0.0% Widowed2.3% DivorcedFemales 34.7% Never married43.1% Now married0.0% Separated1.4% Widowed20.8% DivorcedWomen who gave birth in the past 12 months Now married:
100.0% (26)Unmarried:
0.0% (0)
Women who did not give birth in the past 12 months Now married:
21.0% (179)Unmarried:
79.0% (671)
Marital status - White alone, not Hispanic / Latino population 15 years and over
Males 36.9% Never married46.0% Now married0.6% Separated4.3% Widowed12.2% DivorcedFemales 27.1% Never married42.6% Now married1.0% Separated13.3% Widowed16.1% DivorcedWomen who gave birth in the past 12 months Now married:
85.5% (114)Unmarried:
14.5% (19)
Women who did not give birth in the past 12 months Now married:
35.3% (1,569)Unmarried:
64.7% (2,879)
Marital status - Hispanic or Latino population 15 years and over
Males 56.1% Never married38.9% Now married1.5% Separated1.4% Widowed2.1% DivorcedFemales 41.1% Never married37.1% Now married0.5% Separated8.1% Widowed13.1% DivorcedWomen who gave birth in the past 12 months Now married:
0.0% (0)Unmarried:
100.0% (102)
Women who did not give birth in the past 12 months Now married:
34.5% (610)Unmarried:
65.5% (1,160)
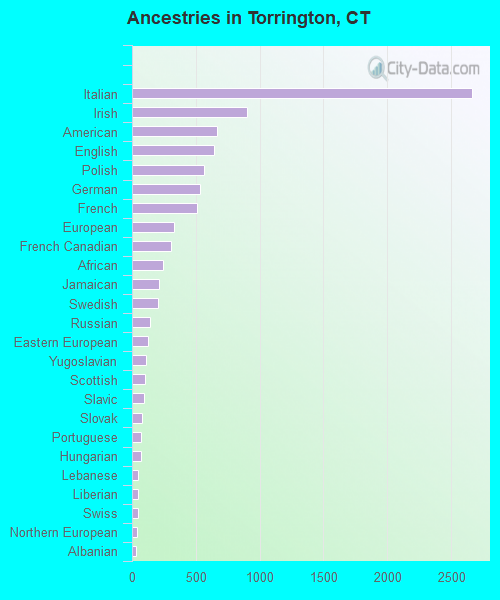
Ancestries in Torrington
2,664 16.4% Italian904 5.6% Irish665 4.1% American644 4.0% English564 3.5% Polish534 3.3% German507 3.1% French328 2.0% European303 1.9% French Canadian242 1.5% African208 1.3% Jamaican203 1.2% Swedish141 0.9% Russian124 0.8% Eastern European109 0.7% Yugoslavian99 0.6% Scottish95 0.6% Slavic76 0.5% Slovak72 0.4% Portuguese72 0.4% Hungarian47 0.3% Lebanese47 0.3% Liberian45 0.3% Swiss36 0.2% Northern European33 0.2% Albanian30 0.2% Romanian28 0.2% Soviet Union25 0.2% Scotch-Irish24 0.1% Serbian24 0.1% Macedonian24 0.1% Lithuanian24 0.1% Ukrainian22 0.1% Czech17 0.1% Estonian12 0.07% Norwegian11 0.07% Canadian8 0.05% Greek8 0.05% Dutch6 0.04% Armenian5 0.03% British3 0.02% Welsh2 0.01% Czechoslovakian1 0.01% Somali
Geographical mobility in Torrington Same house 1 year ago 21,266 88.7% White (Caucasian)2,665 73.6% Black or African American84 94.8% American Indian / Alaska Native1,098 89.4% Asian2,019 95.0% Other race3,670 84.6% Two or more races19,860 89.0% White alone, not Hispanic / Latino5,579 86.2% Hispanic or LatinoMoved within same county 1,351 5.6% White / Caucasian143 4.0% Black or African American95 7.8% Asian54 2.5% Other race98 2.3% Two or more races1,257 5.6% White alone, not Hispanic / Latino400 6.2% Hispanic or LatinoMoved within same state 791 3.3% White / Caucasian241 6.6% Black or African American55 2.6% Other race76 1.7% Two or more races666 3.0% White alone, not Hispanic / Latino259 4.0% Hispanic or LatinoMoved from different state 281 1.2% White / Caucasian382 10.5% Black or African American584 13.5% Two or more races286 1.3% White alone, not Hispanic / Latino99 1.5% Hispanic or LatinoMoved from abroad 20 0.1% White385 10.6% Black or African American21 0.1% White alone, not Hispanic / Latino78 1.2% Hispanic or Latino
Children Nativity (place of birth) in Torrington
Children under 6 years - Living with two parents Both parents native 823 100.0% NativeBoth parents foreign-born 215 100.0% NativeOne native, one foreign-born parent 69 100.0% NativeChildren under 6 years - Living with one parent Native parent 695 100.0% NativeForeign-born parent 283 100.0% NativeChildren 6 to 17 years - Living with two parents Both parents native 1,854 99.7% Native6 0.3% Foreign-bornBoth parents foreign-born 375 76.8% Native113 23.2% Foreign-bornOne native, one foreign-born parent 118 100.0% NativeChildren 6 to 17 years - Living with one parent Native parent 1,064 100.0% NativeForeign-born parent 496 59.9% Native332 40.1% Foreign-born
Grandparents responsible for own grandchildren in Torrington
Grandparents (30 to 59 years) White / Caucasian 41 42.1% Responsible for grandchildren56 57.9% Not responsible for grandchildrenBlack or African American 138 100.0% Not responsible for grandchildrenAmerican Indian / Alaska Native 11 100.0% Not responsible for grandchildrenTwo or more races 301 78.9% Responsible for grandchildren81 21.1% Not responsible for grandchildrenWhite alone, not Hispanic / Latino 9 10.2% Responsible for grandchildren75 89.8% Not responsible for grandchildrenHispanic or Latino 158 72.1% Responsible for grandchildren61 27.9% Not responsible for grandchildrenGrandparents (60 years and over) White / Caucasian 52 22.2% Responsible for grandchildren183 77.8% Not responsible for grandchildrenWhite alone, not Hispanic / Latino 56 29.6% Responsible for grandchildren132 70.4% Not responsible for grandchildrenHispanic or Latino 66 100.0% Not responsible for grandchildren