Races in Topeka, Kansas (KS) Detailed Stats
Data:
Races - White alone (%)
Races - White alone (% change since 2000)
Races - Black alone (%)
Races - Black alone (% change since 2000)
Races - American Indian alone (%)
Races - American Indian alone (% change since 2000)
Races - Asian alone (%)
Races - Asian alone (% change since 2000)
Races - Hispanic (%)
Races - Hispanic (% change since 2000)
Races - Native Hawaiian and Other Pacific Islander alone (%)
Races - Native Hawaiian and Other Pacific Islander alone (% change since 2000)
Races - Two or more races(%)
Races - Two or more races(% change since 2000)
Races - Other race alone (%)
Races - Other race alone (% change since 2000)
Racial diversity
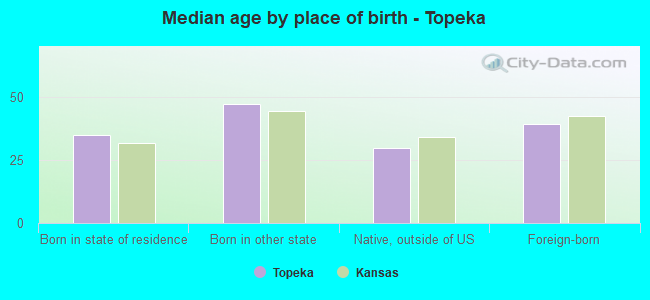
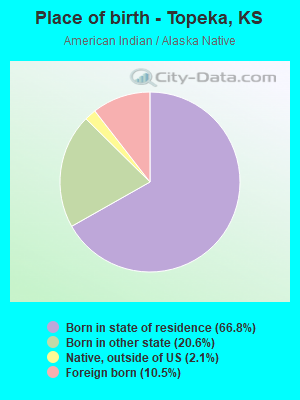
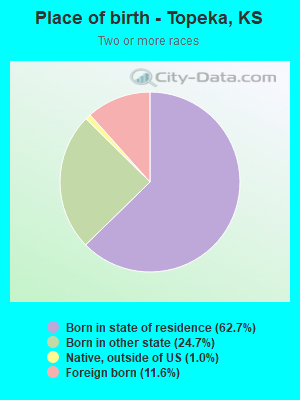
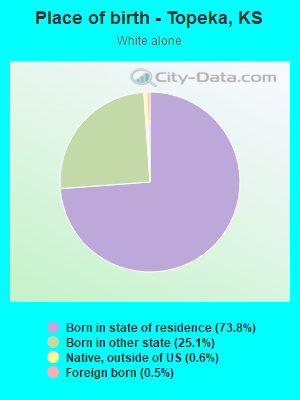
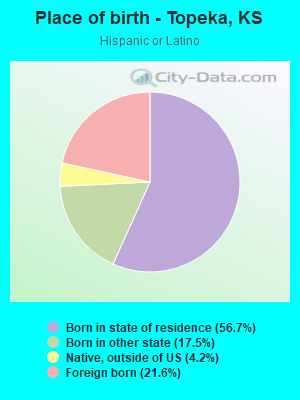
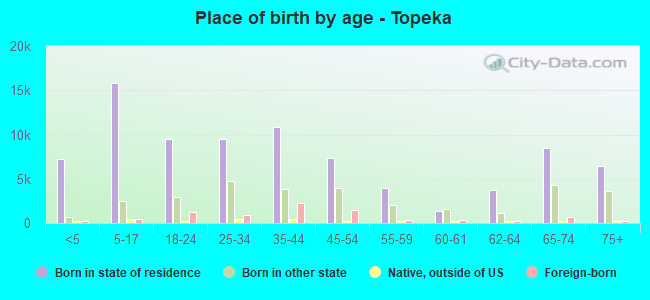
Place of birth - Born in state of residence (%)
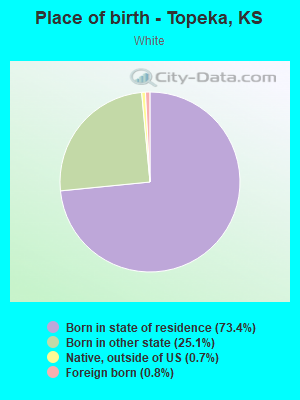
Place of birth - Born in state of residence (%) - White
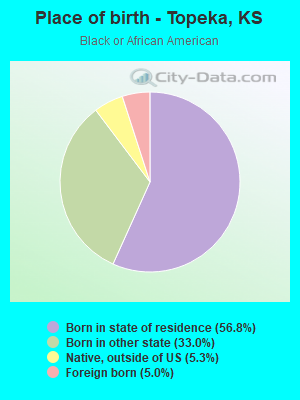
Place of birth - Born in state of residence (%) - Black or African American
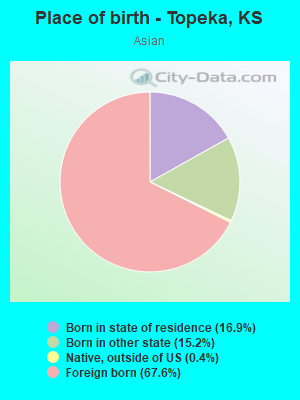
Place of birth - Born in state of residence (%) - Asian
Place of birth - Born in state of residence (%) - Hispanic or Latino
Place of birth - Born in state of residence (%) - American Indian and Alaska Native
Place of birth - Born in state of residence (%) - Multirace
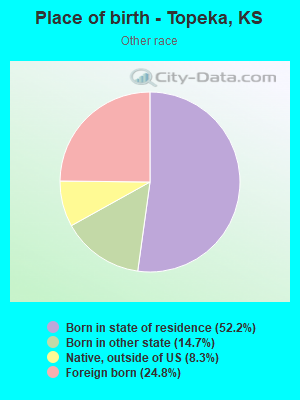
Place of birth - Born in state of residence (%) - Other Race
Place of birth - Born in other state (%)
Place of birth - Born in other state (%) - White
Place of birth - Born in other state (%) - Black or African American
Place of birth - Born in other state (%) - Asian
Place of birth - Born in other state (%) - Hispanic or Latino
Place of birth - Born in other state (%) - American Indian and Alaska Native
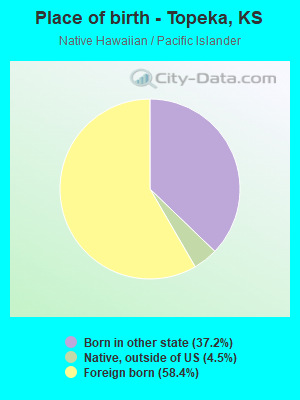
Place of birth - Born in other state (%) - Multirace
Place of birth - Born in other state (%) - Other Race
Place of birth - Native, outside of US (%)
Place of birth - Native, outside of US (%) - White
Place of birth - Native, outside of US (%) - Black or African American
Place of birth - Native, outside of US (%) - Asian
Place of birth - Native, outside of US (%) - Hispanic or Latino
Place of birth - Native, outside of US (%) - American Indian and Alaska Native
Place of birth - Native, outside of US (%) - Multirace
Place of birth - Native, outside of US (%) - Other Race
Place of birth - Foreign born (%)
Place of birth - Foreign born (%) - White
Place of birth - Foreign born (%) - Black or African American
Place of birth - Foreign born (%) - Asian
Place of birth - Foreign born (%) - Hispanic or Latino
Place of birth - Foreign born (%) - American Indian and Alaska Native
Place of birth - Foreign born (%) - Multirace
Place of birth - Foreign born (%) - Other Race
Residents speaking English at home (%)
Residents speaking English at home - Born in the United States (%)
Residents speaking English at home - Native, born elsewhere (%)
Residents speaking English at home - Foreign born (%)
Residents speaking Spanish at home (%)
Residents speaking Spanish at home - Born in the United States (%)
Residents speaking Spanish at home - Native, born elsewhere (%)
Residents speaking Spanish at home - Foreign born (%)
Residents speaking other language at home (%)
Residents speaking other language at home - Born in the United States (%)
Residents speaking other language at home - Native, born elsewhere (%)
Residents speaking other language at home - Foreign born (%)
Marital status - Never married (%)
Marital status - Now married (%)
Marital status - Separated (%)
Marital status - Widowed (%)
Marital status - Divorced (%)
Ancestries Reported - Arab (%)
Ancestries Reported - Czech (%)
Ancestries Reported - Danish (%)
Ancestries Reported - Dutch (%)
Ancestries Reported - English (%)
Ancestries Reported - French (%)
Ancestries Reported - French Canadian (%)
Ancestries Reported - German (%)
Ancestries Reported - Greek (%)
Ancestries Reported - Hungarian (%)
Ancestries Reported - Irish (%)
Ancestries Reported - Italian (%)
Ancestries Reported - Lithuanian (%)
Ancestries Reported - Norwegian (%)
Ancestries Reported - Polish (%)
Ancestries Reported - Portuguese (%)
Ancestries Reported - Russian (%)
Ancestries Reported - Scotch-Irish (%)
Ancestries Reported - Scottish (%)
Ancestries Reported - Slovak (%)
Ancestries Reported - Subsaharan African (%)
Ancestries Reported - Swedish (%)
Ancestries Reported - Swiss (%)
Ancestries Reported - Ukrainian (%)
Ancestries Reported - United States (%)
Ancestries Reported - Welsh (%)
Ancestries Reported - West Indian (%)
Ancestries Reported - Other (%)
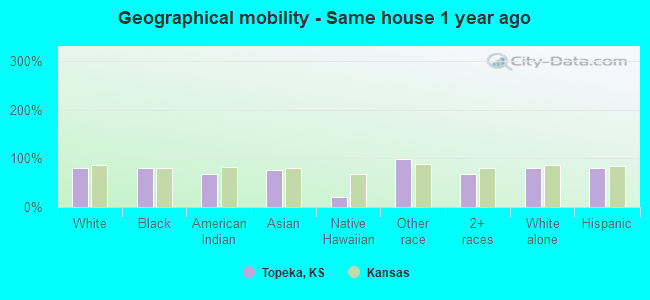
Geographical mobility - Same house 1 year ago (%)
Geographical mobility - Same house 1 year ago (%) - White
Geographical mobility - Same house 1 year ago (%) - Black or African American
Geographical mobility - Same house 1 year ago (%) - Asian
Geographical mobility - Same house 1 year ago (%) - Hispanic or Latino
Geographical mobility - Same house 1 year ago (%) - American Indian and Alaska Native
Geographical mobility - Same house 1 year ago (%) - Multirace
Geographical mobility - Same house 1 year ago (%) - Other Race
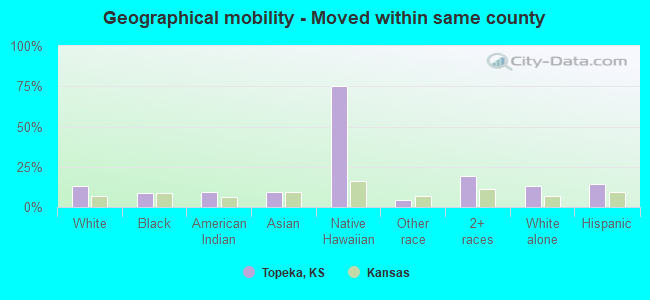
Geographical mobility - Moved within same county (%)
Geographical mobility - Moved within same county (%) - White
Geographical mobility - Moved within same county (%) - Black or African American
Geographical mobility - Moved within same county (%) - Asian
Geographical mobility - Moved within same county (%) - Hispanic or Latino
Geographical mobility - Moved within same county (%) - American Indian and Alaska Native
Geographical mobility - Moved within same county (%) - Multirace
Geographical mobility - Moved within same county (%) - Other Race
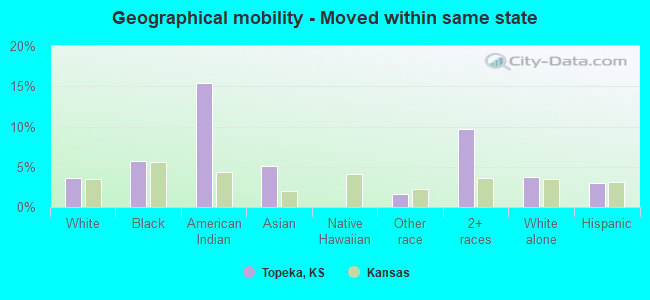
Geographical mobility - Moved from different county within same state (%)
Geographical mobility - Moved from different county within same state (%) - White
Geographical mobility - Moved from different county within same state (%) - Black or African American
Geographical mobility - Moved from different county within same state (%) - Asian
Geographical mobility - Moved from different county within same state (%) - Hispanic or Latino
Geographical mobility - Moved from different county within same state (%) - American Indian and Alaska Native
Geographical mobility - Moved from different county within same state (%) - Multirace
Geographical mobility - Moved from different county within same state (%) - Other Race
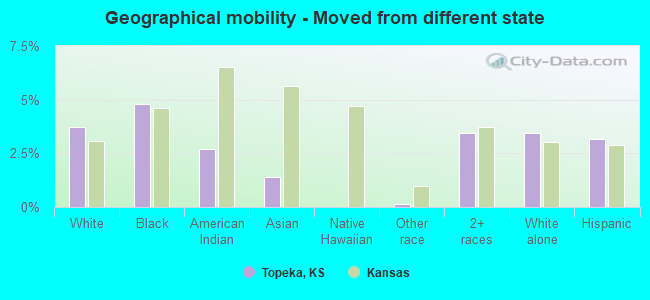
Geographical mobility - Moved from different state (%)
Geographical mobility - Moved from different state (%) - White
Geographical mobility - Moved from different state (%) - Black or African American
Geographical mobility - Moved from different state (%) - Asian
Geographical mobility - Moved from different state (%) - Hispanic or Latino
Geographical mobility - Moved from different state (%) - American Indian and Alaska Native
Geographical mobility - Moved from different state (%) - Multirace
Geographical mobility - Moved from different state (%) - Other Race
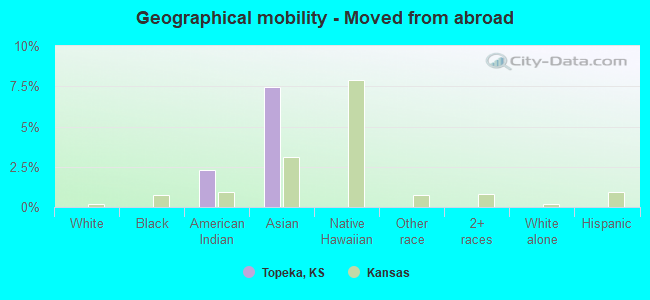
Geographical mobility - Moved from abroad (%)
Geographical mobility - Moved from abroad (%) - White
Geographical mobility - Moved from abroad (%) - Black or African American
Geographical mobility - Moved from abroad (%) - Asian
Geographical mobility - Moved from abroad (%) - Hispanic or Latino
Geographical mobility - Moved from abroad (%) - American Indian and Alaska Native
Geographical mobility - Moved from abroad (%) - Multirace
Geographical mobility - Moved from abroad (%) - Other Race
Place of birth for the foreign-born population - Ireland (%)
Place of birth for the foreign-born population - Denmark (%)
Place of birth for the foreign-born population - Norway (%)
Place of birth for the foreign-born population - Sweden (%)
Place of birth for the foreign-born population - United Kingdom (%)
Place of birth for the foreign-born population - England (%)
Place of birth for the foreign-born population - Scotland (%)
Place of birth for the foreign-born population - Other Northern Europe (%)
Place of birth for the foreign-born population - Austria (%)
Place of birth for the foreign-born population - Belgium (%)
Place of birth for the foreign-born population - France (%)
Place of birth for the foreign-born population - Germany (%)
Place of birth for the foreign-born population - Netherlands (%)
Place of birth for the foreign-born population - Switzerland (%)
Place of birth for the foreign-born population - Other Western Europe (%)
Place of birth for the foreign-born population - Greece (%)
Place of birth for the foreign-born population - Italy (%)
Place of birth for the foreign-born population - Portugal (%)
Place of birth for the foreign-born population - Spain (%)
Place of birth for the foreign-born population - Other Southern Europe (%)
Place of birth for the foreign-born population - Albania (%)
Place of birth for the foreign-born population - Belarus (%)
Place of birth for the foreign-born population - Bosnia and Herzegovina (%)
Place of birth for the foreign-born population - Bulgaria (%)
Place of birth for the foreign-born population - Croatia (%)
Place of birth for the foreign-born population - Czechoslovakia (%)
Place of birth for the foreign-born population - Hungary (%)
Place of birth for the foreign-born population - Latvia (%)
Place of birth for the foreign-born population - Lithuania (%)
Place of birth for the foreign-born population - North Macedonia (Macedonia) (%)
Place of birth for the foreign-born population - Moldova (%)
Place of birth for the foreign-born population - Poland (%)
Place of birth for the foreign-born population - Romania (%)
Place of birth for the foreign-born population - Russia (%)
Place of birth for the foreign-born population - Serbia (%)
Place of birth for the foreign-born population - Ukraine (%)
Place of birth for the foreign-born population - Other Eastern Europe (%)
Place of birth for the foreign-born population - China (%)
Place of birth for the foreign-born population - Hong Kong (%)
Place of birth for the foreign-born population - Taiwan (%)
Place of birth for the foreign-born population - Japan (%)
Place of birth for the foreign-born population - Korea (%)
Place of birth for the foreign-born population - Other Eastern Asia (%)
Place of birth for the foreign-born population - Afghanistan (%)
Place of birth for the foreign-born population - Bangladesh (%)
Place of birth for the foreign-born population - India (%)
Place of birth for the foreign-born population - Iran (%)
Place of birth for the foreign-born population - Kazakhstan (%)
Place of birth for the foreign-born population - Nepal (%)
Place of birth for the foreign-born population - Pakistan (%)
Place of birth for the foreign-born population - Sri Lanka (%)
Place of birth for the foreign-born population - Uzbekistan (%)
Place of birth for the foreign-born population - Other South Central Asia (%)
Place of birth for the foreign-born population - Burma (%)
Place of birth for the foreign-born population - Cambodia (%)
Place of birth for the foreign-born population - Indonesia (%)
Place of birth for the foreign-born population - Laos (%)
Place of birth for the foreign-born population - Malaysia (%)
Place of birth for the foreign-born population - Philippines (%)
Place of birth for the foreign-born population - Singapore (%)
Place of birth for the foreign-born population - Thailand (%)
Place of birth for the foreign-born population - Vietnam (%)
Place of birth for the foreign-born population - Other South Eastern Asia (%)
Place of birth for the foreign-born population - Armenia (%)
Place of birth for the foreign-born population - Iraq (%)
Place of birth for the foreign-born population - Israel (%)
Place of birth for the foreign-born population - Jordan (%)
Place of birth for the foreign-born population - Kuwait (%)
Place of birth for the foreign-born population - Lebanon (%)
Place of birth for the foreign-born population - Saudi Arabia (%)
Place of birth for the foreign-born population - Syria (%)
Place of birth for the foreign-born population - Turkey (%)
Place of birth for the foreign-born population - Yemen (%)
Place of birth for the foreign-born population - Other Western Asia (%)
Place of birth for the foreign-born population - Eritrea (%)
Place of birth for the foreign-born population - Ethiopia (%)
Place of birth for the foreign-born population - Kenya (%)
Place of birth for the foreign-born population - Somalia (%)
Place of birth for the foreign-born population - Uganda (%)
Place of birth for the foreign-born population - Zimbabwe (%)
Place of birth for the foreign-born population - Other Eastern Africa (%)
Place of birth for the foreign-born population - Cameroon (%)
Place of birth for the foreign-born population - Congo (%)
Place of birth for the foreign-born population - Democratic Republic of Congo (Zaire) (%)
Place of birth for the foreign-born population - Other Middle Africa (%)
Place of birth for the foreign-born population - Egypt (%)
Place of birth for the foreign-born population - Morocco (%)
Place of birth for the foreign-born population - Sudan (%)
Place of birth for the foreign-born population - Other Northern Africa (%)
Place of birth for the foreign-born population - South Africa (%)
Place of birth for the foreign-born population - Other Southern Africa (%)
Place of birth for the foreign-born population - Cabo Verde (%)
Place of birth for the foreign-born population - Ghana (%)
Place of birth for the foreign-born population - Liberia (%)
Place of birth for the foreign-born population - Nigeria (%)
Place of birth for the foreign-born population - Senegal (%)
Place of birth for the foreign-born population - Sierra Leone (%)
Place of birth for the foreign-born population - Other Western Africa (%)
Place of birth for the foreign-born population - Australia (%)
Place of birth for the foreign-born population - New Zealand (%)
Place of birth for the foreign-born population - Fiji (%)
Place of birth for the foreign-born population - Micronesia (%)
Place of birth for the foreign-born population - Bahamas (%)
Place of birth for the foreign-born population - Barbados (%)
Place of birth for the foreign-born population - Cuba (%)
Place of birth for the foreign-born population - Dominica (%)
Place of birth for the foreign-born population - Dominican Republic (%)
Place of birth for the foreign-born population - Grenada (%)
Place of birth for the foreign-born population - Haiti (%)
Place of birth for the foreign-born population - Jamaica (%)
Place of birth for the foreign-born population - St. Vincent and the Grenadines (%)
Place of birth for the foreign-born population - Trinidad and Tobago (%)
Place of birth for the foreign-born population - West Indies (%)
Place of birth for the foreign-born population - Other Caribbean (%)
Place of birth for the foreign-born population - Belize (%)
Place of birth for the foreign-born population - Costa Rica (%)
Place of birth for the foreign-born population - El Salvador (%)
Place of birth for the foreign-born population - Guatemala (%)
Place of birth for the foreign-born population - Honduras (%)
Place of birth for the foreign-born population - Mexico (%)
Place of birth for the foreign-born population - Nicaragua (%)
Place of birth for the foreign-born population - Panama (%)
Place of birth for the foreign-born population - Other Central America (%)
Place of birth for the foreign-born population - Argentina (%)
Place of birth for the foreign-born population - Bolivia (%)
Place of birth for the foreign-born population - Brazil (%)
Place of birth for the foreign-born population - Chile (%)
Place of birth for the foreign-born population - Colombia (%)
Place of birth for the foreign-born population - Ecuador (%)
Place of birth for the foreign-born population - Guyana (%)
Place of birth for the foreign-born population - Peru (%)
Place of birth for the foreign-born population - Uruguay (%)
Place of birth for the foreign-born population - Venezuela (%)
Place of birth for the foreign-born population - Other South America (%)
Place of birth for the foreign-born population - Canada (%)
Place of birth for the foreign-born population - Other Northern America (%)
Place of birth for the foreign-born population - Other (%)
Latest news about races in Topeka, KS collected exclusively by city-data.com from local newspapers, TV, and radio stations
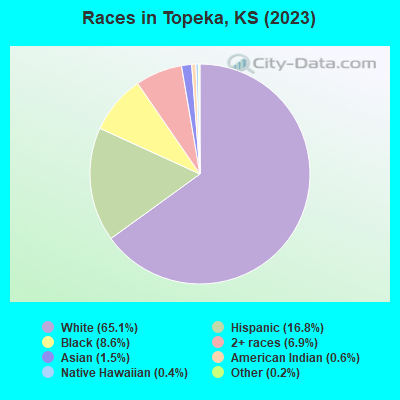
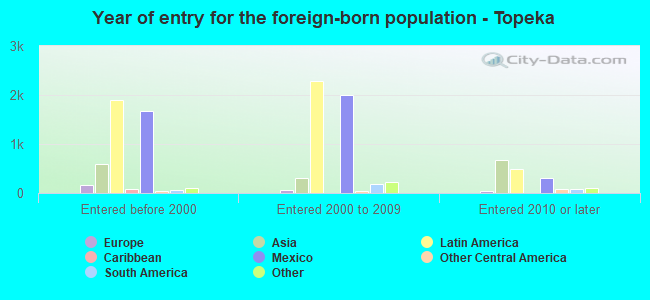
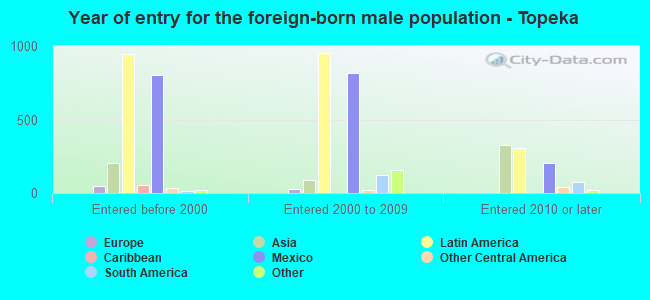
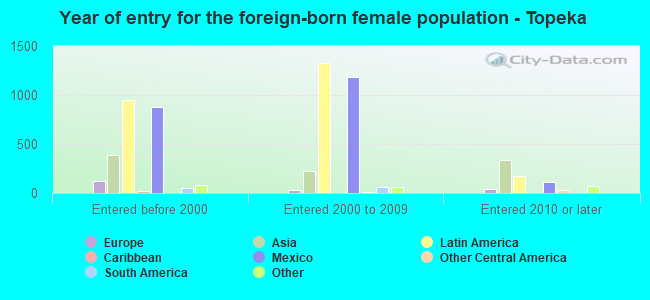
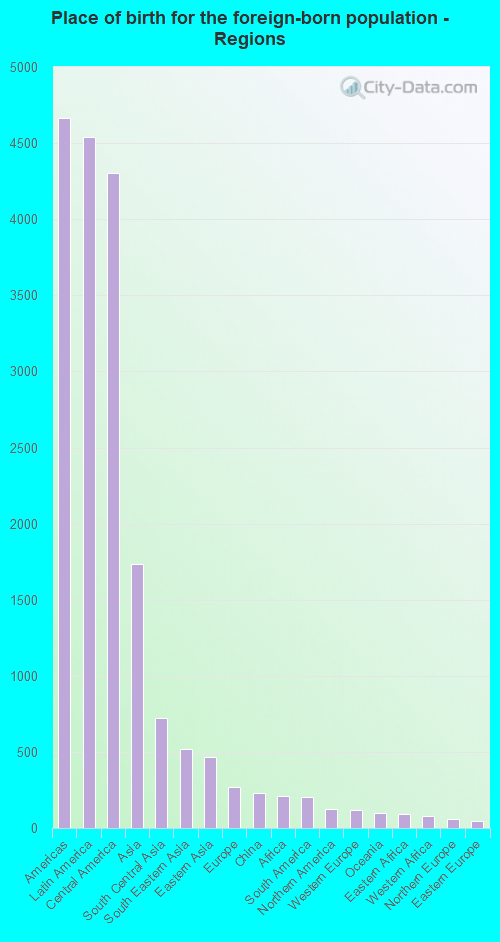
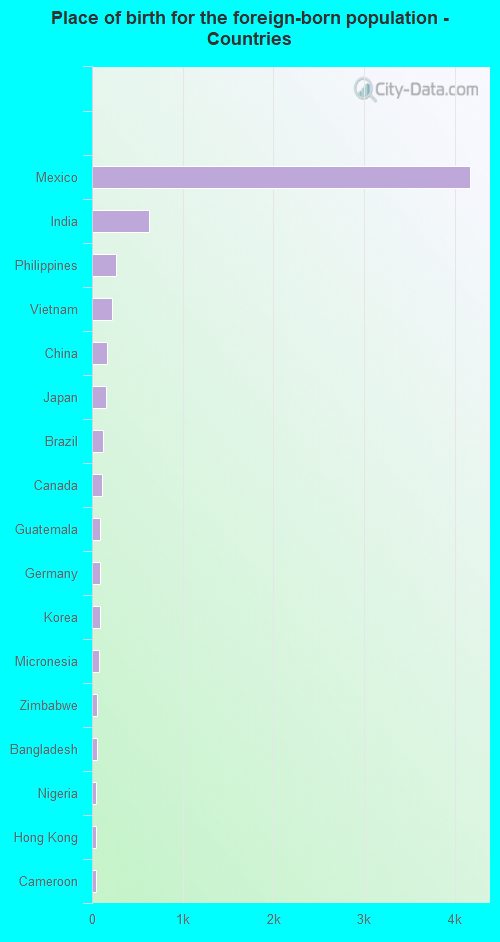
According to 2022 data, the most numerous races in Topeka, KS are White alone (80,742 residents), Hispanic (20,487 residents), and Black alone (11,457 residents). 88.8% of Topeka residents speak English at home. 5.6% of Topeka, KS residents are foreign-born (3.5% born in Latin America, 1.3% born in Asia), which is 25.9% less than the foreign-born rate of 7.0% across the entire state of Kansas.
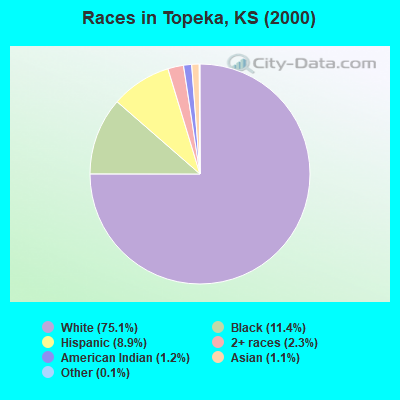
Race distribution in Topeka
2000 2022
91,869 75.1% White alone 13,941 11.4% Black alone 10,847 8.9% Hispanic 2,804 2.3% Two or more races 1,413 1.2% American Indian alone 1,300 1.1% Asian alone 160 0.1% Other race alone 43 0.04% Native Hawaiian and Other
80,742 64.4% White alone 20,487 16.3% Hispanic 11,457 9.1% Black alone 7,944 6.3% Two or more races 2,407 1.9% Asian alone 1,053 0.8% Other race alone 997 0.8% Native Hawaiian and Other 377 0.3% American Indian alone
2000 2022
2,233,997 83.1% White alone 188,252 7.0% Hispanic 151,407 5.6% Black alone 46,301 1.7% Asian alone 42,508 1.6% Two or more races 22,322 0.8% American Indian alone 2,477 0.09% Other race alone 1,154 0.04% Native Hawaiian and Other
2,147,943 73.1% White alone 381,746 13.0% Hispanic 147,666 5.0% Black alone 145,362 4.9% Two or more races 85,085 2.9% Asian alone 13,263 0.5% Other race alone 12,065 0.4% American Indian alone 4,020 0.1% Native Hawaiian and Other
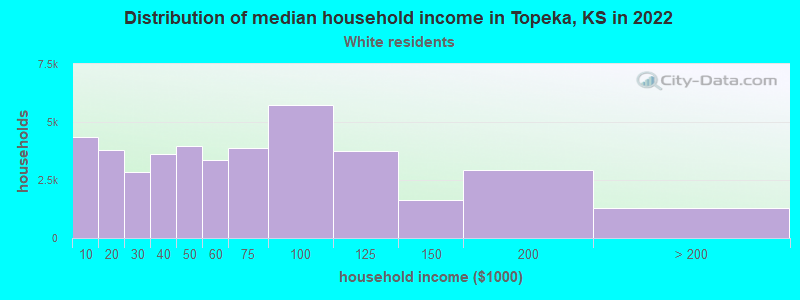
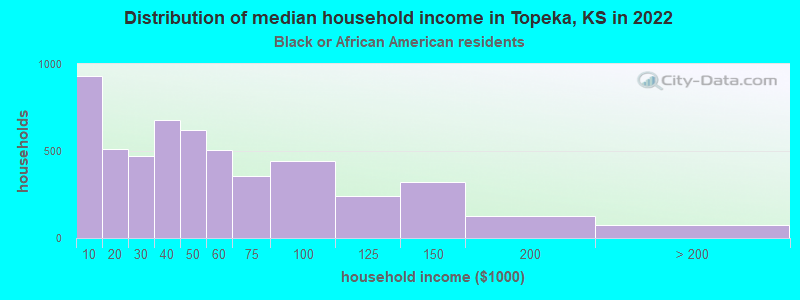
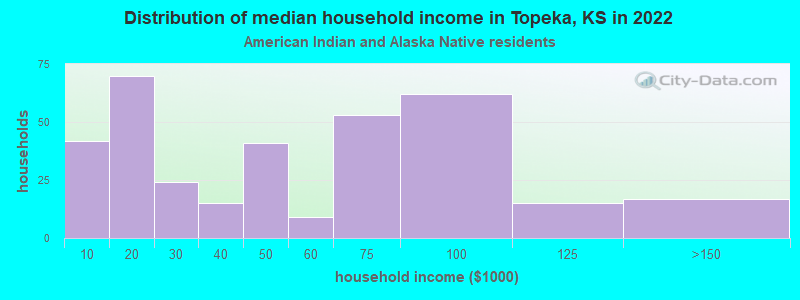
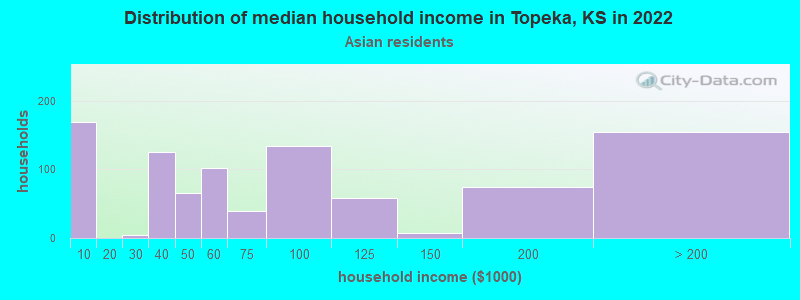
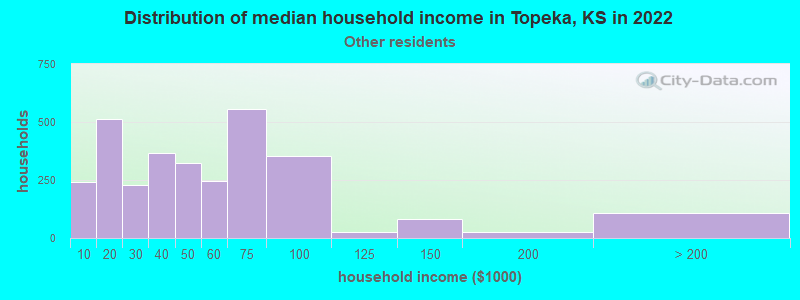
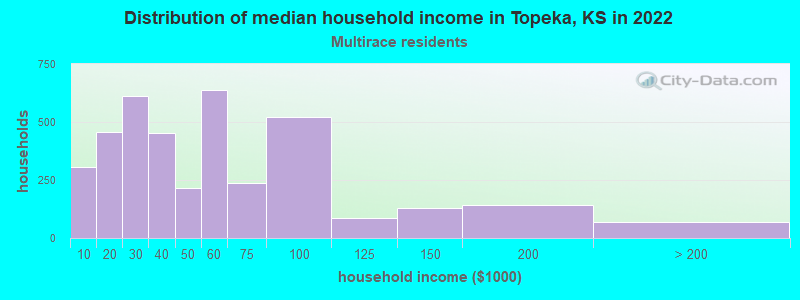
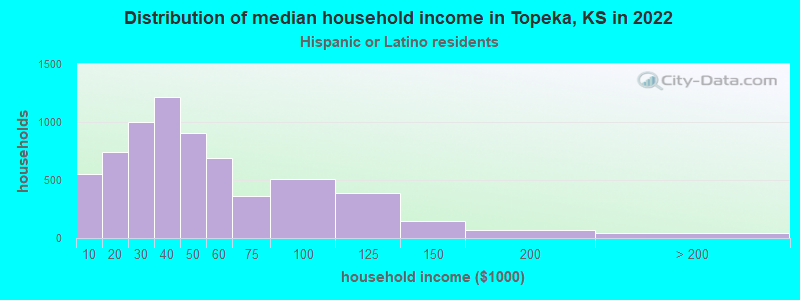
Income and house value in Topeka Median household income in 2022 $54,746 White non-Hispanic householders$34,694 Black householders$86,100 American Indian and Alaska Native householders$65,884 Asian householders$39,369 Some other race householders$48,464 Two or more races householders$39,311 Hispanic or Latino race householdersMedian 2022 house value $150,739 White Non-Hispanic householders$117,758 Black or African American householders$149,470 American Indian or Alaska Native householders $198,096 Asian householders$90,908 Some other race householders$113,952 Two or more races householders$99,788 Hispanic or Latino householders
Median age by race in Topeka
41.3 Median age for White residents41.2 41.6 37.2 Median age for Black or African American residents35.7 39.9 37.0 Median age for American Indian / Alaska Native residents37.1 31.1 29.5 Median age for Asian residents32.5 24.1 16.1 Median age for Native Hawaiian / Pacific Islander residents-666,666,666.0 -666,666,666.0 28.0 Median age for Other race residents24.1 35.9 23.6 Median age for Two or more races residents20.2 26.0 43.0 Median age for White alone residents42.4 43.9 25.7 Median age for Hispanic or Latino residents22.6 26.1
Owner/renter occupied households by race in Topeka
House owners and renters - White residents 25,648 62.2% Owner occupied15,579 37.8% Renter occupiedHouse owners and renters - Black or African American residents 2,641 48.3% Owner occupied2,829 51.7% Renter occupiedHouse owners and renters - American Indian / Alaska Native residents 177 57.2% Owner occupied132 42.8% Renter occupiedHouse owners and renters - Asian residents 591 70.4% Owner occupied248 29.6% Renter occupiedHouse owners and renters - Native Hawaiian / Pacific Islander residents 2 4.5% Owner occupied36 95.5% Renter occupiedHouse owners and renters - Other race residents 1,247 41.8% Owner occupied1,739 58.2% Renter occupiedHouse owners and renters - Two or more races residents 2,753 59.0% Owner occupied1,912 41.0% Renter occupiedHouse owners and renters - White alone residents 24,714 62.4% Owner occupied14,920 37.6% Renter occupiedHouse owners and renters - Hispanic or Latino residents 3,720 56.2% Owner occupied2,905 43.8% Renter occupied
Language usage in Topeka
English speakers - Total 88.8% of residents of Topeka speak English at home.
8.9% of residents speak Spanish at home 5,938 56.9% Speak English very well4,501 43.1% Speak English less than very well2.3% of residents speak other language at home 1,214 44.4% Speak English very well1,519 55.6% Speak English less than very well
English speakers - Born in the United States 91.7% of residents of Topeka speak English at home.
6.8% of residents speak Spanish at home 1,610 77.0% Speak English very well480 23.0% Speak English less than very well1.5% of residents speak other language at home 121 26.0% Speak English very well344 74.0% Speak English less than very well
English speakers - Native, born elsewhere 93.0% of residents of Topeka speak English at home.
7.0% of residents speak Spanish at home 65 43.9% Speak English very well83 56.1% Speak English less than very well
English speakers - Foreign-born 20.3% of residents of Topeka speak English at home.
51.9% of residents speak Spanish at home 838 20.5% Speak English very well3,253 79.5% Speak English less than very well27.8% of residents speak other language at home 1,017 46.4% Speak English very well1,175 53.6% Speak English less than very well
White (Caucasian) - Speak only English Native:
98.3% (79,397)Foreign-born:
47.9% (326)
White (Caucasian) - Speak another language Native:
1.7% (1,373)Foreign-born:
52.1% (355)
Black or African American - Speak only English Native:
97.6% (10,630)Foreign-born:
35.3% (89)
Black or African American - Speak another language Native:
2.2% (237)Foreign-born:
66.1% (166)
American Indian / Alaska Native - Speak another language Native:
14.6% (126)Foreign-born:
100.0% (114)
Asian - Speak only English Native:
77.2% (469)Foreign-born:
21.5% (325)
Asian - Speak another language Native:
26.5% (161)Foreign-born:
78.2% (1,186)
Native Hawaiian / Pacific Islander - Speak only English Native:
79.4% (100)Foreign-born:
50.7% (75)
Other race - Speak only English Native:
61.8% (4,041)Foreign-born:
15.0% (350)
Other race - Speak another language Native:
38.2% (2,497)Foreign-born:
85.0% (1,982)
Two or more races - Speak only English Native:
83.3% (8,312)Foreign-born:
4.0% (62)
Two or more races - Speak another language Native:
17.9% (1,791)Foreign-born:
95.9% (1,506)
White alone - Speak only English Native:
99.3% (77,910)Foreign-born:
56.6% (225)
White alone - Speak another language Native:
0.8% (604)Foreign-born:
41.2% (163)
Hispanic or Latino - Speak only English Native:
62.3% (8,712)Foreign-born:
8.2% (361)
Hispanic or Latino - Speak another language Native:
37.7% (5,264)Foreign-born:
91.8% (4,062)
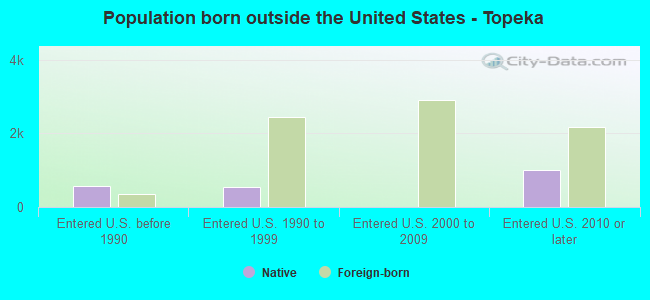
Foreign-born residents in Topeka 6,983 residents are foreign born (3.5% Latin America , 1.3% Asia ).
This city:
5.6%Kansas:
7.1%
Marital status for residents in Topeka Marital status - White (Caucasian) population 15 years and over
Males 36.8% Never married44.4% Now married0.9% Separated4.8% Widowed13.1% DivorcedFemales 30.5% Never married41.3% Now married0.8% Separated11.0% Widowed16.4% DivorcedWomen who gave birth in the past 12 months Now married:
66.8% (550)Unmarried:
33.2% (273)
Women who did not give birth in the past 12 months Now married:
37.9% (6,846)Unmarried:
62.1% (11,218)
Marital status - Black or African American population 15 years and over
Males 46.2% Never married27.5% Now married0.0% Separated3.4% Widowed22.9% DivorcedFemales 40.7% Never married23.2% Now married3.5% Separated8.9% Widowed23.7% DivorcedWomen who gave birth in the past 12 months Now married:
58.1% (95)Unmarried:
41.9% (68)
Women who did not give birth in the past 12 months Now married:
29.2% (866)Unmarried:
70.8% (2,100)
Marital status - American Indian / Alaska Native population 15 years and over
Males 33.8% Never married35.3% Now married3.4% Separated1.3% Widowed26.3% DivorcedFemales 24.0% Never married30.1% Now married0.0% Separated18.8% Widowed27.1% DivorcedWomen who did not give birth in the past 12 months Now married:
12.9% (25)Unmarried:
87.1% (169)
Marital status - Asian population 15 years and over
Males 47.7% Never married45.2% Now married1.0% Separated1.1% Widowed5.0% DivorcedFemales 22.5% Never married62.2% Now married0.0% Separated6.8% Widowed8.4% DivorcedWomen who gave birth in the past 12 months Now married:
100.0% (36)Unmarried:
0.0% (0)
Women who did not give birth in the past 12 months Now married:
61.4% (415)Unmarried:
38.6% (261)
Marital status - Native Hawaiian / Pacific Islander population 15 years and over
Males 38.5% Never married61.5% Now married0.0% Separated0.0% Widowed0.0% DivorcedFemales 96.2% Never married3.8% Now married0.0% Separated0.0% Widowed0.0% DivorcedWomen who did not give birth in the past 12 months Now married:
3.8% (2)Unmarried:
96.2% (54)
Marital status - Other race population 15 years and over
Males 52.5% Never married42.8% Now married0.0% Separated3.0% Widowed1.8% DivorcedFemales 50.6% Never married33.8% Now married0.0% Separated2.0% Widowed13.7% DivorcedWomen who gave birth in the past 12 months Now married:
72.9% (54)Unmarried:
27.1% (20)
Women who did not give birth in the past 12 months Now married:
46.7% (979)Unmarried:
53.3% (1,117)
Marital status - Two or more races population 15 years and over
Males 54.9% Never married32.5% Now married3.2% Separated2.7% Widowed6.8% DivorcedFemales 31.6% Never married41.9% Now married1.1% Separated9.4% Widowed16.1% DivorcedWomen who gave birth in the past 12 months Now married:
45.1% (153)Unmarried:
54.9% (186)
Women who did not give birth in the past 12 months Now married:
30.8% (1,004)Unmarried:
69.2% (2,254)
Marital status - White alone, not Hispanic / Latino population 15 years and over
Males 36.0% Never married44.4% Now married1.0% Separated5.0% Widowed13.7% DivorcedFemales 29.2% Never married42.1% Now married0.9% Separated11.1% Widowed16.7% DivorcedWomen who gave birth in the past 12 months Now married:
71.0% (550)Unmarried:
29.0% (225)
Women who did not give birth in the past 12 months Now married:
39.2% (6,666)Unmarried:
60.8% (10,330)
Marital status - Hispanic or Latino population 15 years and over
Males 49.1% Never married46.6% Now married0.0% Separated0.8% Widowed3.5% DivorcedFemales 44.9% Never married37.9% Now married0.8% Separated4.7% Widowed11.8% DivorcedWomen who gave birth in the past 12 months Now married:
50.9% (316)Unmarried:
49.1% (305)
Women who did not give birth in the past 12 months Now married:
43.2% (2,177)Unmarried:
56.8% (2,865)
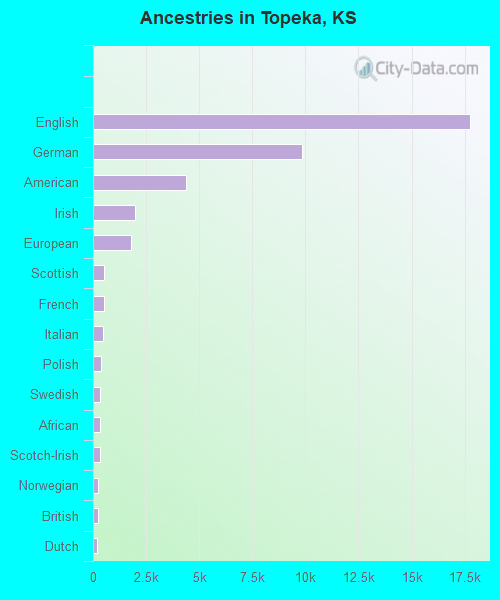
Ancestries in Topeka
17,757 28.0% English9,823 15.5% German4,356 6.9% American1,988 3.1% Irish1,777 2.8% European507 0.8% Scottish504 0.8% French470 0.7% Italian373 0.6% Polish348 0.5% Swedish325 0.5% African315 0.5% Scotch-Irish247 0.4% Norwegian229 0.4% British189 0.3% Dutch108 0.2% Scandinavian105 0.2% Czech91 0.1% Portuguese72 0.1% Welsh71 0.1% Nigerian67 0.1% Swiss66 0.1% Danish64 0.1% Ukrainian61 0.10% Northern European58 0.09% French Canadian54 0.09% German Russian54 0.09% Ghanaian48 0.08% Czechoslovakian38 0.06% Eastern European36 0.06% Russian35 0.06% Austrian35 0.06% Brazilian33 0.05% Croatian32 0.05% Macedonian27 0.04% Hungarian22 0.03% Greek19 0.03% Finnish19 0.03% Haitian17 0.03% Kenyan14 0.02% Armenian13 0.02% Syrian12 0.02% Lithuanian12 0.02% Jamaican10 0.02% Lebanese6 0.01% Belgian5 0.01% Iranian
Geographical mobility in Topeka Same house 1 year ago 67,615 79.7% White (Caucasian)9,004 80.6% Black or African American739 67.3% American Indian / Alaska Native1,727 76.2% Asian31 20.8% Native Hawaiian / Pacific Islander8,646 98.8% Other race9,680 67.8% Two or more races63,784 79.8% White alone, not Hispanic / Latino15,901 79.4% Hispanic or LatinoMoved within same county 10,956 12.9% White / Caucasian1,000 9.0% Black or African American104 9.4% American Indian / Alaska Native217 9.6% Asian113 75.1% Native Hawaiian / Pacific Islander364 4.2% Other race2,715 19.0% Two or more races10,354 13.0% White alone, not Hispanic / Latino2,890 14.4% Hispanic or LatinoMoved within same state 3,043 3.6% White / Caucasian633 5.7% Black or African American170 15.4% American Indian / Alaska Native114 5.0% Asian137 1.6% Other race1,384 9.7% Two or more races2,982 3.7% White alone, not Hispanic / Latino591 3.0% Hispanic or LatinoMoved from different state 3,177 3.7% White / Caucasian536 4.8% Black or African American30 2.7% American Indian / Alaska Native32 1.4% Asian13 0.2% Other race492 3.4% Two or more races2,767 3.5% White alone, not Hispanic / Latino634 3.2% Hispanic or LatinoMoved from abroad 25 2.3% American Indian / Alaska Native169 7.5% Asian
Children Nativity (place of birth) in Topeka
Children under 6 years - Living with two parents Both parents native 3,935 100.0% NativeBoth parents foreign-born 380 89.5% Native45 10.5% Foreign-bornOne native, one foreign-born parent 446 100.0% NativeChildren under 6 years - Living with one parent Native parent 2,625 100.0% NativeForeign-born parent 244 100.0% NativeChildren 6 to 17 years - Living with two parents Both parents native 8,521 99.5% Native39 0.5% Foreign-bornBoth parents foreign-born 1,199 93.7% Native81 6.3% Foreign-bornOne native, one foreign-born parent 614 93.6% Native42 6.4% Foreign-bornChildren 6 to 17 years - Living with one parent Native parent 6,953 100.0% NativeForeign-born parent 564 52.5% Native511 47.5% Foreign-born
Grandparents responsible for own grandchildren in Topeka
Grandparents (30 to 59 years) White / Caucasian 304 44.4% Responsible for grandchildren380 55.6% Not responsible for grandchildrenBlack or African American 81 62.9% Responsible for grandchildren48 37.1% Not responsible for grandchildrenAmerican Indian / Alaska Native 3 100.0% Not responsible for grandchildrenNative Hawaiian / Pacific Islander 30 100.0% Not responsible for grandchildrenOther race 1 96.7% Responsible for grandchildrenTwo or more races 73 98.5% Responsible for grandchildren1 1.5% Not responsible for grandchildrenWhite alone, not Hispanic / Latino 287 41.5% Responsible for grandchildren405 58.5% Not responsible for grandchildrenHispanic or Latino 80 88.1% Responsible for grandchildren11 11.9% Not responsible for grandchildrenGrandparents (60 years and over) White / Caucasian 357 56.6% Responsible for grandchildren273 43.4% Not responsible for grandchildrenBlack or African American 133 67.2% Responsible for grandchildren65 32.8% Not responsible for grandchildrenAmerican Indian / Alaska Native 8 44.3% Responsible for grandchildren10 55.7% Not responsible for grandchildrenOther race 12 18.9% Responsible for grandchildren51 81.1% Not responsible for grandchildrenTwo or more races 14 100.0% Responsible for grandchildrenWhite alone, not Hispanic / Latino 336 52.9% Responsible for grandchildren299 47.1% Not responsible for grandchildrenHispanic or Latino 45 56.7% Responsible for grandchildren35 43.3% Not responsible for grandchildren
Zip codes: 66409 , 66546 , 66603 , 66604 , 66605 , 66606 , 66607 , 66608 , 66609 , 66610 , 66611 , 66612 , 66614 , 66615 , 66616 , 66618 , 66619 , 66621 , 66622 .