Races in Thomasville, Georgia (GA) Detailed Stats
Data:
Races - White alone (%)
Races - White alone (% change since 2000)
Races - Black alone (%)
Races - Black alone (% change since 2000)
Races - American Indian alone (%)
Races - American Indian alone (% change since 2000)
Races - Asian alone (%)
Races - Asian alone (% change since 2000)
Races - Hispanic (%)
Races - Hispanic (% change since 2000)
Races - Native Hawaiian and Other Pacific Islander alone (%)
Races - Native Hawaiian and Other Pacific Islander alone (% change since 2000)
Races - Two or more races(%)
Races - Two or more races(% change since 2000)
Races - Other race alone (%)
Races - Other race alone (% change since 2000)
Racial diversity
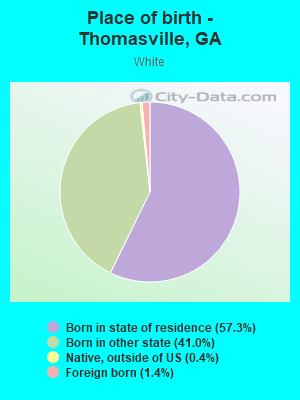
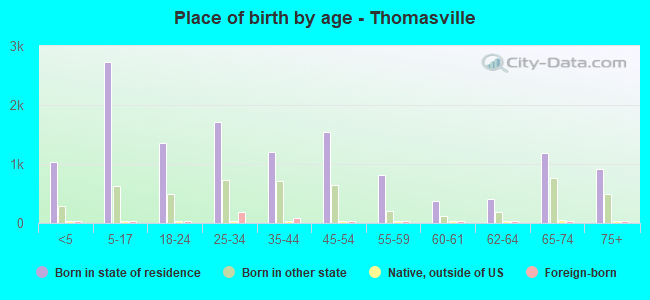
Place of birth - Born in state of residence (%)
Place of birth - Born in state of residence (%) - White
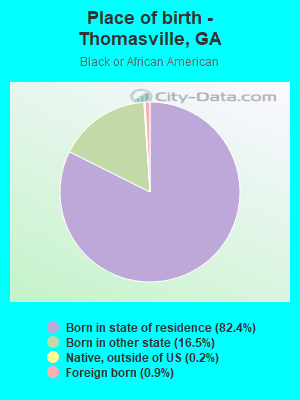
Place of birth - Born in state of residence (%) - Black or African American
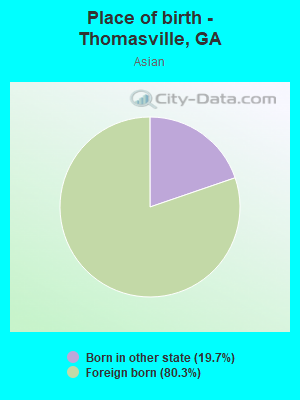
Place of birth - Born in state of residence (%) - Asian
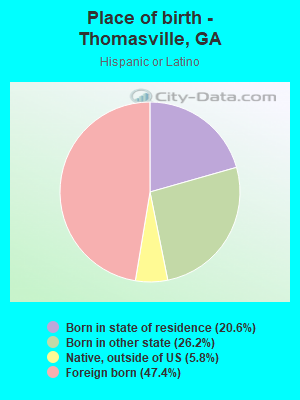
Place of birth - Born in state of residence (%) - Hispanic or Latino
Place of birth - Born in state of residence (%) - American Indian and Alaska Native
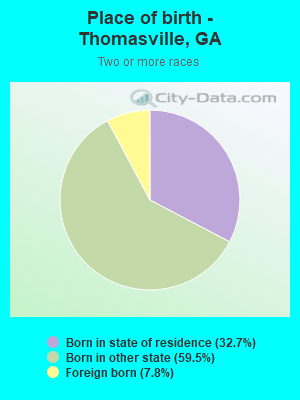
Place of birth - Born in state of residence (%) - Multirace
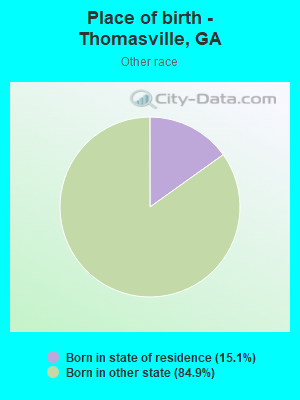
Place of birth - Born in state of residence (%) - Other Race
Place of birth - Born in other state (%)
Place of birth - Born in other state (%) - White
Place of birth - Born in other state (%) - Black or African American
Place of birth - Born in other state (%) - Asian
Place of birth - Born in other state (%) - Hispanic or Latino
Place of birth - Born in other state (%) - American Indian and Alaska Native
Place of birth - Born in other state (%) - Multirace
Place of birth - Born in other state (%) - Other Race
Place of birth - Native, outside of US (%)
Place of birth - Native, outside of US (%) - White
Place of birth - Native, outside of US (%) - Black or African American
Place of birth - Native, outside of US (%) - Asian
Place of birth - Native, outside of US (%) - Hispanic or Latino
Place of birth - Native, outside of US (%) - American Indian and Alaska Native
Place of birth - Native, outside of US (%) - Multirace
Place of birth - Native, outside of US (%) - Other Race
Place of birth - Foreign born (%)
Place of birth - Foreign born (%) - White
Place of birth - Foreign born (%) - Black or African American
Place of birth - Foreign born (%) - Asian
Place of birth - Foreign born (%) - Hispanic or Latino
Place of birth - Foreign born (%) - American Indian and Alaska Native
Place of birth - Foreign born (%) - Multirace
Place of birth - Foreign born (%) - Other Race
Residents speaking English at home (%)
Residents speaking English at home - Born in the United States (%)
Residents speaking English at home - Native, born elsewhere (%)
Residents speaking English at home - Foreign born (%)
Residents speaking Spanish at home (%)
Residents speaking Spanish at home - Born in the United States (%)
Residents speaking Spanish at home - Native, born elsewhere (%)
Residents speaking Spanish at home - Foreign born (%)
Residents speaking other language at home (%)
Residents speaking other language at home - Born in the United States (%)
Residents speaking other language at home - Native, born elsewhere (%)
Residents speaking other language at home - Foreign born (%)
Marital status - Never married (%)
Marital status - Now married (%)
Marital status - Separated (%)
Marital status - Widowed (%)
Marital status - Divorced (%)
Ancestries Reported - Arab (%)
Ancestries Reported - Czech (%)
Ancestries Reported - Danish (%)
Ancestries Reported - Dutch (%)
Ancestries Reported - English (%)
Ancestries Reported - French (%)
Ancestries Reported - French Canadian (%)
Ancestries Reported - German (%)
Ancestries Reported - Greek (%)
Ancestries Reported - Hungarian (%)
Ancestries Reported - Irish (%)
Ancestries Reported - Italian (%)
Ancestries Reported - Lithuanian (%)
Ancestries Reported - Norwegian (%)
Ancestries Reported - Polish (%)
Ancestries Reported - Portuguese (%)
Ancestries Reported - Russian (%)
Ancestries Reported - Scotch-Irish (%)
Ancestries Reported - Scottish (%)
Ancestries Reported - Slovak (%)
Ancestries Reported - Subsaharan African (%)
Ancestries Reported - Swedish (%)
Ancestries Reported - Swiss (%)
Ancestries Reported - Ukrainian (%)
Ancestries Reported - United States (%)
Ancestries Reported - Welsh (%)
Ancestries Reported - West Indian (%)
Ancestries Reported - Other (%)
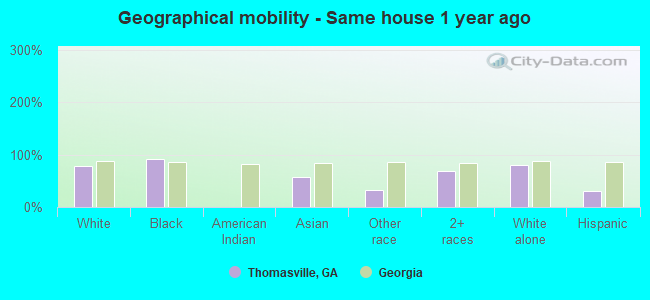
Geographical mobility - Same house 1 year ago (%)
Geographical mobility - Same house 1 year ago (%) - White
Geographical mobility - Same house 1 year ago (%) - Black or African American
Geographical mobility - Same house 1 year ago (%) - Asian
Geographical mobility - Same house 1 year ago (%) - Hispanic or Latino
Geographical mobility - Same house 1 year ago (%) - American Indian and Alaska Native
Geographical mobility - Same house 1 year ago (%) - Multirace
Geographical mobility - Same house 1 year ago (%) - Other Race
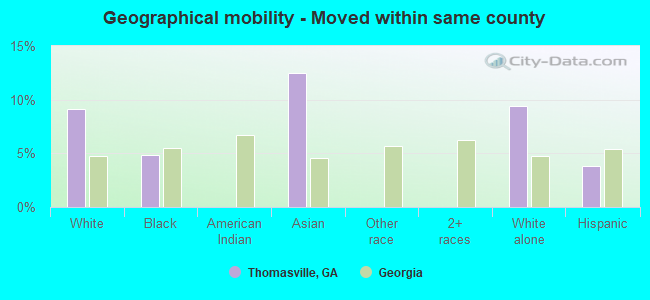
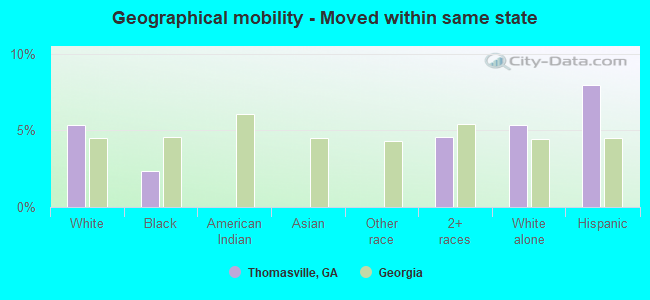
Geographical mobility - Moved within same county (%)
Geographical mobility - Moved within same county (%) - White
Geographical mobility - Moved within same county (%) - Black or African American
Geographical mobility - Moved within same county (%) - Asian
Geographical mobility - Moved within same county (%) - Hispanic or Latino
Geographical mobility - Moved within same county (%) - American Indian and Alaska Native
Geographical mobility - Moved within same county (%) - Multirace
Geographical mobility - Moved within same county (%) - Other Race
Geographical mobility - Moved from different county within same state (%)
Geographical mobility - Moved from different county within same state (%) - White
Geographical mobility - Moved from different county within same state (%) - Black or African American
Geographical mobility - Moved from different county within same state (%) - Asian
Geographical mobility - Moved from different county within same state (%) - Hispanic or Latino
Geographical mobility - Moved from different county within same state (%) - American Indian and Alaska Native
Geographical mobility - Moved from different county within same state (%) - Multirace
Geographical mobility - Moved from different county within same state (%) - Other Race
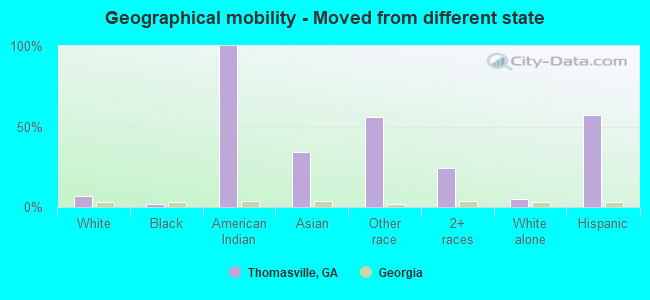
Geographical mobility - Moved from different state (%)
Geographical mobility - Moved from different state (%) - White
Geographical mobility - Moved from different state (%) - Black or African American
Geographical mobility - Moved from different state (%) - Asian
Geographical mobility - Moved from different state (%) - Hispanic or Latino
Geographical mobility - Moved from different state (%) - American Indian and Alaska Native
Geographical mobility - Moved from different state (%) - Multirace
Geographical mobility - Moved from different state (%) - Other Race
Geographical mobility - Moved from abroad (%)
Geographical mobility - Moved from abroad (%) - White
Geographical mobility - Moved from abroad (%) - Black or African American
Geographical mobility - Moved from abroad (%) - Asian
Geographical mobility - Moved from abroad (%) - Hispanic or Latino
Geographical mobility - Moved from abroad (%) - American Indian and Alaska Native
Geographical mobility - Moved from abroad (%) - Multirace
Geographical mobility - Moved from abroad (%) - Other Race
Place of birth for the foreign-born population - Ireland (%)
Place of birth for the foreign-born population - Denmark (%)
Place of birth for the foreign-born population - Norway (%)
Place of birth for the foreign-born population - Sweden (%)
Place of birth for the foreign-born population - United Kingdom (%)
Place of birth for the foreign-born population - England (%)
Place of birth for the foreign-born population - Scotland (%)
Place of birth for the foreign-born population - Other Northern Europe (%)
Place of birth for the foreign-born population - Austria (%)
Place of birth for the foreign-born population - Belgium (%)
Place of birth for the foreign-born population - France (%)
Place of birth for the foreign-born population - Germany (%)
Place of birth for the foreign-born population - Netherlands (%)
Place of birth for the foreign-born population - Switzerland (%)
Place of birth for the foreign-born population - Other Western Europe (%)
Place of birth for the foreign-born population - Greece (%)
Place of birth for the foreign-born population - Italy (%)
Place of birth for the foreign-born population - Portugal (%)
Place of birth for the foreign-born population - Spain (%)
Place of birth for the foreign-born population - Other Southern Europe (%)
Place of birth for the foreign-born population - Albania (%)
Place of birth for the foreign-born population - Belarus (%)
Place of birth for the foreign-born population - Bosnia and Herzegovina (%)
Place of birth for the foreign-born population - Bulgaria (%)
Place of birth for the foreign-born population - Croatia (%)
Place of birth for the foreign-born population - Czechoslovakia (%)
Place of birth for the foreign-born population - Hungary (%)
Place of birth for the foreign-born population - Latvia (%)
Place of birth for the foreign-born population - Lithuania (%)
Place of birth for the foreign-born population - North Macedonia (Macedonia) (%)
Place of birth for the foreign-born population - Moldova (%)
Place of birth for the foreign-born population - Poland (%)
Place of birth for the foreign-born population - Romania (%)
Place of birth for the foreign-born population - Russia (%)
Place of birth for the foreign-born population - Serbia (%)
Place of birth for the foreign-born population - Ukraine (%)
Place of birth for the foreign-born population - Other Eastern Europe (%)
Place of birth for the foreign-born population - China (%)
Place of birth for the foreign-born population - Hong Kong (%)
Place of birth for the foreign-born population - Taiwan (%)
Place of birth for the foreign-born population - Japan (%)
Place of birth for the foreign-born population - Korea (%)
Place of birth for the foreign-born population - Other Eastern Asia (%)
Place of birth for the foreign-born population - Afghanistan (%)
Place of birth for the foreign-born population - Bangladesh (%)
Place of birth for the foreign-born population - India (%)
Place of birth for the foreign-born population - Iran (%)
Place of birth for the foreign-born population - Kazakhstan (%)
Place of birth for the foreign-born population - Nepal (%)
Place of birth for the foreign-born population - Pakistan (%)
Place of birth for the foreign-born population - Sri Lanka (%)
Place of birth for the foreign-born population - Uzbekistan (%)
Place of birth for the foreign-born population - Other South Central Asia (%)
Place of birth for the foreign-born population - Burma (%)
Place of birth for the foreign-born population - Cambodia (%)
Place of birth for the foreign-born population - Indonesia (%)
Place of birth for the foreign-born population - Laos (%)
Place of birth for the foreign-born population - Malaysia (%)
Place of birth for the foreign-born population - Philippines (%)
Place of birth for the foreign-born population - Singapore (%)
Place of birth for the foreign-born population - Thailand (%)
Place of birth for the foreign-born population - Vietnam (%)
Place of birth for the foreign-born population - Other South Eastern Asia (%)
Place of birth for the foreign-born population - Armenia (%)
Place of birth for the foreign-born population - Iraq (%)
Place of birth for the foreign-born population - Israel (%)
Place of birth for the foreign-born population - Jordan (%)
Place of birth for the foreign-born population - Kuwait (%)
Place of birth for the foreign-born population - Lebanon (%)
Place of birth for the foreign-born population - Saudi Arabia (%)
Place of birth for the foreign-born population - Syria (%)
Place of birth for the foreign-born population - Turkey (%)
Place of birth for the foreign-born population - Yemen (%)
Place of birth for the foreign-born population - Other Western Asia (%)
Place of birth for the foreign-born population - Eritrea (%)
Place of birth for the foreign-born population - Ethiopia (%)
Place of birth for the foreign-born population - Kenya (%)
Place of birth for the foreign-born population - Somalia (%)
Place of birth for the foreign-born population - Uganda (%)
Place of birth for the foreign-born population - Zimbabwe (%)
Place of birth for the foreign-born population - Other Eastern Africa (%)
Place of birth for the foreign-born population - Cameroon (%)
Place of birth for the foreign-born population - Congo (%)
Place of birth for the foreign-born population - Democratic Republic of Congo (Zaire) (%)
Place of birth for the foreign-born population - Other Middle Africa (%)
Place of birth for the foreign-born population - Egypt (%)
Place of birth for the foreign-born population - Morocco (%)
Place of birth for the foreign-born population - Sudan (%)
Place of birth for the foreign-born population - Other Northern Africa (%)
Place of birth for the foreign-born population - South Africa (%)
Place of birth for the foreign-born population - Other Southern Africa (%)
Place of birth for the foreign-born population - Cabo Verde (%)
Place of birth for the foreign-born population - Ghana (%)
Place of birth for the foreign-born population - Liberia (%)
Place of birth for the foreign-born population - Nigeria (%)
Place of birth for the foreign-born population - Senegal (%)
Place of birth for the foreign-born population - Sierra Leone (%)
Place of birth for the foreign-born population - Other Western Africa (%)
Place of birth for the foreign-born population - Australia (%)
Place of birth for the foreign-born population - New Zealand (%)
Place of birth for the foreign-born population - Fiji (%)
Place of birth for the foreign-born population - Micronesia (%)
Place of birth for the foreign-born population - Bahamas (%)
Place of birth for the foreign-born population - Barbados (%)
Place of birth for the foreign-born population - Cuba (%)
Place of birth for the foreign-born population - Dominica (%)
Place of birth for the foreign-born population - Dominican Republic (%)
Place of birth for the foreign-born population - Grenada (%)
Place of birth for the foreign-born population - Haiti (%)
Place of birth for the foreign-born population - Jamaica (%)
Place of birth for the foreign-born population - St. Vincent and the Grenadines (%)
Place of birth for the foreign-born population - Trinidad and Tobago (%)
Place of birth for the foreign-born population - West Indies (%)
Place of birth for the foreign-born population - Other Caribbean (%)
Place of birth for the foreign-born population - Belize (%)
Place of birth for the foreign-born population - Costa Rica (%)
Place of birth for the foreign-born population - El Salvador (%)
Place of birth for the foreign-born population - Guatemala (%)
Place of birth for the foreign-born population - Honduras (%)
Place of birth for the foreign-born population - Mexico (%)
Place of birth for the foreign-born population - Nicaragua (%)
Place of birth for the foreign-born population - Panama (%)
Place of birth for the foreign-born population - Other Central America (%)
Place of birth for the foreign-born population - Argentina (%)
Place of birth for the foreign-born population - Bolivia (%)
Place of birth for the foreign-born population - Brazil (%)
Place of birth for the foreign-born population - Chile (%)
Place of birth for the foreign-born population - Colombia (%)
Place of birth for the foreign-born population - Ecuador (%)
Place of birth for the foreign-born population - Guyana (%)
Place of birth for the foreign-born population - Peru (%)
Place of birth for the foreign-born population - Uruguay (%)
Place of birth for the foreign-born population - Venezuela (%)
Place of birth for the foreign-born population - Other South America (%)
Place of birth for the foreign-born population - Canada (%)
Place of birth for the foreign-born population - Other Northern America (%)
Place of birth for the foreign-born population - Other (%)
Latest news about races in Thomasville, GA collected exclusively by city-data.com from local newspapers, TV, and radio stations
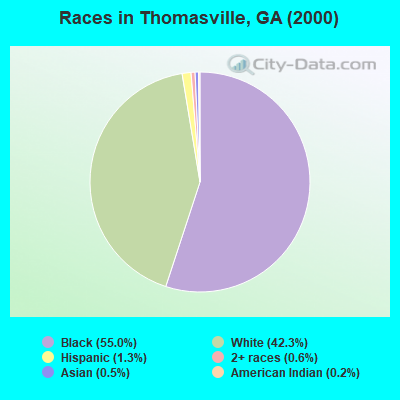
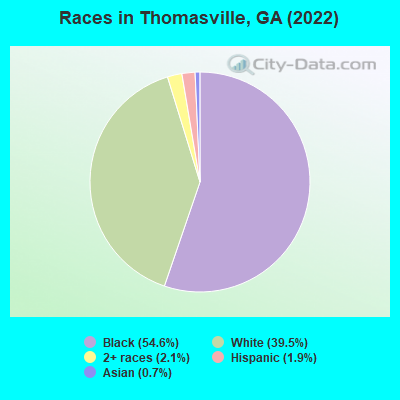
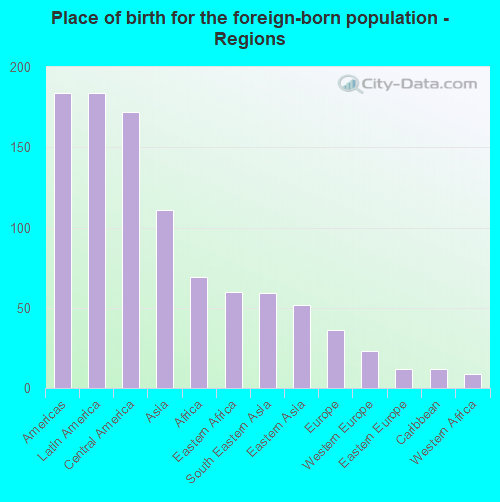
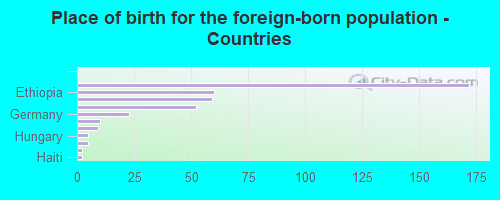
According to 2022 data, the most numerous races in Thomasville, GA are White alone (7,536 residents), Black alone (10,425 residents), and Hispanic (362 residents). 95.5% of Thomasville residents speak English at home. 2.1% of Thomasville, GA residents are foreign-born (0.9% born in Latin America, 0.6% born in Asia, 0.4% born in Africa), which is 374.6% less than the foreign-born rate of 10.0% across the entire state of Georgia.
Race distribution in Thomasville
2000 2022
5,128,661 62.6% White alone 2,331,465 28.5% Black alone 435,227 5.3% Hispanic 171,513 2.1% Asian alone 87,364 1.1% Two or more races 17,670 0.2% American Indian alone 11,275 0.1% Other race alone 3,278 0.04% Native Hawaiian and Other
5,415,657 49.6% White alone 3,349,240 30.7% Black alone 1,132,604 10.4% Hispanic 479,156 4.4% Asian alone 462,923 4.2% Two or more races 54,416 0.5% Other race alone 11,923 0.1% American Indian alone 6,957 0.06% Native Hawaiian and Other
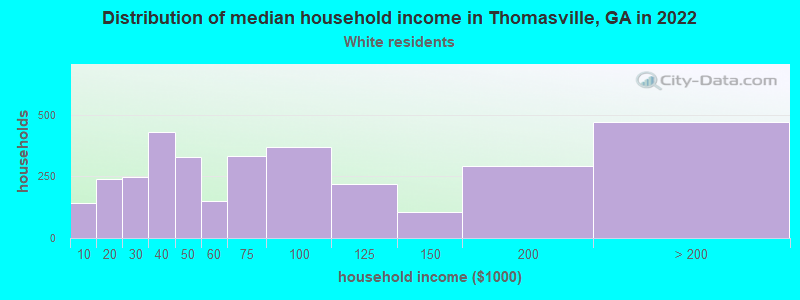
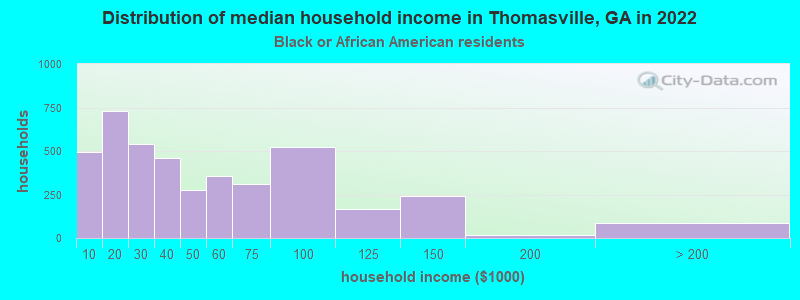
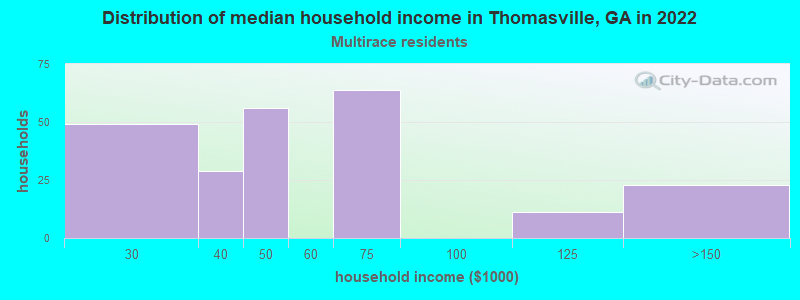
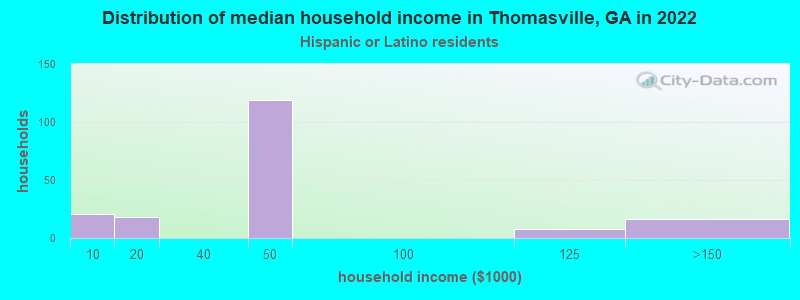
Income and house value in Thomasville Median household income in 2022 $66,430 White non-Hispanic householders$37,247 Black householders$45,918 Two or more races householders$45,790 Hispanic or Latino race householdersMedian 2022 house value $311,609 White Non-Hispanic householders$148,608 Black or African American householders$376,542 American Indian or Alaska Native householders $414,363 Asian householders
Median age by race in Thomasville
47.7 Median age for White residents45.6 50.1 31.6 Median age for Black or African American residents27.6 34.8 -597,462,513.8 Median age for American Indian / Alaska Native residents-597,222,221.6 -597,938,143.7 29.6 Median age for Asian residents-692,810,456.8 50.5 -657,243,815.6 Median age for Native Hawaiian / Pacific Islander residents-693,227,090.9 -776,776,776.0 40.8 Median age for Other race residents-668,918,918.2 -668,981,480.8 33.4 Median age for Two or more races residents42.7 21.7 48.1 Median age for White alone residents45.8 49.8 34.0 Median age for Hispanic or Latino residents26.1 36.0
Owner/renter occupied households by race in Thomasville
House owners and renters - White residents 2,149 64.2% Owner occupied1,196 35.8% Renter occupiedHouse owners and renters - Black or African American residents 1,389 33.0% Owner occupied2,823 67.0% Renter occupiedHouse owners and renters - American Indian / Alaska Native residents 26 100.0% Owner occupiedHouse owners and renters - Asian residents 26 100.0% Owner occupiedHouse owners and renters - Other race residents 4 100.0% Owner occupiedHouse owners and renters - Two or more races residents 141 58.4% Owner occupied101 41.6% Renter occupiedHouse owners and renters - White alone residents 2,183 66.0% Owner occupied1,125 34.0% Renter occupiedHouse owners and renters - Hispanic or Latino residents 8 4.6% Owner occupied160 95.4% Renter occupied
Language usage in Thomasville
English speakers - Total 95.5% of residents of Thomasville speak English at home.
2.1% of residents speak Spanish at home 200 54.6% Speak English very well166 45.4% Speak English less than very well2.2% of residents speak other language at home 302 78.9% Speak English very well81 21.1% Speak English less than very well
English speakers - Born in the United States 97.0% of residents of Thomasville speak English at home.
2.3% of residents speak Spanish at home 98 88.3% Speak English very well13 11.7% Speak English less than very well0.6% of residents speak other language at home 16 50.0% Speak English very well16 50.0% Speak English less than very well
English speakers - Native, born elsewhere 34.5% of residents of Thomasville speak English at home.
76.4% of residents speak other language at home 42 100.0% Speak English very well
English speakers - Foreign-born 29.5% of residents of Thomasville speak English at home.
41.9% of residents speak Spanish at home 14 8.3% Speak English very well155 91.7% Speak English less than very well27.8% of residents speak other language at home 47 42.0% Speak English very well65 58.0% Speak English less than very well
White (Caucasian) - Speak only English Native:
97.7% (6,939)Foreign-born:
14.0% (15)
White (Caucasian) - Speak another language Native:
2.5% (177)Foreign-born:
79.7% (84)
Black or African American - Speak only English Native:
98.6% (9,247)Foreign-born:
14.8% (13)
Black or African American - Speak another language Native:
1.3% (121)Foreign-born:
86.5% (77)
Asian - Speak only English Native:
8.0% (2)Foreign-born:
71.5% (78)
Asian - Speak another language Native:
95.1% (25)Foreign-born:
21.8% (24)
Two or more races - Speak another language Native:
11.6% (53)Foreign-born:
99.4% (41)
White alone - Speak only English Native:
96.7% (6,945)Foreign-born:
51.7% (16)
White alone - Speak another language Native:
3.3% (234)Foreign-born:
48.4% (15)
Hispanic or Latino - Speak another language Native:
24.9% (32)Foreign-born:
99.8% (171)
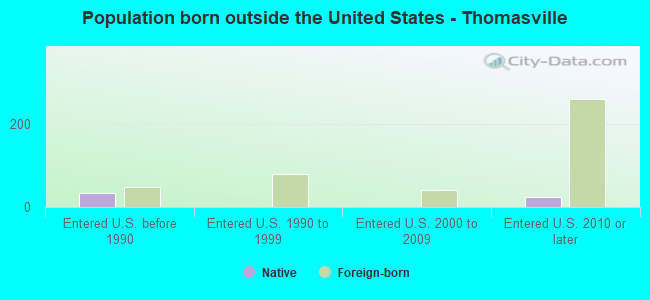
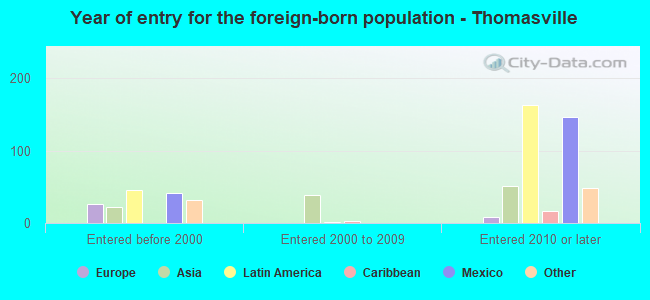
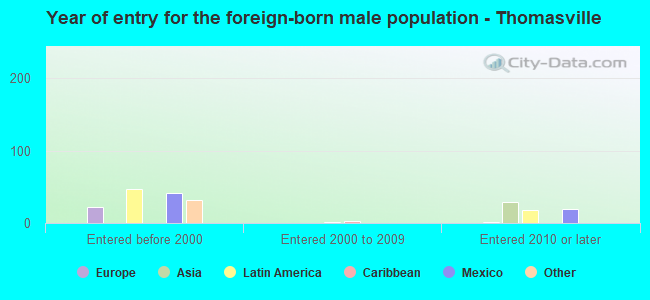
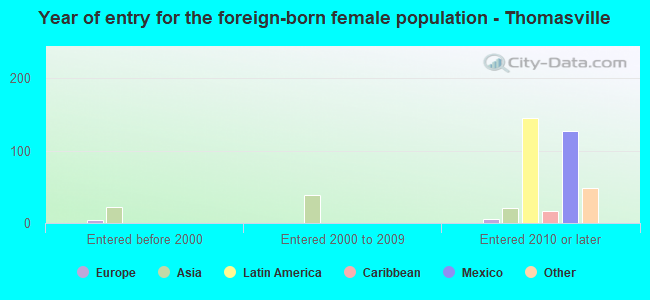
Foreign-born residents in Thomasville 402 residents are foreign born (0.9% Latin America , 0.6% Asia , 0.4% Africa ).
This city:
2.1%Georgia:
10.4%
Marital status for residents in Thomasville Marital status - White (Caucasian) population 15 years and over
Males 31.6% Never married54.1% Now married0.8% Separated4.4% Widowed9.1% DivorcedFemales 22.8% Never married53.2% Now married3.0% Separated8.4% Widowed12.7% DivorcedWomen who gave birth in the past 12 months Now married:
61.2% (70)Unmarried:
38.8% (45)
Women who did not give birth in the past 12 months Now married:
42.0% (622)Unmarried:
58.0% (859)
Marital status - Black or African American population 15 years and over
Males 60.8% Never married27.5% Now married1.9% Separated1.1% Widowed8.6% DivorcedFemales 44.5% Never married18.1% Now married6.1% Separated9.0% Widowed22.3% DivorcedWomen who gave birth in the past 12 months Now married:
25.0% (30)Unmarried:
75.0% (89)
Women who did not give birth in the past 12 months Now married:
19.8% (544)Unmarried:
80.2% (2,204)
Marital status - Other race population 15 years and over
Males 25.0% Never married75.0% Now married0.0% Separated0.0% Widowed0.0% DivorcedFemales 0.0% Never married100.0% Now married0.0% Separated0.0% Widowed0.0% DivorcedWomen who did not give birth in the past 12 months Now married:
100.0% (18)Unmarried:
0.0% (0)
Marital status - Two or more races population 15 years and over
Males 26.1% Never married38.8% Now married0.0% Separated14.9% Widowed20.1% DivorcedFemales 21.0% Never married79.0% Now married0.0% Separated0.0% Widowed0.0% DivorcedWomen who gave birth in the past 12 months Now married:
100.0% (10)Unmarried:
0.0% (0)
Women who did not give birth in the past 12 months Now married:
74.1% (89)Unmarried:
25.9% (31)
Marital status - White alone, not Hispanic / Latino population 15 years and over
Males 30.2% Never married55.5% Now married0.8% Separated4.5% Widowed9.0% DivorcedFemales 20.8% Never married54.5% Now married3.0% Separated8.6% Widowed13.0% DivorcedWomen who gave birth in the past 12 months Now married:
61.2% (73)Unmarried:
38.8% (46)
Women who did not give birth in the past 12 months Now married:
44.4% (646)Unmarried:
55.6% (808)
Marital status - Hispanic or Latino population 15 years and over
Males 77.0% Never married11.5% Now married0.0% Separated0.0% Widowed11.5% DivorcedFemales 67.7% Never married27.6% Now married0.0% Separated0.0% Widowed4.7% DivorcedWomen who gave birth in the past 12 months Now married:
100.0% (8)Unmarried:
0.0% (0)
Women who did not give birth in the past 12 months Now married:
24.6% (30)Unmarried:
75.4% (93)
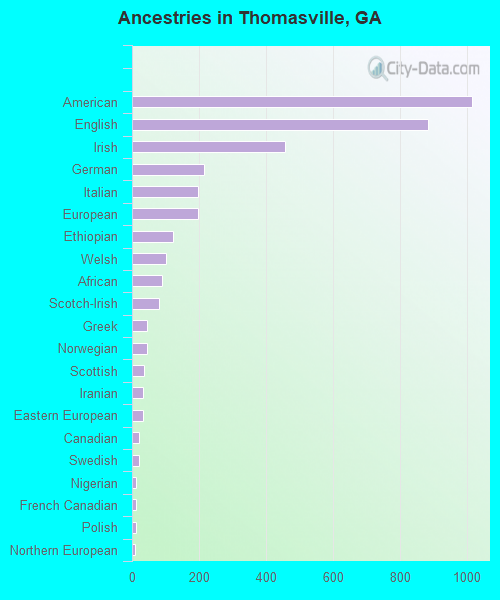
Ancestries in Thomasville
1,015 8.6% American885 7.5% English457 3.9% Irish216 1.8% German197 1.7% Italian196 1.7% European123 1.0% Ethiopian102 0.9% Welsh90 0.8% African80 0.7% Scotch-Irish45 0.4% Greek45 0.4% Norwegian37 0.3% Scottish34 0.3% Iranian32 0.3% Eastern European22 0.2% Canadian21 0.2% Swedish13 0.1% Nigerian12 0.1% French Canadian11 0.09% Polish10 0.09% Northern European9 0.08% British5 0.04% Hungarian3 0.03% Russian3 0.03% Haitian1 0.01% Ukrainian
Children Nativity (place of birth) in Thomasville
Children under 6 years - Living with two parents Both parents native 617 100.0% NativeBoth parents foreign-born 32 100.0% NativeChildren under 6 years - Living with one parent Native parent 854 100.0% NativeForeign-born parent 56 100.0% Native
Children 6 to 17 years - Living with two parents Both parents native 946 97.1% Native28 2.9% Foreign-bornChildren 6 to 17 years - Living with one parent Native parent 1,819 100.0% Native
Grandparents responsible for own grandchildren in Thomasville
Grandparents (30 to 59 years) White / Caucasian 7 100.0% Not responsible for grandchildrenBlack or African American 59 27.2% Responsible for grandchildren157 72.8% Not responsible for grandchildrenWhite alone, not Hispanic / Latino 7 100.0% Not responsible for grandchildrenGrandparents (60 years and over) White / Caucasian 72 100.0% Not responsible for grandchildrenBlack or African American 61 21.7% Responsible for grandchildren221 78.3% Not responsible for grandchildrenWhite alone, not Hispanic / Latino 76 100.0% Not responsible for grandchildren