Races in The Crossings, Florida (FL) Detailed Stats
Data:
Races - White alone (%)
Races - White alone (% change since 2000)
Races - Black alone (%)
Races - Black alone (% change since 2000)
Races - American Indian alone (%)
Races - American Indian alone (% change since 2000)
Races - Asian alone (%)
Races - Asian alone (% change since 2000)
Races - Hispanic (%)
Races - Hispanic (% change since 2000)
Races - Native Hawaiian and Other Pacific Islander alone (%)
Races - Native Hawaiian and Other Pacific Islander alone (% change since 2000)
Races - Two or more races(%)
Races - Two or more races(% change since 2000)
Races - Other race alone (%)
Races - Other race alone (% change since 2000)
Racial diversity
Place of birth - Born in state of residence (%)
Place of birth - Born in state of residence (%) - White
Place of birth - Born in state of residence (%) - Black or African American
Place of birth - Born in state of residence (%) - Asian
Place of birth - Born in state of residence (%) - Hispanic or Latino
Place of birth - Born in state of residence (%) - American Indian and Alaska Native
Place of birth - Born in state of residence (%) - Multirace
Place of birth - Born in state of residence (%) - Other Race
Place of birth - Born in other state (%)
Place of birth - Born in other state (%) - White
Place of birth - Born in other state (%) - Black or African American
Place of birth - Born in other state (%) - Asian
Place of birth - Born in other state (%) - Hispanic or Latino
Place of birth - Born in other state (%) - American Indian and Alaska Native
Place of birth - Born in other state (%) - Multirace
Place of birth - Born in other state (%) - Other Race
Place of birth - Native, outside of US (%)
Place of birth - Native, outside of US (%) - White
Place of birth - Native, outside of US (%) - Black or African American
Place of birth - Native, outside of US (%) - Asian
Place of birth - Native, outside of US (%) - Hispanic or Latino
Place of birth - Native, outside of US (%) - American Indian and Alaska Native
Place of birth - Native, outside of US (%) - Multirace
Place of birth - Native, outside of US (%) - Other Race
Place of birth - Foreign born (%)
Place of birth - Foreign born (%) - White
Place of birth - Foreign born (%) - Black or African American
Place of birth - Foreign born (%) - Asian
Place of birth - Foreign born (%) - Hispanic or Latino
Place of birth - Foreign born (%) - American Indian and Alaska Native
Place of birth - Foreign born (%) - Multirace
Place of birth - Foreign born (%) - Other Race
Residents speaking English at home (%)
Residents speaking English at home - Born in the United States (%)
Residents speaking English at home - Native, born elsewhere (%)
Residents speaking English at home - Foreign born (%)
Residents speaking Spanish at home (%)
Residents speaking Spanish at home - Born in the United States (%)
Residents speaking Spanish at home - Native, born elsewhere (%)
Residents speaking Spanish at home - Foreign born (%)
Residents speaking other language at home (%)
Residents speaking other language at home - Born in the United States (%)
Residents speaking other language at home - Native, born elsewhere (%)
Residents speaking other language at home - Foreign born (%)
Marital status - Never married (%)
Marital status - Now married (%)
Marital status - Separated (%)
Marital status - Widowed (%)
Marital status - Divorced (%)
Ancestries Reported - Arab (%)
Ancestries Reported - Czech (%)
Ancestries Reported - Danish (%)
Ancestries Reported - Dutch (%)
Ancestries Reported - English (%)
Ancestries Reported - French (%)
Ancestries Reported - French Canadian (%)
Ancestries Reported - German (%)
Ancestries Reported - Greek (%)
Ancestries Reported - Hungarian (%)
Ancestries Reported - Irish (%)
Ancestries Reported - Italian (%)
Ancestries Reported - Lithuanian (%)
Ancestries Reported - Norwegian (%)
Ancestries Reported - Polish (%)
Ancestries Reported - Portuguese (%)
Ancestries Reported - Russian (%)
Ancestries Reported - Scotch-Irish (%)
Ancestries Reported - Scottish (%)
Ancestries Reported - Slovak (%)
Ancestries Reported - Subsaharan African (%)
Ancestries Reported - Swedish (%)
Ancestries Reported - Swiss (%)
Ancestries Reported - Ukrainian (%)
Ancestries Reported - United States (%)
Ancestries Reported - Welsh (%)
Ancestries Reported - West Indian (%)
Ancestries Reported - Other (%)
Geographical mobility - Same house 1 year ago (%)
Geographical mobility - Same house 1 year ago (%) - White
Geographical mobility - Same house 1 year ago (%) - Black or African American
Geographical mobility - Same house 1 year ago (%) - Asian
Geographical mobility - Same house 1 year ago (%) - Hispanic or Latino
Geographical mobility - Same house 1 year ago (%) - American Indian and Alaska Native
Geographical mobility - Same house 1 year ago (%) - Multirace
Geographical mobility - Same house 1 year ago (%) - Other Race
Geographical mobility - Moved within same county (%)
Geographical mobility - Moved within same county (%) - White
Geographical mobility - Moved within same county (%) - Black or African American
Geographical mobility - Moved within same county (%) - Asian
Geographical mobility - Moved within same county (%) - Hispanic or Latino
Geographical mobility - Moved within same county (%) - American Indian and Alaska Native
Geographical mobility - Moved within same county (%) - Multirace
Geographical mobility - Moved within same county (%) - Other Race
Geographical mobility - Moved from different county within same state (%)
Geographical mobility - Moved from different county within same state (%) - White
Geographical mobility - Moved from different county within same state (%) - Black or African American
Geographical mobility - Moved from different county within same state (%) - Asian
Geographical mobility - Moved from different county within same state (%) - Hispanic or Latino
Geographical mobility - Moved from different county within same state (%) - American Indian and Alaska Native
Geographical mobility - Moved from different county within same state (%) - Multirace
Geographical mobility - Moved from different county within same state (%) - Other Race
Geographical mobility - Moved from different state (%)
Geographical mobility - Moved from different state (%) - White
Geographical mobility - Moved from different state (%) - Black or African American
Geographical mobility - Moved from different state (%) - Asian
Geographical mobility - Moved from different state (%) - Hispanic or Latino
Geographical mobility - Moved from different state (%) - American Indian and Alaska Native
Geographical mobility - Moved from different state (%) - Multirace
Geographical mobility - Moved from different state (%) - Other Race
Geographical mobility - Moved from abroad (%)
Geographical mobility - Moved from abroad (%) - White
Geographical mobility - Moved from abroad (%) - Black or African American
Geographical mobility - Moved from abroad (%) - Asian
Geographical mobility - Moved from abroad (%) - Hispanic or Latino
Geographical mobility - Moved from abroad (%) - American Indian and Alaska Native
Geographical mobility - Moved from abroad (%) - Multirace
Geographical mobility - Moved from abroad (%) - Other Race
Place of birth for the foreign-born population - Ireland (%)
Place of birth for the foreign-born population - Denmark (%)
Place of birth for the foreign-born population - Norway (%)
Place of birth for the foreign-born population - Sweden (%)
Place of birth for the foreign-born population - United Kingdom (%)
Place of birth for the foreign-born population - England (%)
Place of birth for the foreign-born population - Scotland (%)
Place of birth for the foreign-born population - Other Northern Europe (%)
Place of birth for the foreign-born population - Austria (%)
Place of birth for the foreign-born population - Belgium (%)
Place of birth for the foreign-born population - France (%)
Place of birth for the foreign-born population - Germany (%)
Place of birth for the foreign-born population - Netherlands (%)
Place of birth for the foreign-born population - Switzerland (%)
Place of birth for the foreign-born population - Other Western Europe (%)
Place of birth for the foreign-born population - Greece (%)
Place of birth for the foreign-born population - Italy (%)
Place of birth for the foreign-born population - Portugal (%)
Place of birth for the foreign-born population - Spain (%)
Place of birth for the foreign-born population - Other Southern Europe (%)
Place of birth for the foreign-born population - Albania (%)
Place of birth for the foreign-born population - Belarus (%)
Place of birth for the foreign-born population - Bosnia and Herzegovina (%)
Place of birth for the foreign-born population - Bulgaria (%)
Place of birth for the foreign-born population - Croatia (%)
Place of birth for the foreign-born population - Czechoslovakia (%)
Place of birth for the foreign-born population - Hungary (%)
Place of birth for the foreign-born population - Latvia (%)
Place of birth for the foreign-born population - Lithuania (%)
Place of birth for the foreign-born population - North Macedonia (Macedonia) (%)
Place of birth for the foreign-born population - Moldova (%)
Place of birth for the foreign-born population - Poland (%)
Place of birth for the foreign-born population - Romania (%)
Place of birth for the foreign-born population - Russia (%)
Place of birth for the foreign-born population - Serbia (%)
Place of birth for the foreign-born population - Ukraine (%)
Place of birth for the foreign-born population - Other Eastern Europe (%)
Place of birth for the foreign-born population - China (%)
Place of birth for the foreign-born population - Hong Kong (%)
Place of birth for the foreign-born population - Taiwan (%)
Place of birth for the foreign-born population - Japan (%)
Place of birth for the foreign-born population - Korea (%)
Place of birth for the foreign-born population - Other Eastern Asia (%)
Place of birth for the foreign-born population - Afghanistan (%)
Place of birth for the foreign-born population - Bangladesh (%)
Place of birth for the foreign-born population - India (%)
Place of birth for the foreign-born population - Iran (%)
Place of birth for the foreign-born population - Kazakhstan (%)
Place of birth for the foreign-born population - Nepal (%)
Place of birth for the foreign-born population - Pakistan (%)
Place of birth for the foreign-born population - Sri Lanka (%)
Place of birth for the foreign-born population - Uzbekistan (%)
Place of birth for the foreign-born population - Other South Central Asia (%)
Place of birth for the foreign-born population - Burma (%)
Place of birth for the foreign-born population - Cambodia (%)
Place of birth for the foreign-born population - Indonesia (%)
Place of birth for the foreign-born population - Laos (%)
Place of birth for the foreign-born population - Malaysia (%)
Place of birth for the foreign-born population - Philippines (%)
Place of birth for the foreign-born population - Singapore (%)
Place of birth for the foreign-born population - Thailand (%)
Place of birth for the foreign-born population - Vietnam (%)
Place of birth for the foreign-born population - Other South Eastern Asia (%)
Place of birth for the foreign-born population - Armenia (%)
Place of birth for the foreign-born population - Iraq (%)
Place of birth for the foreign-born population - Israel (%)
Place of birth for the foreign-born population - Jordan (%)
Place of birth for the foreign-born population - Kuwait (%)
Place of birth for the foreign-born population - Lebanon (%)
Place of birth for the foreign-born population - Saudi Arabia (%)
Place of birth for the foreign-born population - Syria (%)
Place of birth for the foreign-born population - Turkey (%)
Place of birth for the foreign-born population - Yemen (%)
Place of birth for the foreign-born population - Other Western Asia (%)
Place of birth for the foreign-born population - Eritrea (%)
Place of birth for the foreign-born population - Ethiopia (%)
Place of birth for the foreign-born population - Kenya (%)
Place of birth for the foreign-born population - Somalia (%)
Place of birth for the foreign-born population - Uganda (%)
Place of birth for the foreign-born population - Zimbabwe (%)
Place of birth for the foreign-born population - Other Eastern Africa (%)
Place of birth for the foreign-born population - Cameroon (%)
Place of birth for the foreign-born population - Congo (%)
Place of birth for the foreign-born population - Democratic Republic of Congo (Zaire) (%)
Place of birth for the foreign-born population - Other Middle Africa (%)
Place of birth for the foreign-born population - Egypt (%)
Place of birth for the foreign-born population - Morocco (%)
Place of birth for the foreign-born population - Sudan (%)
Place of birth for the foreign-born population - Other Northern Africa (%)
Place of birth for the foreign-born population - South Africa (%)
Place of birth for the foreign-born population - Other Southern Africa (%)
Place of birth for the foreign-born population - Cabo Verde (%)
Place of birth for the foreign-born population - Ghana (%)
Place of birth for the foreign-born population - Liberia (%)
Place of birth for the foreign-born population - Nigeria (%)
Place of birth for the foreign-born population - Senegal (%)
Place of birth for the foreign-born population - Sierra Leone (%)
Place of birth for the foreign-born population - Other Western Africa (%)
Place of birth for the foreign-born population - Australia (%)
Place of birth for the foreign-born population - New Zealand (%)
Place of birth for the foreign-born population - Fiji (%)
Place of birth for the foreign-born population - Micronesia (%)
Place of birth for the foreign-born population - Bahamas (%)
Place of birth for the foreign-born population - Barbados (%)
Place of birth for the foreign-born population - Cuba (%)
Place of birth for the foreign-born population - Dominica (%)
Place of birth for the foreign-born population - Dominican Republic (%)
Place of birth for the foreign-born population - Grenada (%)
Place of birth for the foreign-born population - Haiti (%)
Place of birth for the foreign-born population - Jamaica (%)
Place of birth for the foreign-born population - St. Vincent and the Grenadines (%)
Place of birth for the foreign-born population - Trinidad and Tobago (%)
Place of birth for the foreign-born population - West Indies (%)
Place of birth for the foreign-born population - Other Caribbean (%)
Place of birth for the foreign-born population - Belize (%)
Place of birth for the foreign-born population - Costa Rica (%)
Place of birth for the foreign-born population - El Salvador (%)
Place of birth for the foreign-born population - Guatemala (%)
Place of birth for the foreign-born population - Honduras (%)
Place of birth for the foreign-born population - Mexico (%)
Place of birth for the foreign-born population - Nicaragua (%)
Place of birth for the foreign-born population - Panama (%)
Place of birth for the foreign-born population - Other Central America (%)
Place of birth for the foreign-born population - Argentina (%)
Place of birth for the foreign-born population - Bolivia (%)
Place of birth for the foreign-born population - Brazil (%)
Place of birth for the foreign-born population - Chile (%)
Place of birth for the foreign-born population - Colombia (%)
Place of birth for the foreign-born population - Ecuador (%)
Place of birth for the foreign-born population - Guyana (%)
Place of birth for the foreign-born population - Peru (%)
Place of birth for the foreign-born population - Uruguay (%)
Place of birth for the foreign-born population - Venezuela (%)
Place of birth for the foreign-born population - Other South America (%)
Place of birth for the foreign-born population - Canada (%)
Place of birth for the foreign-born population - Other Northern America (%)
Place of birth for the foreign-born population - Other (%)
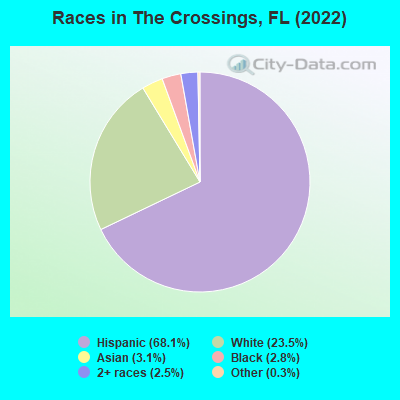
According to 2022 data, the most numerous races in The Crossings, FL are White alone (5,303 residents), Hispanic (15,370 residents), and Black alone (641 residents). 30.6% of The Crossings residents speak English at home. 50.0% of The Crossings, FL residents are foreign-born (47.0% born in Latin America), which is 58.0% greater than the foreign-born rate of 21.0% across the entire state of Florida.
Race distribution in The Crossings
2000 2022
10,458,509 65.4% White alone 2,682,715 16.8% Hispanic 2,264,268 14.2% Black alone 261,693 1.6% Asian alone 236,954 1.5% Two or more races 42,358 0.3% American Indian alone 28,994 0.2% Other race alone 6,887 0.04% Native Hawaiian and Other
11,309,403 50.8% White alone 6,025,039 27.1% Hispanic 3,241,015 14.6% Black alone 861,630 3.9% Two or more races 623,692 2.8% Asian alone 152,054 0.7% Other race alone 22,504 0.1% American Indian alone 9,486 0.04% Native Hawaiian and Other
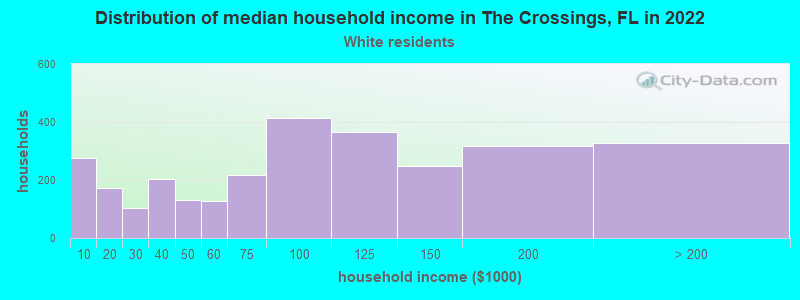
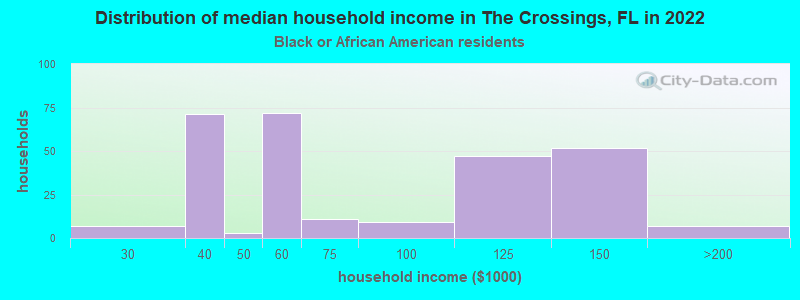
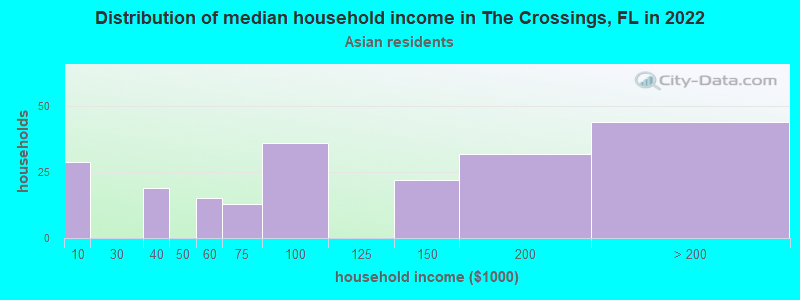
Income and house value in The Crossings Median household income in 2022 $97,058 White non-Hispanic householders$55,133 Black householders$97,609 Some other race householders$83,250 Two or more races householders$83,929 Hispanic or Latino race householdersMedian 2022 house value $480,507 White Non-Hispanic householders$388,897 Black or African American householders$401,016 American Indian or Alaska Native householders $484,428 Asian householders$267,344 Native Hawaiian and other Pacific Islander householders$459,119 Some other race householders$469,100 Two or more races householders$499,399 Hispanic or Latino householders
Median age by race in The Crossings
37.8 Median age for White residents35.5 41.9 45.7 Median age for Black or African American residents45.8 42.6 35.2 Median age for American Indian / Alaska Native residents29.3 -762,696,213.5 60.1 Median age for Asian residents60.2 58.5 -679,849,340.2 Median age for Native Hawaiian / Pacific Islander residents-858,307,848.3 -443,298,968.6 41.2 Median age for Other race residents50.3 21.8 46.8 Median age for Two or more races residents44.6 48.9 33.5 Median age for White alone residents32.6 37.7 46.6 Median age for Hispanic or Latino residents45.5 48.4
Owner/renter occupied households by race in The Crossings
House owners and renters - White residents 2,229 75.2% Owner occupied734 24.8% Renter occupiedHouse owners and renters - Black or African American residents 191 74.1% Owner occupied67 25.9% Renter occupiedHouse owners and renters - American Indian / Alaska Native residents 50 100.0% Owner occupiedHouse owners and renters - Asian residents 199 94.6% Owner occupied11 5.4% Renter occupiedHouse owners and renters - Other race residents 207 52.7% Owner occupied186 47.3% Renter occupiedHouse owners and renters - Two or more races residents 3,164 75.0% Owner occupied1,053 25.0% Renter occupiedHouse owners and renters - White alone residents 1,606 85.5% Owner occupied272 14.5% Renter occupiedHouse owners and renters - Hispanic or Latino residents 4,028 68.7% Owner occupied1,836 31.3% Renter occupied
Language usage in The Crossings
English speakers - Total 30.6% of residents of The Crossings speak English at home.
65.5% of residents speak Spanish at home 9,470 67.2% Speak English very well4,626 32.8% Speak English less than very well3.6% of residents speak other language at home 612 79.4% Speak English very well159 20.6% Speak English less than very well
English speakers - Born in the United States 66.6% of residents of The Crossings speak English at home.
29.8% of residents speak Spanish at home 687 92.2% Speak English very well58 7.8% Speak English less than very well3.4% of residents speak other language at home 66 77.6% Speak English very well19 22.4% Speak English less than very well
English speakers - Native, born elsewhere 4.3% of residents of The Crossings speak English at home.
89.2% of residents speak Spanish at home 387 75.4% Speak English very well126 24.6% Speak English less than very well1.4% of residents speak other language at home 8 100.0% Speak English very well
English speakers - Foreign-born 9.7% of residents of The Crossings speak English at home.
84.6% of residents speak Spanish at home 5,167 54.4% Speak English very well4,329 45.6% Speak English less than very well5.1% of residents speak other language at home 429 75.0% Speak English very well143 25.0% Speak English less than very well
White (Caucasian) - Speak only English Native:
79.3% (4,034)Foreign-born:
10.8% (236)
White (Caucasian) - Speak another language Native:
29.2% (1,485)Foreign-born:
89.6% (1,950)
Black or African American - Speak only English Native:
86.2% (294)Foreign-born:
71.6% (206)
Black or African American - Speak another language Native:
13.8% (47)Foreign-born:
32.9% (94)
American Indian / Alaska Native - Speak another language Native:
100.0% (4)Foreign-born:
98.3% (306)
Asian - Speak only English Native:
87.1% (219)Foreign-born:
36.9% (209)
Asian - Speak another language Native:
14.5% (36)Foreign-born:
59.6% (337)
Other race - Speak only English Native:
21.9% (146)Foreign-born:
14.9% (140)
Other race - Speak another language Native:
78.1% (519)Foreign-born:
84.9% (796)
Two or more races - Speak only English Native:
22.6% (868)Foreign-born:
3.2% (228)
Two or more races - Speak another language Native:
77.3% (2,961)Foreign-born:
96.6% (6,874)
White alone - Speak only English Native:
84.8% (3,678)Foreign-born:
45.9% (244)
White alone - Speak another language Native:
15.8% (683)Foreign-born:
58.9% (313)
Hispanic or Latino - Speak only English Native:
21.6% (1,087)Foreign-born:
3.7% (359)
Hispanic or Latino - Speak another language Native:
78.6% (3,967)Foreign-born:
96.3% (9,469)
Foreign-born residents in The Crossings 11,286 residents are foreign born (47.0% Latin America ).
This city:
50.0%Florida:
21.1%
Marital status for residents in The Crossings Marital status - White (Caucasian) population 15 years and over
Males 34.2% Never married58.0% Now married1.0% Separated0.6% Widowed6.2% DivorcedFemales 29.5% Never married43.9% Now married2.2% Separated9.5% Widowed14.8% DivorcedWomen who gave birth in the past 12 months Now married:
84.7% (63)Unmarried:
15.3% (11)
Women who did not give birth in the past 12 months Now married:
46.4% (651)Unmarried:
53.6% (753)
Marital status - Black or African American population 15 years and over
Males 66.0% Never married30.4% Now married0.0% Separated0.3% Widowed3.3% DivorcedFemales 33.7% Never married32.7% Now married0.0% Separated20.5% Widowed13.2% DivorcedWomen who did not give birth in the past 12 months Now married:
38.2% (46)Unmarried:
61.8% (75)
Marital status - American Indian / Alaska Native population 15 years and over
Males 2.8% Never married43.1% Now married0.0% Separated0.0% Widowed54.1% DivorcedFemales 51.1% Never married48.9% Now married0.0% Separated0.0% Widowed0.0% DivorcedWomen who gave birth in the past 12 months Now married:
0.0% (0)Unmarried:
100.0% (73)
Marital status - Asian population 15 years and over
Males 29.1% Never married70.0% Now married0.0% Separated0.0% Widowed0.9% DivorcedFemales 26.4% Never married41.8% Now married0.0% Separated13.9% Widowed17.9% DivorcedWomen who did not give birth in the past 12 months Now married:
45.0% (51)Unmarried:
55.0% (63)
Marital status - Other race population 15 years and over
Males 35.6% Never married43.9% Now married1.9% Separated2.7% Widowed16.0% DivorcedFemales 39.7% Never married43.9% Now married0.0% Separated1.2% Widowed15.2% DivorcedWomen who gave birth in the past 12 months Now married:
0.0% (0)Unmarried:
100.0% (18)
Women who did not give birth in the past 12 months Now married:
38.3% (153)Unmarried:
61.7% (247)
Marital status - Two or more races population 15 years and over
Males 28.9% Never married63.9% Now married0.0% Separated2.9% Widowed4.3% DivorcedFemales 25.3% Never married54.6% Now married2.2% Separated9.0% Widowed8.9% DivorcedWomen who gave birth in the past 12 months Now married:
72.5% (92)Unmarried:
27.5% (35)
Women who did not give birth in the past 12 months Now married:
54.1% (1,334)Unmarried:
45.9% (1,132)
Marital status - White alone, not Hispanic / Latino population 15 years and over
Males 42.5% Never married51.1% Now married1.1% Separated0.0% Widowed5.3% DivorcedFemales 33.4% Never married46.0% Now married1.4% Separated6.1% Widowed13.2% DivorcedWomen who gave birth in the past 12 months Now married:
100.0% (76)Unmarried:
0.0% (0)
Women who did not give birth in the past 12 months Now married:
37.1% (360)Unmarried:
62.9% (609)
Marital status - Hispanic or Latino population 15 years and over
Males 27.2% Never married62.6% Now married0.6% Separated2.0% Widowed7.6% DivorcedFemales 27.1% Never married48.6% Now married2.3% Separated9.7% Widowed12.4% DivorcedWomen who gave birth in the past 12 months Now married:
48.2% (92)Unmarried:
51.8% (99)
Women who did not give birth in the past 12 months Now married:
52.4% (1,674)Unmarried:
47.6% (1,521)
Ancestries in The Crossings
1,977 12.1% American253 1.5% Italian188 1.1% Jamaican141 0.9% Haitian140 0.9% Polish125 0.8% English107 0.7% French106 0.6% Eastern European100 0.6% European95 0.6% Irish72 0.4% Swiss59 0.4% British53 0.3% German38 0.2% Iranian38 0.2% Hungarian34 0.2% Russian28 0.2% Lebanese28 0.2% Armenian28 0.2% Ukrainian26 0.2% Moroccan26 0.2% Trinidadian and Tobagonian22 0.1% Scottish19 0.1% Israeli19 0.1% Norwegian17 0.1% Swedish16 0.10% Estonian14 0.09% Northern European13 0.08% Brazilian13 0.08% Greek10 0.06% South African9 0.06% Portuguese8 0.05% Romanian5 0.03% Austrian
Children Nativity (place of birth) in The Crossings
Children under 6 years - Living with two parents Both parents native 632 100.0% NativeBoth parents foreign-born 75 67.1% Native37 32.9% Foreign-bornOne native, one foreign-born parent 263 100.0% NativeChildren under 6 years - Living with one parent Native parent 140 100.0% NativeForeign-born parent 49 100.0% NativeChildren 6 to 17 years - Living with two parents Both parents native 976 100.0% NativeBoth parents foreign-born 761 75.7% Native244 24.3% Foreign-bornOne native, one foreign-born parent 369 86.9% Native56 13.1% Foreign-bornChildren 6 to 17 years - Living with one parent Native parent 273 100.0% NativeForeign-born parent 307 53.3% Native269 46.7% Foreign-born
Grandparents responsible for own grandchildren in The Crossings
Grandparents (30 to 59 years) American Indian / Alaska Native 48 100.0% Responsible for grandchildrenOther race 40 52.8% Responsible for grandchildren36 47.2% Not responsible for grandchildrenTwo or more races 36 100.0% Not responsible for grandchildrenHispanic or Latino 78 63.6% Responsible for grandchildren45 36.4% Not responsible for grandchildrenGrandparents (60 years and over) Two or more races 172 100.0% Not responsible for grandchildrenHispanic or Latino 12 4.8% Responsible for grandchildren237 95.2% Not responsible for grandchildren