Races in Swissvale, Pennsylvania (PA) Detailed Stats
Data:
Races - White alone (%)
Races - White alone (% change since 2000)
Races - Black alone (%)
Races - Black alone (% change since 2000)
Races - American Indian alone (%)
Races - American Indian alone (% change since 2000)
Races - Asian alone (%)
Races - Asian alone (% change since 2000)
Races - Hispanic (%)
Races - Hispanic (% change since 2000)
Races - Native Hawaiian and Other Pacific Islander alone (%)
Races - Native Hawaiian and Other Pacific Islander alone (% change since 2000)
Races - Two or more races(%)
Races - Two or more races(% change since 2000)
Races - Other race alone (%)
Races - Other race alone (% change since 2000)
Racial diversity
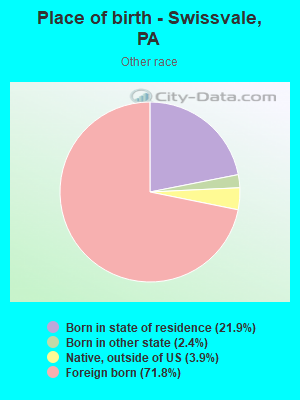
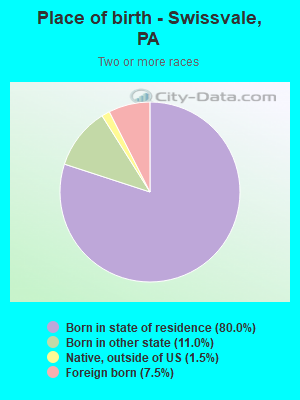
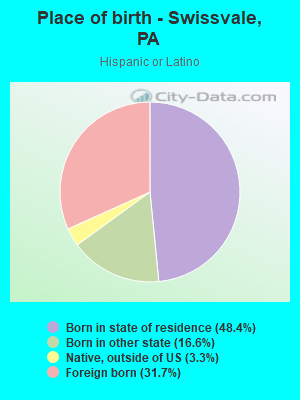
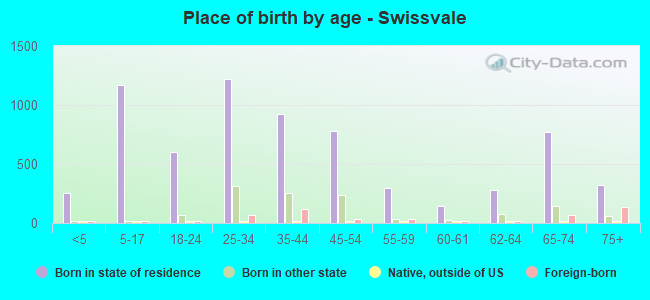
Place of birth - Born in state of residence (%)
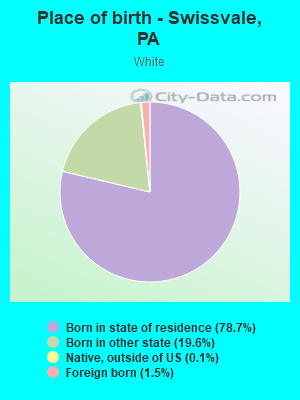
Place of birth - Born in state of residence (%) - White
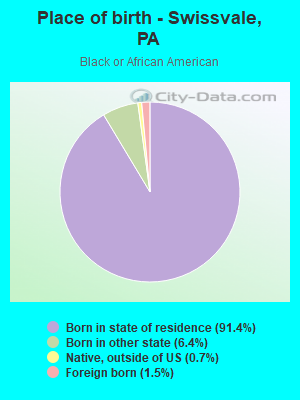
Place of birth - Born in state of residence (%) - Black or African American
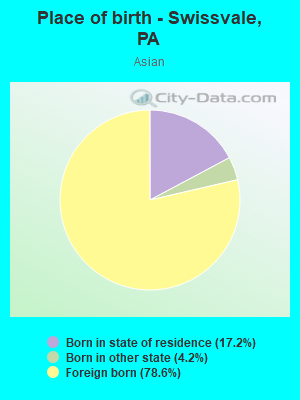
Place of birth - Born in state of residence (%) - Asian
Place of birth - Born in state of residence (%) - Hispanic or Latino
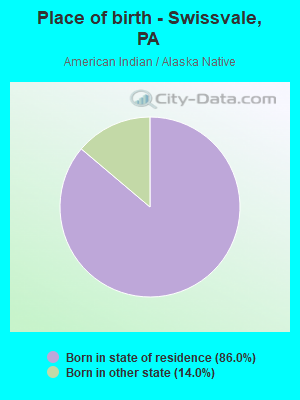
Place of birth - Born in state of residence (%) - American Indian and Alaska Native
Place of birth - Born in state of residence (%) - Multirace
Place of birth - Born in state of residence (%) - Other Race
Place of birth - Born in other state (%)
Place of birth - Born in other state (%) - White
Place of birth - Born in other state (%) - Black or African American
Place of birth - Born in other state (%) - Asian
Place of birth - Born in other state (%) - Hispanic or Latino
Place of birth - Born in other state (%) - American Indian and Alaska Native
Place of birth - Born in other state (%) - Multirace
Place of birth - Born in other state (%) - Other Race
Place of birth - Native, outside of US (%)
Place of birth - Native, outside of US (%) - White
Place of birth - Native, outside of US (%) - Black or African American
Place of birth - Native, outside of US (%) - Asian
Place of birth - Native, outside of US (%) - Hispanic or Latino
Place of birth - Native, outside of US (%) - American Indian and Alaska Native
Place of birth - Native, outside of US (%) - Multirace
Place of birth - Native, outside of US (%) - Other Race
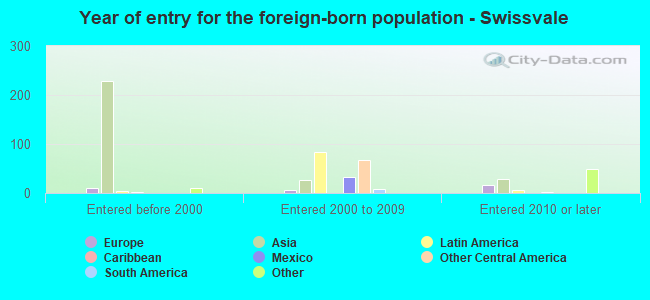
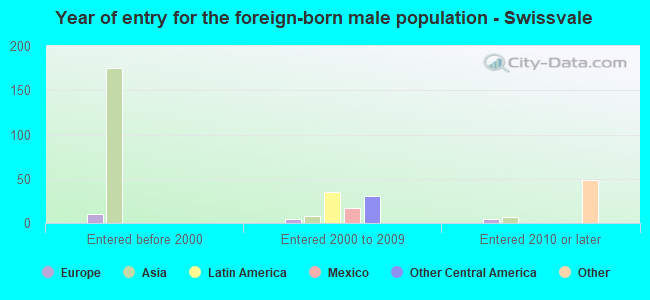
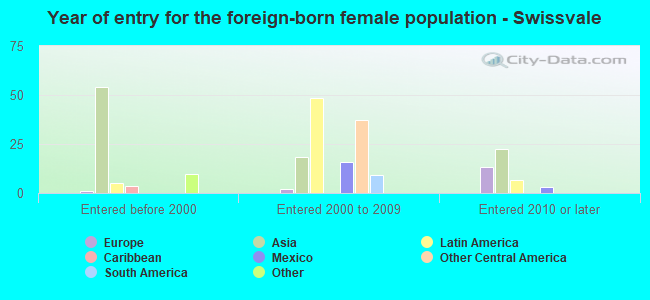
Place of birth - Foreign born (%)
Place of birth - Foreign born (%) - White
Place of birth - Foreign born (%) - Black or African American
Place of birth - Foreign born (%) - Asian
Place of birth - Foreign born (%) - Hispanic or Latino
Place of birth - Foreign born (%) - American Indian and Alaska Native
Place of birth - Foreign born (%) - Multirace
Place of birth - Foreign born (%) - Other Race
Residents speaking English at home (%)
Residents speaking English at home - Born in the United States (%)
Residents speaking English at home - Native, born elsewhere (%)
Residents speaking English at home - Foreign born (%)
Residents speaking Spanish at home (%)
Residents speaking Spanish at home - Born in the United States (%)
Residents speaking Spanish at home - Native, born elsewhere (%)
Residents speaking Spanish at home - Foreign born (%)
Residents speaking other language at home (%)
Residents speaking other language at home - Born in the United States (%)
Residents speaking other language at home - Native, born elsewhere (%)
Residents speaking other language at home - Foreign born (%)
Marital status - Never married (%)
Marital status - Now married (%)
Marital status - Separated (%)
Marital status - Widowed (%)
Marital status - Divorced (%)
Ancestries Reported - Arab (%)
Ancestries Reported - Czech (%)
Ancestries Reported - Danish (%)
Ancestries Reported - Dutch (%)
Ancestries Reported - English (%)
Ancestries Reported - French (%)
Ancestries Reported - French Canadian (%)
Ancestries Reported - German (%)
Ancestries Reported - Greek (%)
Ancestries Reported - Hungarian (%)
Ancestries Reported - Irish (%)
Ancestries Reported - Italian (%)
Ancestries Reported - Lithuanian (%)
Ancestries Reported - Norwegian (%)
Ancestries Reported - Polish (%)
Ancestries Reported - Portuguese (%)
Ancestries Reported - Russian (%)
Ancestries Reported - Scotch-Irish (%)
Ancestries Reported - Scottish (%)
Ancestries Reported - Slovak (%)
Ancestries Reported - Subsaharan African (%)
Ancestries Reported - Swedish (%)
Ancestries Reported - Swiss (%)
Ancestries Reported - Ukrainian (%)
Ancestries Reported - United States (%)
Ancestries Reported - Welsh (%)
Ancestries Reported - West Indian (%)
Ancestries Reported - Other (%)
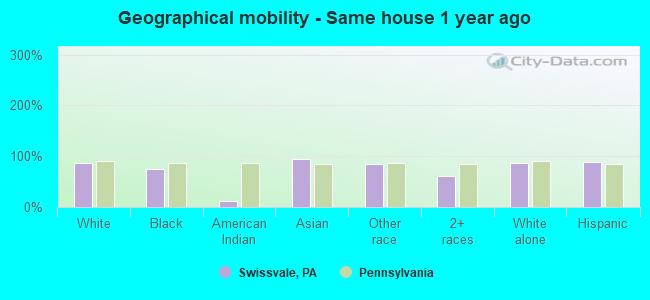
Geographical mobility - Same house 1 year ago (%)
Geographical mobility - Same house 1 year ago (%) - White
Geographical mobility - Same house 1 year ago (%) - Black or African American
Geographical mobility - Same house 1 year ago (%) - Asian
Geographical mobility - Same house 1 year ago (%) - Hispanic or Latino
Geographical mobility - Same house 1 year ago (%) - American Indian and Alaska Native
Geographical mobility - Same house 1 year ago (%) - Multirace
Geographical mobility - Same house 1 year ago (%) - Other Race
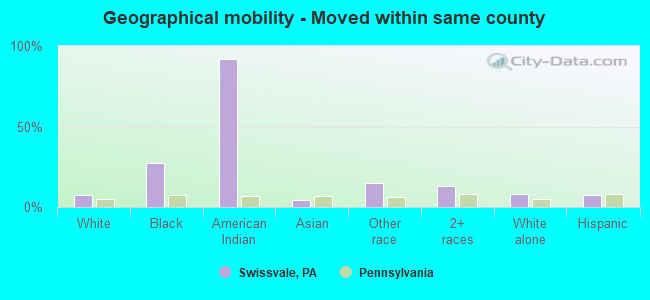
Geographical mobility - Moved within same county (%)
Geographical mobility - Moved within same county (%) - White
Geographical mobility - Moved within same county (%) - Black or African American
Geographical mobility - Moved within same county (%) - Asian
Geographical mobility - Moved within same county (%) - Hispanic or Latino
Geographical mobility - Moved within same county (%) - American Indian and Alaska Native
Geographical mobility - Moved within same county (%) - Multirace
Geographical mobility - Moved within same county (%) - Other Race
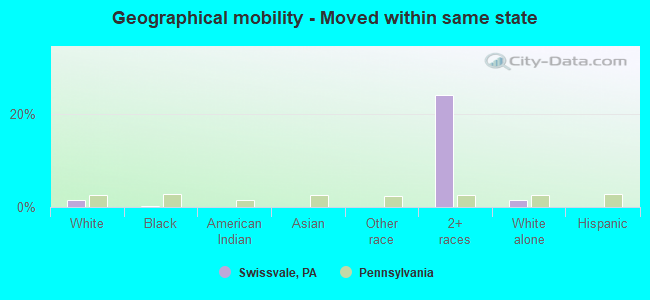
Geographical mobility - Moved from different county within same state (%)
Geographical mobility - Moved from different county within same state (%) - White
Geographical mobility - Moved from different county within same state (%) - Black or African American
Geographical mobility - Moved from different county within same state (%) - Asian
Geographical mobility - Moved from different county within same state (%) - Hispanic or Latino
Geographical mobility - Moved from different county within same state (%) - American Indian and Alaska Native
Geographical mobility - Moved from different county within same state (%) - Multirace
Geographical mobility - Moved from different county within same state (%) - Other Race
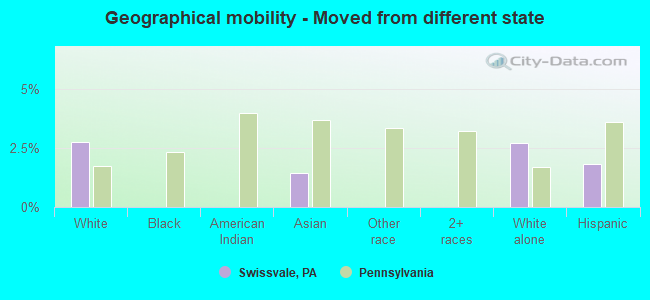
Geographical mobility - Moved from different state (%)
Geographical mobility - Moved from different state (%) - White
Geographical mobility - Moved from different state (%) - Black or African American
Geographical mobility - Moved from different state (%) - Asian
Geographical mobility - Moved from different state (%) - Hispanic or Latino
Geographical mobility - Moved from different state (%) - American Indian and Alaska Native
Geographical mobility - Moved from different state (%) - Multirace
Geographical mobility - Moved from different state (%) - Other Race
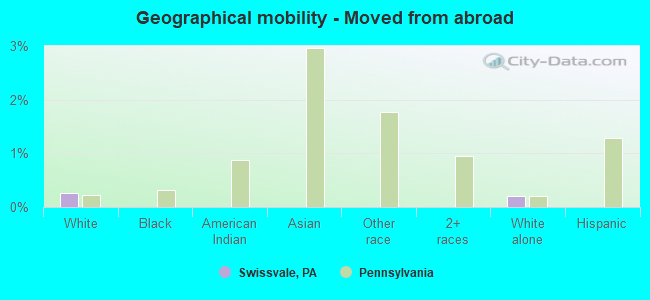
Geographical mobility - Moved from abroad (%)
Geographical mobility - Moved from abroad (%) - White
Geographical mobility - Moved from abroad (%) - Black or African American
Geographical mobility - Moved from abroad (%) - Asian
Geographical mobility - Moved from abroad (%) - Hispanic or Latino
Geographical mobility - Moved from abroad (%) - American Indian and Alaska Native
Geographical mobility - Moved from abroad (%) - Multirace
Geographical mobility - Moved from abroad (%) - Other Race
Place of birth for the foreign-born population - Ireland (%)
Place of birth for the foreign-born population - Denmark (%)
Place of birth for the foreign-born population - Norway (%)
Place of birth for the foreign-born population - Sweden (%)
Place of birth for the foreign-born population - United Kingdom (%)
Place of birth for the foreign-born population - England (%)
Place of birth for the foreign-born population - Scotland (%)
Place of birth for the foreign-born population - Other Northern Europe (%)
Place of birth for the foreign-born population - Austria (%)
Place of birth for the foreign-born population - Belgium (%)
Place of birth for the foreign-born population - France (%)
Place of birth for the foreign-born population - Germany (%)
Place of birth for the foreign-born population - Netherlands (%)
Place of birth for the foreign-born population - Switzerland (%)
Place of birth for the foreign-born population - Other Western Europe (%)
Place of birth for the foreign-born population - Greece (%)
Place of birth for the foreign-born population - Italy (%)
Place of birth for the foreign-born population - Portugal (%)
Place of birth for the foreign-born population - Spain (%)
Place of birth for the foreign-born population - Other Southern Europe (%)
Place of birth for the foreign-born population - Albania (%)
Place of birth for the foreign-born population - Belarus (%)
Place of birth for the foreign-born population - Bosnia and Herzegovina (%)
Place of birth for the foreign-born population - Bulgaria (%)
Place of birth for the foreign-born population - Croatia (%)
Place of birth for the foreign-born population - Czechoslovakia (%)
Place of birth for the foreign-born population - Hungary (%)
Place of birth for the foreign-born population - Latvia (%)
Place of birth for the foreign-born population - Lithuania (%)
Place of birth for the foreign-born population - North Macedonia (Macedonia) (%)
Place of birth for the foreign-born population - Moldova (%)
Place of birth for the foreign-born population - Poland (%)
Place of birth for the foreign-born population - Romania (%)
Place of birth for the foreign-born population - Russia (%)
Place of birth for the foreign-born population - Serbia (%)
Place of birth for the foreign-born population - Ukraine (%)
Place of birth for the foreign-born population - Other Eastern Europe (%)
Place of birth for the foreign-born population - China (%)
Place of birth for the foreign-born population - Hong Kong (%)
Place of birth for the foreign-born population - Taiwan (%)
Place of birth for the foreign-born population - Japan (%)
Place of birth for the foreign-born population - Korea (%)
Place of birth for the foreign-born population - Other Eastern Asia (%)
Place of birth for the foreign-born population - Afghanistan (%)
Place of birth for the foreign-born population - Bangladesh (%)
Place of birth for the foreign-born population - India (%)
Place of birth for the foreign-born population - Iran (%)
Place of birth for the foreign-born population - Kazakhstan (%)
Place of birth for the foreign-born population - Nepal (%)
Place of birth for the foreign-born population - Pakistan (%)
Place of birth for the foreign-born population - Sri Lanka (%)
Place of birth for the foreign-born population - Uzbekistan (%)
Place of birth for the foreign-born population - Other South Central Asia (%)
Place of birth for the foreign-born population - Burma (%)
Place of birth for the foreign-born population - Cambodia (%)
Place of birth for the foreign-born population - Indonesia (%)
Place of birth for the foreign-born population - Laos (%)
Place of birth for the foreign-born population - Malaysia (%)
Place of birth for the foreign-born population - Philippines (%)
Place of birth for the foreign-born population - Singapore (%)
Place of birth for the foreign-born population - Thailand (%)
Place of birth for the foreign-born population - Vietnam (%)
Place of birth for the foreign-born population - Other South Eastern Asia (%)
Place of birth for the foreign-born population - Armenia (%)
Place of birth for the foreign-born population - Iraq (%)
Place of birth for the foreign-born population - Israel (%)
Place of birth for the foreign-born population - Jordan (%)
Place of birth for the foreign-born population - Kuwait (%)
Place of birth for the foreign-born population - Lebanon (%)
Place of birth for the foreign-born population - Saudi Arabia (%)
Place of birth for the foreign-born population - Syria (%)
Place of birth for the foreign-born population - Turkey (%)
Place of birth for the foreign-born population - Yemen (%)
Place of birth for the foreign-born population - Other Western Asia (%)
Place of birth for the foreign-born population - Eritrea (%)
Place of birth for the foreign-born population - Ethiopia (%)
Place of birth for the foreign-born population - Kenya (%)
Place of birth for the foreign-born population - Somalia (%)
Place of birth for the foreign-born population - Uganda (%)
Place of birth for the foreign-born population - Zimbabwe (%)
Place of birth for the foreign-born population - Other Eastern Africa (%)
Place of birth for the foreign-born population - Cameroon (%)
Place of birth for the foreign-born population - Congo (%)
Place of birth for the foreign-born population - Democratic Republic of Congo (Zaire) (%)
Place of birth for the foreign-born population - Other Middle Africa (%)
Place of birth for the foreign-born population - Egypt (%)
Place of birth for the foreign-born population - Morocco (%)
Place of birth for the foreign-born population - Sudan (%)
Place of birth for the foreign-born population - Other Northern Africa (%)
Place of birth for the foreign-born population - South Africa (%)
Place of birth for the foreign-born population - Other Southern Africa (%)
Place of birth for the foreign-born population - Cabo Verde (%)
Place of birth for the foreign-born population - Ghana (%)
Place of birth for the foreign-born population - Liberia (%)
Place of birth for the foreign-born population - Nigeria (%)
Place of birth for the foreign-born population - Senegal (%)
Place of birth for the foreign-born population - Sierra Leone (%)
Place of birth for the foreign-born population - Other Western Africa (%)
Place of birth for the foreign-born population - Australia (%)
Place of birth for the foreign-born population - New Zealand (%)
Place of birth for the foreign-born population - Fiji (%)
Place of birth for the foreign-born population - Micronesia (%)
Place of birth for the foreign-born population - Bahamas (%)
Place of birth for the foreign-born population - Barbados (%)
Place of birth for the foreign-born population - Cuba (%)
Place of birth for the foreign-born population - Dominica (%)
Place of birth for the foreign-born population - Dominican Republic (%)
Place of birth for the foreign-born population - Grenada (%)
Place of birth for the foreign-born population - Haiti (%)
Place of birth for the foreign-born population - Jamaica (%)
Place of birth for the foreign-born population - St. Vincent and the Grenadines (%)
Place of birth for the foreign-born population - Trinidad and Tobago (%)
Place of birth for the foreign-born population - West Indies (%)
Place of birth for the foreign-born population - Other Caribbean (%)
Place of birth for the foreign-born population - Belize (%)
Place of birth for the foreign-born population - Costa Rica (%)
Place of birth for the foreign-born population - El Salvador (%)
Place of birth for the foreign-born population - Guatemala (%)
Place of birth for the foreign-born population - Honduras (%)
Place of birth for the foreign-born population - Mexico (%)
Place of birth for the foreign-born population - Nicaragua (%)
Place of birth for the foreign-born population - Panama (%)
Place of birth for the foreign-born population - Other Central America (%)
Place of birth for the foreign-born population - Argentina (%)
Place of birth for the foreign-born population - Bolivia (%)
Place of birth for the foreign-born population - Brazil (%)
Place of birth for the foreign-born population - Chile (%)
Place of birth for the foreign-born population - Colombia (%)
Place of birth for the foreign-born population - Ecuador (%)
Place of birth for the foreign-born population - Guyana (%)
Place of birth for the foreign-born population - Peru (%)
Place of birth for the foreign-born population - Uruguay (%)
Place of birth for the foreign-born population - Venezuela (%)
Place of birth for the foreign-born population - Other South America (%)
Place of birth for the foreign-born population - Canada (%)
Place of birth for the foreign-born population - Other Northern America (%)
Place of birth for the foreign-born population - Other (%)
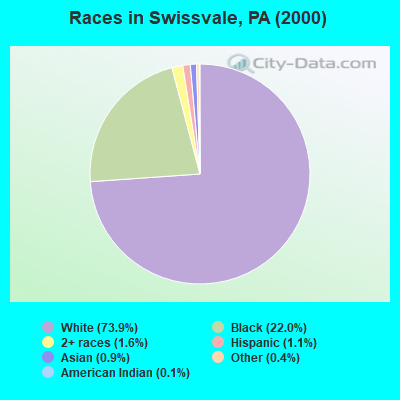
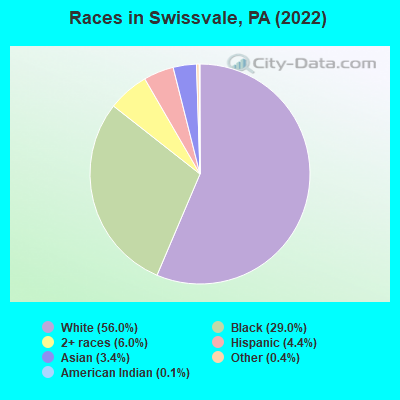
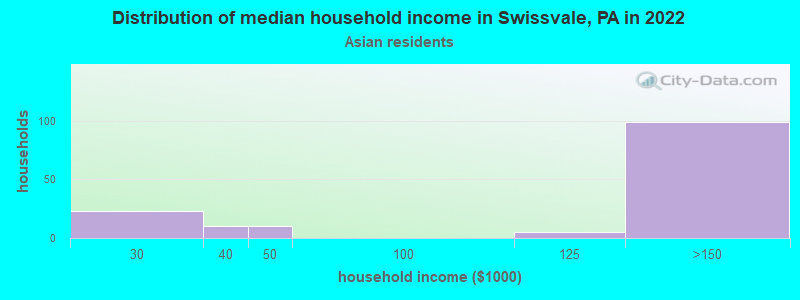
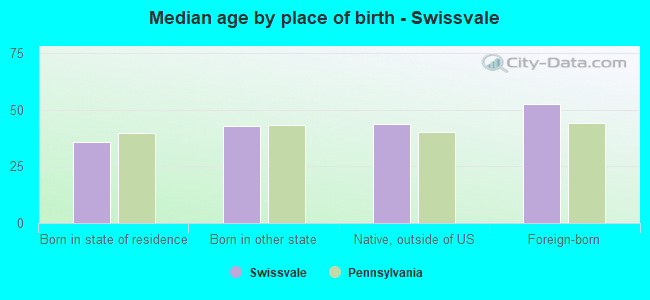
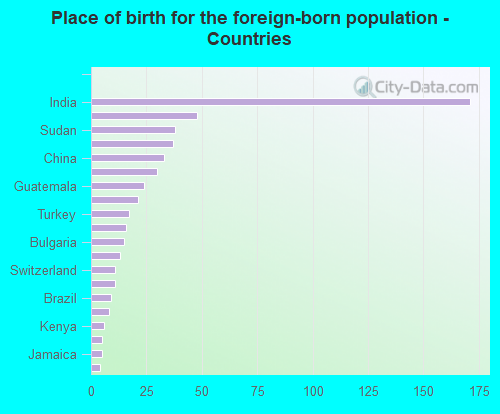
According to 2022 data, the most numerous races in Swissvale, PA are White alone (4,759 residents), Black alone (2,462 residents), and Hispanic (376 residents). 93.9% of Swissvale residents speak English at home. 6.3% of Swissvale, PA residents are foreign-born (3.5% born in Asia, 1.3% born in Latin America), which is 11.9% less than the foreign-born rate of 7.0% across the entire state of Pennsylvania.
Race distribution in Swissvale
2000 2022
10,322,455 84.1% White alone 1,202,437 9.8% Black alone 394,088 3.2% Hispanic 218,296 1.8% Asian alone 113,097 0.9% Two or more races 13,086 0.1% Other race alone 14,904 0.1% American Indian alone 2,691 0.02% Native Hawaiian and Other
9,487,228 73.1% White alone 1,311,581 10.1% Black alone 1,115,997 8.6% Hispanic 493,942 3.8% Two or more races 487,124 3.8% Asian alone 63,582 0.5% Other race alone 10,130 0.08% American Indian alone 2,424 0.02% Native Hawaiian and Other
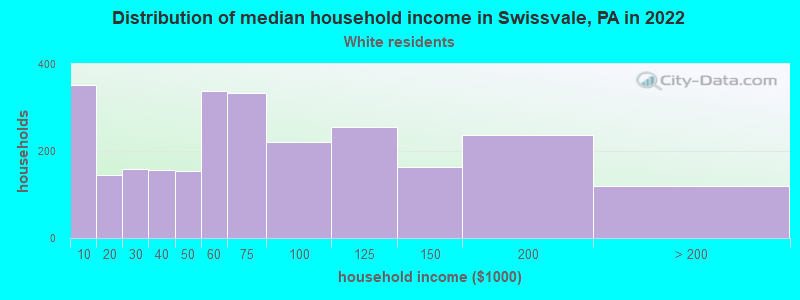
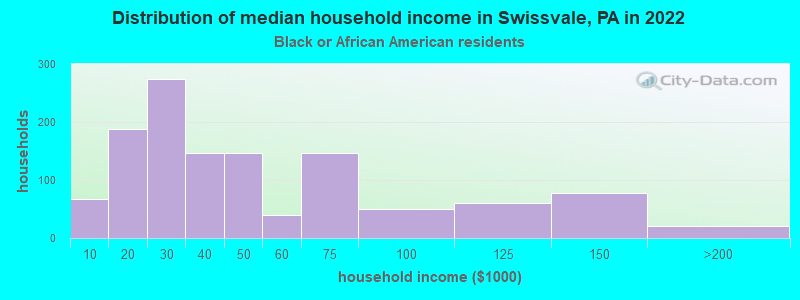
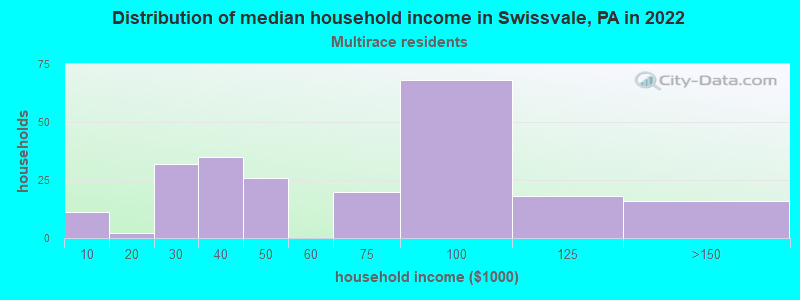
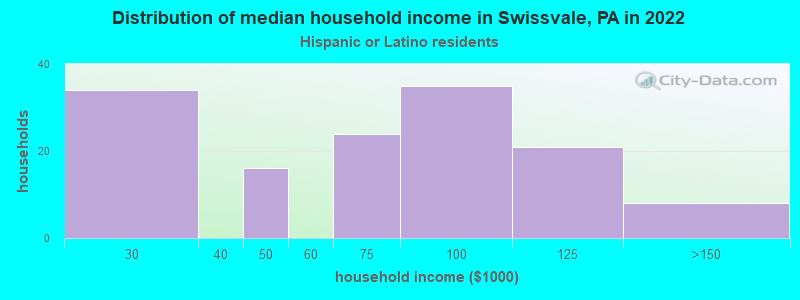
Income and house value in Swissvale Median household income in 2022 $59,388 White non-Hispanic householders$33,764 Black householders$149,854 Asian householders$105,490 Some other race householders$73,770 Two or more races householders$76,928 Hispanic or Latino race householdersMedian 2022 house value $153,911 White Non-Hispanic householders$120,769 Black or African American householders$315,967 Some other race householders$237,888 Two or more races householders$175,537 Hispanic or Latino householders
Median age by race in Swissvale
40.7 Median age for White residents38.3 46.5 33.9 Median age for Black or African American residents26.6 38.6 -642,857,142.2 Median age for American Indian / Alaska Native residents-714,583,332.6 -577,519,379.3 73.2 Median age for Asian residents79.2 74.0 -656,534,953.8 Median age for Native Hawaiian / Pacific Islander residents-919,148,935.3 -747,474,746.7 40.1 Median age for Other race residents39.9 21.3 16.5 Median age for Two or more races residents16.3 22.6 40.9 Median age for White alone residents38.4 47.1 35.3 Median age for Hispanic or Latino residents38.5 32.5
Owner/renter occupied households by race in Swissvale
House owners and renters - White residents 1,586 60.2% Owner occupied1,047 39.8% Renter occupiedHouse owners and renters - Black or African American residents 283 23.5% Owner occupied922 76.5% Renter occupiedHouse owners and renters - Asian residents 162 86.7% Owner occupied25 13.3% Renter occupiedHouse owners and renters - Other race residents 19 41.3% Owner occupied26 58.7% Renter occupiedHouse owners and renters - Two or more races residents 66 28.6% Owner occupied166 71.4% Renter occupiedHouse owners and renters - White alone residents 1,565 60.4% Owner occupied1,026 39.6% Renter occupiedHouse owners and renters - Hispanic or Latino residents 43 29.9% Owner occupied101 70.1% Renter occupied
Language usage in Swissvale
English speakers - Total 93.9% of residents of Swissvale speak English at home.
1.9% of residents speak Spanish at home 90 58.1% Speak English very well65 41.9% Speak English less than very well4.0% of residents speak other language at home 239 71.8% Speak English very well94 28.2% Speak English less than very well
English speakers - Born in the United States 93.3% of residents of Swissvale speak English at home.
3.2% of residents speak Spanish at home 39 100.0% Speak English very well2.1% of residents speak other language at home 24 96.0% Speak English very well1 4.0% Speak English less than very well
English speakers - Native, born elsewhere 67.9% of residents of Swissvale speak English at home.
25.0% of residents speak Spanish at home 7 100.0% Speak English very well
English speakers - Foreign-born 49.4% of residents of Swissvale speak English at home.
18.6% of residents speak Spanish at home 36 40.9% Speak English very well52 59.1% Speak English less than very well32.5% of residents speak other language at home 86 55.8% Speak English very well68 44.2% Speak English less than very well
White (Caucasian) - Speak only English Native:
96.1% (4,456)Foreign-born:
18.9% (14)
White (Caucasian) - Speak another language Native:
3.9% (182)Foreign-born:
79.8% (59)
Black or African American - Speak only English Native:
99.4% (2,345)Foreign-born:
100.0% (37)
Asian - Speak only English Native:
40.6% (18)Foreign-born:
68.7% (160)
Asian - Speak another language Native:
52.4% (23)Foreign-born:
30.3% (70)
Other race - Speak only English Native:
77.4% (28)Foreign-born:
11.7% (10)
Other race - Speak another language Native:
22.8% (8)Foreign-born:
79.1% (69)
Two or more races - Speak another language Native:
0.8% (5)Foreign-born:
100.0% (53)
White alone - Speak only English Native:
96.5% (4,399)Foreign-born:
17.9% (14)
White alone - Speak another language Native:
3.7% (167)Foreign-born:
82.3% (66)
Hispanic or Latino - Speak only English Native:
74.1% (183)Foreign-born:
17.0% (21)
Hispanic or Latino - Speak another language Native:
23.8% (59)Foreign-born:
80.0% (98)
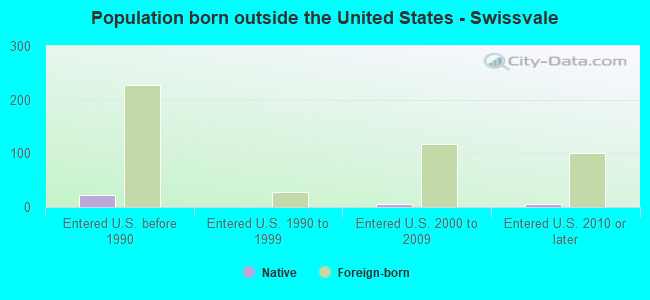
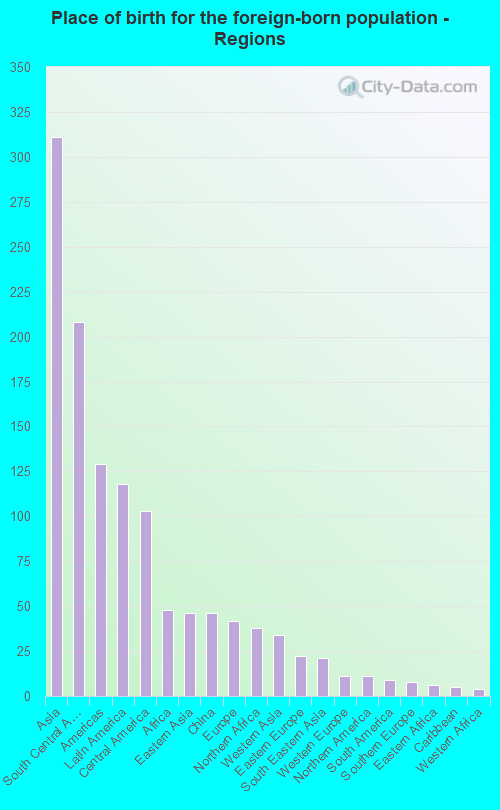
Foreign-born residents in Swissvale 532 residents are foreign born (3.5% Asia , 1.3% Latin America ).
This city:
6.3%Pennsylvania:
7.3%
Marital status for residents in Swissvale Marital status - White (Caucasian) population 15 years and over
Males 54.7% Never married37.0% Now married0.7% Separated1.4% Widowed6.3% DivorcedFemales 38.5% Never married29.7% Now married6.0% Separated8.2% Widowed17.7% DivorcedWomen who gave birth in the past 12 months Now married:
100.0% (24)Unmarried:
0.0% (0)
Women who did not give birth in the past 12 months Now married:
35.8% (437)Unmarried:
64.2% (784)
Marital status - Black or African American population 15 years and over
Males 69.0% Never married15.5% Now married0.6% Separated0.7% Widowed14.2% DivorcedFemales 67.8% Never married12.9% Now married3.4% Separated3.7% Widowed12.2% DivorcedWomen who gave birth in the past 12 months Now married:
0.0% (0)Unmarried:
100.0% (56)
Women who did not give birth in the past 12 months Now married:
16.1% (116)Unmarried:
83.9% (602)
Marital status - Asian population 15 years and over
Males 10.2% Never married89.8% Now married0.0% Separated0.0% Widowed0.0% DivorcedFemales 6.2% Never married73.2% Now married13.4% Separated0.0% Widowed7.2% DivorcedWomen who did not give birth in the past 12 months Now married:
78.6% (23)Unmarried:
21.4% (6)
Marital status - Other race population 15 years and over
Males 94.5% Never married0.0% Now married0.0% Separated5.5% Widowed0.0% DivorcedFemales 91.2% Never married8.8% Now married0.0% Separated0.0% Widowed0.0% DivorcedWomen who did not give birth in the past 12 months Now married:
8.8% (7)Unmarried:
91.2% (77)
Marital status - Two or more races population 15 years and over
Males 74.8% Never married11.7% Now married0.0% Separated0.0% Widowed13.5% DivorcedFemales 64.1% Never married35.1% Now married0.0% Separated0.0% Widowed0.8% DivorcedWomen who did not give birth in the past 12 months Now married:
39.0% (63)Unmarried:
61.0% (98)
Marital status - White alone, not Hispanic / Latino population 15 years and over
Males 54.9% Never married36.6% Now married0.7% Separated1.4% Widowed6.4% DivorcedFemales 37.6% Never married30.1% Now married6.0% Separated8.3% Widowed17.9% DivorcedWomen who gave birth in the past 12 months Now married:
100.0% (24)Unmarried:
0.0% (0)
Women who did not give birth in the past 12 months Now married:
36.7% (438)Unmarried:
63.3% (755)
Marital status - Hispanic or Latino population 15 years and over
Males 58.0% Never married28.6% Now married0.0% Separated0.0% Widowed13.4% DivorcedFemales 82.1% Never married12.9% Now married0.0% Separated0.0% Widowed5.0% DivorcedWomen who did not give birth in the past 12 months Now married:
14.3% (19)Unmarried:
85.7% (115)
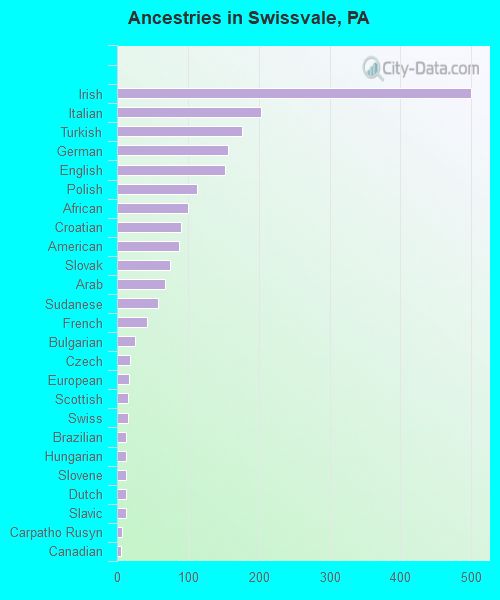
Ancestries in Swissvale
500 12.0% Irish203 4.9% Italian177 4.2% Turkish157 3.8% German152 3.6% English113 2.7% Polish100 2.4% African90 2.2% Croatian88 2.1% American75 1.8% Slovak68 1.6% Arab58 1.4% Sudanese42 1.0% French26 0.6% Bulgarian18 0.4% Czech17 0.4% European15 0.4% Scottish15 0.4% Swiss13 0.3% Brazilian13 0.3% Hungarian13 0.3% Slovene12 0.3% Dutch12 0.3% Slavic7 0.2% Carpatho Rusyn6 0.1% Canadian5 0.1% Swedish4 0.10% Russian4 0.10% Scotch-Irish3 0.07% Romanian3 0.07% Haitian2 0.05% French Canadian1 0.02% Greek
Children Nativity (place of birth) in Swissvale
Children under 6 years - Living with two parents Both parents native 151 100.0% NativeBoth parents foreign-born 13 100.0% NativeOne native, one foreign-born parent 25 100.0% NativeChildren under 6 years - Living with one parent Native parent 113 100.0% NativeForeign-born parent 37 100.0% NativeChildren 6 to 17 years - Living with two parents Both parents native 316 100.0% NativeBoth parents foreign-born 41 100.0% NativeOne native, one foreign-born parent 24 100.0% NativeChildren 6 to 17 years - Living with one parent Native parent 539 94.6% Native31 5.4% Foreign-bornForeign-born parent 5 58.3% Native3 41.7% Foreign-born
Grandparents responsible for own grandchildren in Swissvale
Grandparents (30 to 59 years) White / Caucasian 3 100.0% Responsible for grandchildrenAsian 26 100.0% Not responsible for grandchildrenWhite alone, not Hispanic / Latino 3 100.0% Responsible for grandchildrenGrandparents (60 years and over) White / Caucasian 19 51.9% Responsible for grandchildren17 48.1% Not responsible for grandchildrenWhite alone, not Hispanic / Latino 19 51.8% Responsible for grandchildren17 48.2% Not responsible for grandchildren