Races in Summerfield, North Carolina (NC) Detailed Stats
Data:
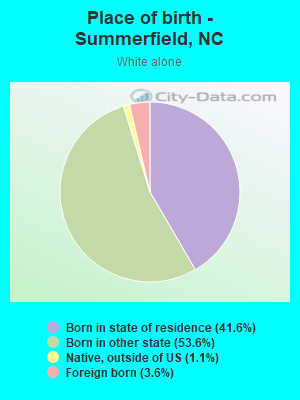
Races - White alone (%)
Races - White alone (% change since 2000)
Races - Black alone (%)
Races - Black alone (% change since 2000)
Races - American Indian alone (%)
Races - American Indian alone (% change since 2000)
Races - Asian alone (%)
Races - Asian alone (% change since 2000)
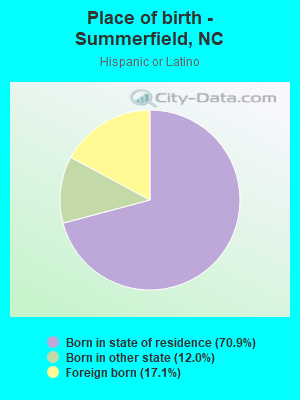
Races - Hispanic (%)
Races - Hispanic (% change since 2000)
Races - Native Hawaiian and Other Pacific Islander alone (%)
Races - Native Hawaiian and Other Pacific Islander alone (% change since 2000)
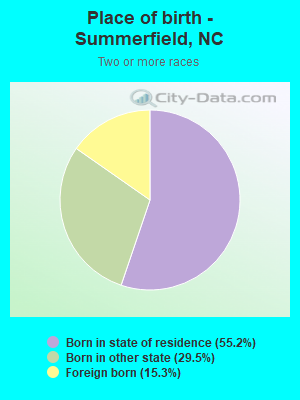
Races - Two or more races(%)
Races - Two or more races(% change since 2000)
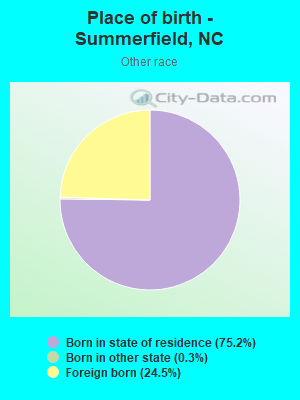
Races - Other race alone (%)
Races - Other race alone (% change since 2000)
Racial diversity
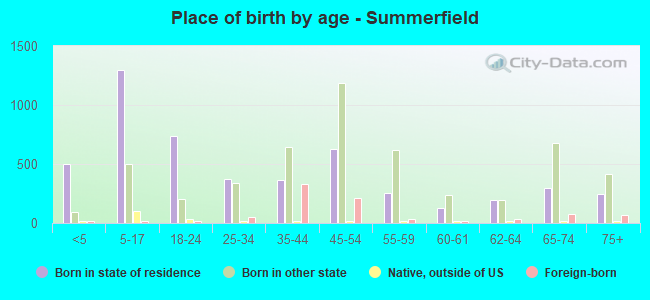
Place of birth - Born in state of residence (%)
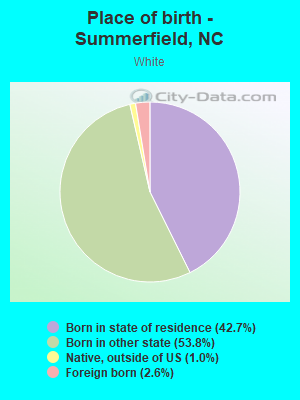
Place of birth - Born in state of residence (%) - White
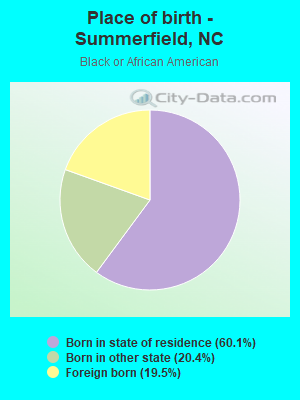
Place of birth - Born in state of residence (%) - Black or African American
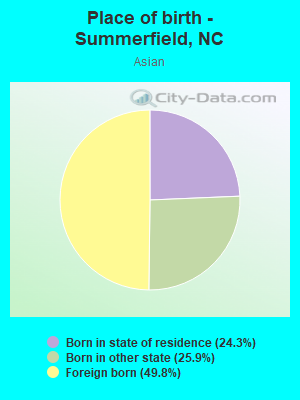
Place of birth - Born in state of residence (%) - Asian
Place of birth - Born in state of residence (%) - Hispanic or Latino
Place of birth - Born in state of residence (%) - American Indian and Alaska Native
Place of birth - Born in state of residence (%) - Multirace
Place of birth - Born in state of residence (%) - Other Race
Place of birth - Born in other state (%)
Place of birth - Born in other state (%) - White
Place of birth - Born in other state (%) - Black or African American
Place of birth - Born in other state (%) - Asian
Place of birth - Born in other state (%) - Hispanic or Latino
Place of birth - Born in other state (%) - American Indian and Alaska Native
Place of birth - Born in other state (%) - Multirace
Place of birth - Born in other state (%) - Other Race
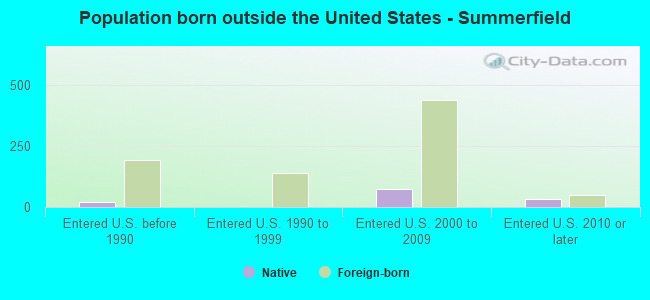
Place of birth - Native, outside of US (%)
Place of birth - Native, outside of US (%) - White
Place of birth - Native, outside of US (%) - Black or African American
Place of birth - Native, outside of US (%) - Asian
Place of birth - Native, outside of US (%) - Hispanic or Latino
Place of birth - Native, outside of US (%) - American Indian and Alaska Native
Place of birth - Native, outside of US (%) - Multirace
Place of birth - Native, outside of US (%) - Other Race
Place of birth - Foreign born (%)
Place of birth - Foreign born (%) - White
Place of birth - Foreign born (%) - Black or African American
Place of birth - Foreign born (%) - Asian
Place of birth - Foreign born (%) - Hispanic or Latino
Place of birth - Foreign born (%) - American Indian and Alaska Native
Place of birth - Foreign born (%) - Multirace
Place of birth - Foreign born (%) - Other Race
Residents speaking English at home (%)
Residents speaking English at home - Born in the United States (%)
Residents speaking English at home - Native, born elsewhere (%)
Residents speaking English at home - Foreign born (%)
Residents speaking Spanish at home (%)
Residents speaking Spanish at home - Born in the United States (%)
Residents speaking Spanish at home - Native, born elsewhere (%)
Residents speaking Spanish at home - Foreign born (%)
Residents speaking other language at home (%)
Residents speaking other language at home - Born in the United States (%)
Residents speaking other language at home - Native, born elsewhere (%)
Residents speaking other language at home - Foreign born (%)
Marital status - Never married (%)
Marital status - Now married (%)
Marital status - Separated (%)
Marital status - Widowed (%)
Marital status - Divorced (%)
Ancestries Reported - Arab (%)
Ancestries Reported - Czech (%)
Ancestries Reported - Danish (%)
Ancestries Reported - Dutch (%)
Ancestries Reported - English (%)
Ancestries Reported - French (%)
Ancestries Reported - French Canadian (%)
Ancestries Reported - German (%)
Ancestries Reported - Greek (%)
Ancestries Reported - Hungarian (%)
Ancestries Reported - Irish (%)
Ancestries Reported - Italian (%)
Ancestries Reported - Lithuanian (%)
Ancestries Reported - Norwegian (%)
Ancestries Reported - Polish (%)
Ancestries Reported - Portuguese (%)
Ancestries Reported - Russian (%)
Ancestries Reported - Scotch-Irish (%)
Ancestries Reported - Scottish (%)
Ancestries Reported - Slovak (%)
Ancestries Reported - Subsaharan African (%)
Ancestries Reported - Swedish (%)
Ancestries Reported - Swiss (%)
Ancestries Reported - Ukrainian (%)
Ancestries Reported - United States (%)
Ancestries Reported - Welsh (%)
Ancestries Reported - West Indian (%)
Ancestries Reported - Other (%)
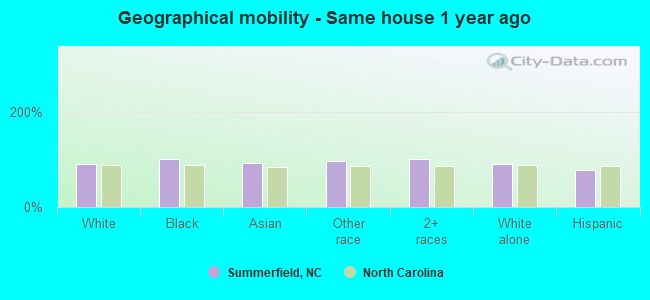
Geographical mobility - Same house 1 year ago (%)
Geographical mobility - Same house 1 year ago (%) - White
Geographical mobility - Same house 1 year ago (%) - Black or African American
Geographical mobility - Same house 1 year ago (%) - Asian
Geographical mobility - Same house 1 year ago (%) - Hispanic or Latino
Geographical mobility - Same house 1 year ago (%) - American Indian and Alaska Native
Geographical mobility - Same house 1 year ago (%) - Multirace
Geographical mobility - Same house 1 year ago (%) - Other Race
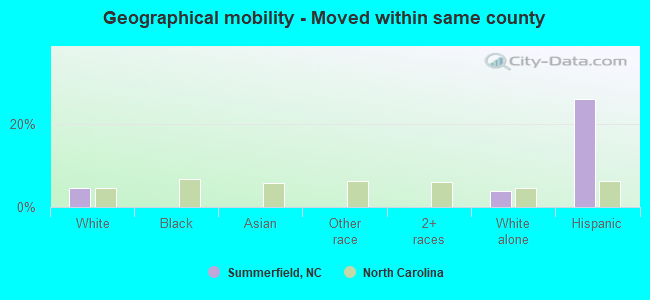
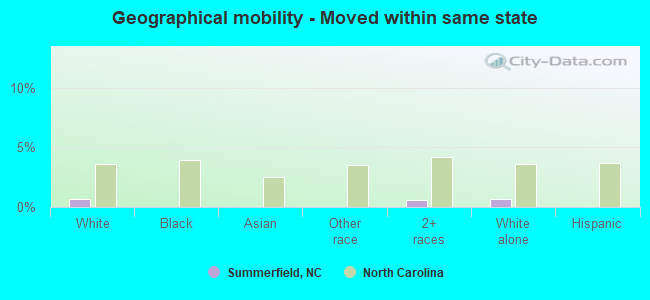
Geographical mobility - Moved within same county (%)
Geographical mobility - Moved within same county (%) - White
Geographical mobility - Moved within same county (%) - Black or African American
Geographical mobility - Moved within same county (%) - Asian
Geographical mobility - Moved within same county (%) - Hispanic or Latino
Geographical mobility - Moved within same county (%) - American Indian and Alaska Native
Geographical mobility - Moved within same county (%) - Multirace
Geographical mobility - Moved within same county (%) - Other Race
Geographical mobility - Moved from different county within same state (%)
Geographical mobility - Moved from different county within same state (%) - White
Geographical mobility - Moved from different county within same state (%) - Black or African American
Geographical mobility - Moved from different county within same state (%) - Asian
Geographical mobility - Moved from different county within same state (%) - Hispanic or Latino
Geographical mobility - Moved from different county within same state (%) - American Indian and Alaska Native
Geographical mobility - Moved from different county within same state (%) - Multirace
Geographical mobility - Moved from different county within same state (%) - Other Race
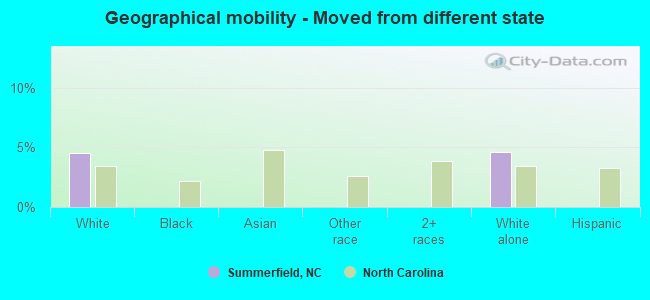
Geographical mobility - Moved from different state (%)
Geographical mobility - Moved from different state (%) - White
Geographical mobility - Moved from different state (%) - Black or African American
Geographical mobility - Moved from different state (%) - Asian
Geographical mobility - Moved from different state (%) - Hispanic or Latino
Geographical mobility - Moved from different state (%) - American Indian and Alaska Native
Geographical mobility - Moved from different state (%) - Multirace
Geographical mobility - Moved from different state (%) - Other Race
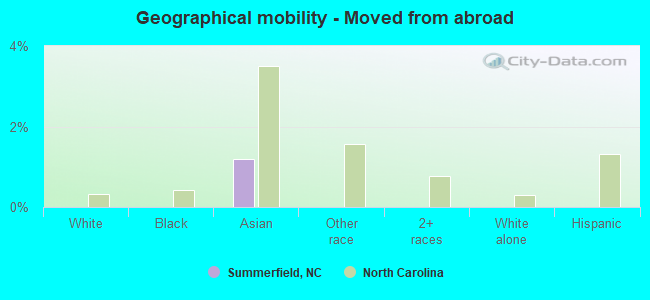
Geographical mobility - Moved from abroad (%)
Geographical mobility - Moved from abroad (%) - White
Geographical mobility - Moved from abroad (%) - Black or African American
Geographical mobility - Moved from abroad (%) - Asian
Geographical mobility - Moved from abroad (%) - Hispanic or Latino
Geographical mobility - Moved from abroad (%) - American Indian and Alaska Native
Geographical mobility - Moved from abroad (%) - Multirace
Geographical mobility - Moved from abroad (%) - Other Race
Place of birth for the foreign-born population - Ireland (%)
Place of birth for the foreign-born population - Denmark (%)
Place of birth for the foreign-born population - Norway (%)
Place of birth for the foreign-born population - Sweden (%)
Place of birth for the foreign-born population - United Kingdom (%)
Place of birth for the foreign-born population - England (%)
Place of birth for the foreign-born population - Scotland (%)
Place of birth for the foreign-born population - Other Northern Europe (%)
Place of birth for the foreign-born population - Austria (%)
Place of birth for the foreign-born population - Belgium (%)
Place of birth for the foreign-born population - France (%)
Place of birth for the foreign-born population - Germany (%)
Place of birth for the foreign-born population - Netherlands (%)
Place of birth for the foreign-born population - Switzerland (%)
Place of birth for the foreign-born population - Other Western Europe (%)
Place of birth for the foreign-born population - Greece (%)
Place of birth for the foreign-born population - Italy (%)
Place of birth for the foreign-born population - Portugal (%)
Place of birth for the foreign-born population - Spain (%)
Place of birth for the foreign-born population - Other Southern Europe (%)
Place of birth for the foreign-born population - Albania (%)
Place of birth for the foreign-born population - Belarus (%)
Place of birth for the foreign-born population - Bosnia and Herzegovina (%)
Place of birth for the foreign-born population - Bulgaria (%)
Place of birth for the foreign-born population - Croatia (%)
Place of birth for the foreign-born population - Czechoslovakia (%)
Place of birth for the foreign-born population - Hungary (%)
Place of birth for the foreign-born population - Latvia (%)
Place of birth for the foreign-born population - Lithuania (%)
Place of birth for the foreign-born population - North Macedonia (Macedonia) (%)
Place of birth for the foreign-born population - Moldova (%)
Place of birth for the foreign-born population - Poland (%)
Place of birth for the foreign-born population - Romania (%)
Place of birth for the foreign-born population - Russia (%)
Place of birth for the foreign-born population - Serbia (%)
Place of birth for the foreign-born population - Ukraine (%)
Place of birth for the foreign-born population - Other Eastern Europe (%)
Place of birth for the foreign-born population - China (%)
Place of birth for the foreign-born population - Hong Kong (%)
Place of birth for the foreign-born population - Taiwan (%)
Place of birth for the foreign-born population - Japan (%)
Place of birth for the foreign-born population - Korea (%)
Place of birth for the foreign-born population - Other Eastern Asia (%)
Place of birth for the foreign-born population - Afghanistan (%)
Place of birth for the foreign-born population - Bangladesh (%)
Place of birth for the foreign-born population - India (%)
Place of birth for the foreign-born population - Iran (%)
Place of birth for the foreign-born population - Kazakhstan (%)
Place of birth for the foreign-born population - Nepal (%)
Place of birth for the foreign-born population - Pakistan (%)
Place of birth for the foreign-born population - Sri Lanka (%)
Place of birth for the foreign-born population - Uzbekistan (%)
Place of birth for the foreign-born population - Other South Central Asia (%)
Place of birth for the foreign-born population - Burma (%)
Place of birth for the foreign-born population - Cambodia (%)
Place of birth for the foreign-born population - Indonesia (%)
Place of birth for the foreign-born population - Laos (%)
Place of birth for the foreign-born population - Malaysia (%)
Place of birth for the foreign-born population - Philippines (%)
Place of birth for the foreign-born population - Singapore (%)
Place of birth for the foreign-born population - Thailand (%)
Place of birth for the foreign-born population - Vietnam (%)
Place of birth for the foreign-born population - Other South Eastern Asia (%)
Place of birth for the foreign-born population - Armenia (%)
Place of birth for the foreign-born population - Iraq (%)
Place of birth for the foreign-born population - Israel (%)
Place of birth for the foreign-born population - Jordan (%)
Place of birth for the foreign-born population - Kuwait (%)
Place of birth for the foreign-born population - Lebanon (%)
Place of birth for the foreign-born population - Saudi Arabia (%)
Place of birth for the foreign-born population - Syria (%)
Place of birth for the foreign-born population - Turkey (%)
Place of birth for the foreign-born population - Yemen (%)
Place of birth for the foreign-born population - Other Western Asia (%)
Place of birth for the foreign-born population - Eritrea (%)
Place of birth for the foreign-born population - Ethiopia (%)
Place of birth for the foreign-born population - Kenya (%)
Place of birth for the foreign-born population - Somalia (%)
Place of birth for the foreign-born population - Uganda (%)
Place of birth for the foreign-born population - Zimbabwe (%)
Place of birth for the foreign-born population - Other Eastern Africa (%)
Place of birth for the foreign-born population - Cameroon (%)
Place of birth for the foreign-born population - Congo (%)
Place of birth for the foreign-born population - Democratic Republic of Congo (Zaire) (%)
Place of birth for the foreign-born population - Other Middle Africa (%)
Place of birth for the foreign-born population - Egypt (%)
Place of birth for the foreign-born population - Morocco (%)
Place of birth for the foreign-born population - Sudan (%)
Place of birth for the foreign-born population - Other Northern Africa (%)
Place of birth for the foreign-born population - South Africa (%)
Place of birth for the foreign-born population - Other Southern Africa (%)
Place of birth for the foreign-born population - Cabo Verde (%)
Place of birth for the foreign-born population - Ghana (%)
Place of birth for the foreign-born population - Liberia (%)
Place of birth for the foreign-born population - Nigeria (%)
Place of birth for the foreign-born population - Senegal (%)
Place of birth for the foreign-born population - Sierra Leone (%)
Place of birth for the foreign-born population - Other Western Africa (%)
Place of birth for the foreign-born population - Australia (%)
Place of birth for the foreign-born population - New Zealand (%)
Place of birth for the foreign-born population - Fiji (%)
Place of birth for the foreign-born population - Micronesia (%)
Place of birth for the foreign-born population - Bahamas (%)
Place of birth for the foreign-born population - Barbados (%)
Place of birth for the foreign-born population - Cuba (%)
Place of birth for the foreign-born population - Dominica (%)
Place of birth for the foreign-born population - Dominican Republic (%)
Place of birth for the foreign-born population - Grenada (%)
Place of birth for the foreign-born population - Haiti (%)
Place of birth for the foreign-born population - Jamaica (%)
Place of birth for the foreign-born population - St. Vincent and the Grenadines (%)
Place of birth for the foreign-born population - Trinidad and Tobago (%)
Place of birth for the foreign-born population - West Indies (%)
Place of birth for the foreign-born population - Other Caribbean (%)
Place of birth for the foreign-born population - Belize (%)
Place of birth for the foreign-born population - Costa Rica (%)
Place of birth for the foreign-born population - El Salvador (%)
Place of birth for the foreign-born population - Guatemala (%)
Place of birth for the foreign-born population - Honduras (%)
Place of birth for the foreign-born population - Mexico (%)
Place of birth for the foreign-born population - Nicaragua (%)
Place of birth for the foreign-born population - Panama (%)
Place of birth for the foreign-born population - Other Central America (%)
Place of birth for the foreign-born population - Argentina (%)
Place of birth for the foreign-born population - Bolivia (%)
Place of birth for the foreign-born population - Brazil (%)
Place of birth for the foreign-born population - Chile (%)
Place of birth for the foreign-born population - Colombia (%)
Place of birth for the foreign-born population - Ecuador (%)
Place of birth for the foreign-born population - Guyana (%)
Place of birth for the foreign-born population - Peru (%)
Place of birth for the foreign-born population - Uruguay (%)
Place of birth for the foreign-born population - Venezuela (%)
Place of birth for the foreign-born population - Other South America (%)
Place of birth for the foreign-born population - Canada (%)
Place of birth for the foreign-born population - Other Northern America (%)
Place of birth for the foreign-born population - Other (%)
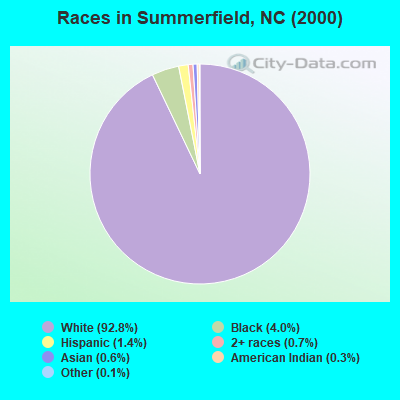
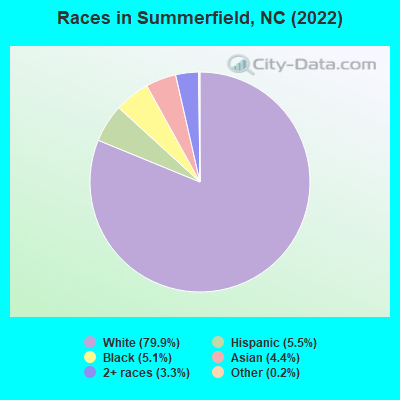
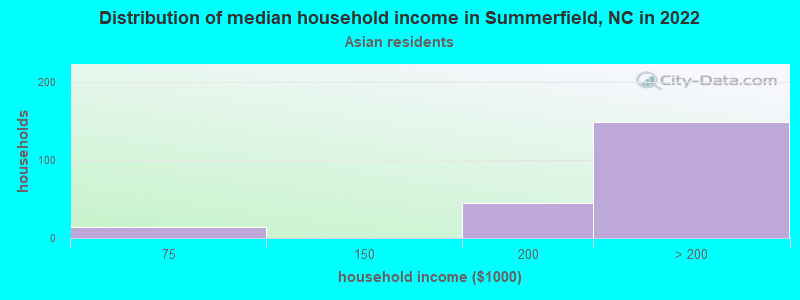
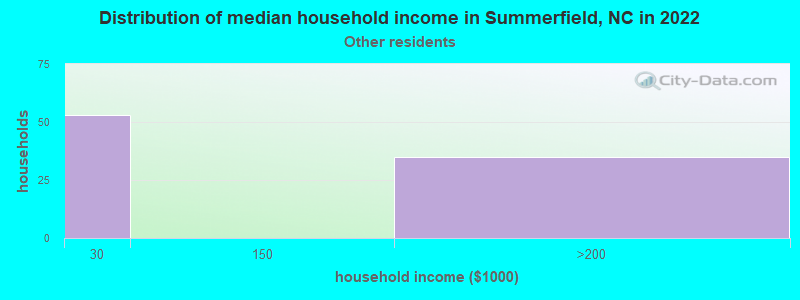
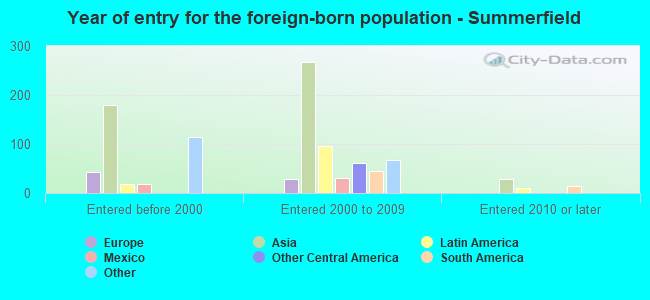
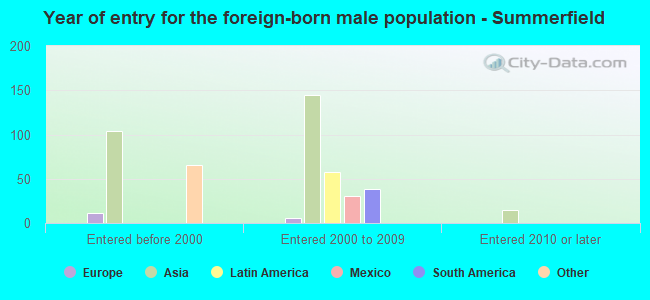
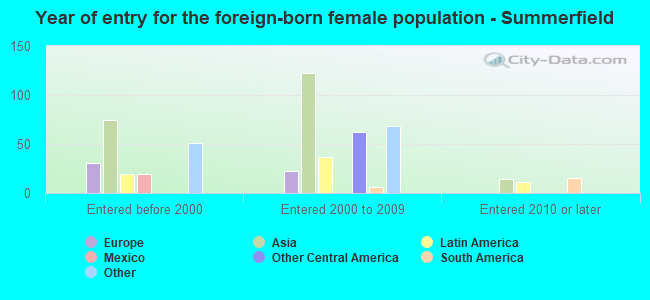
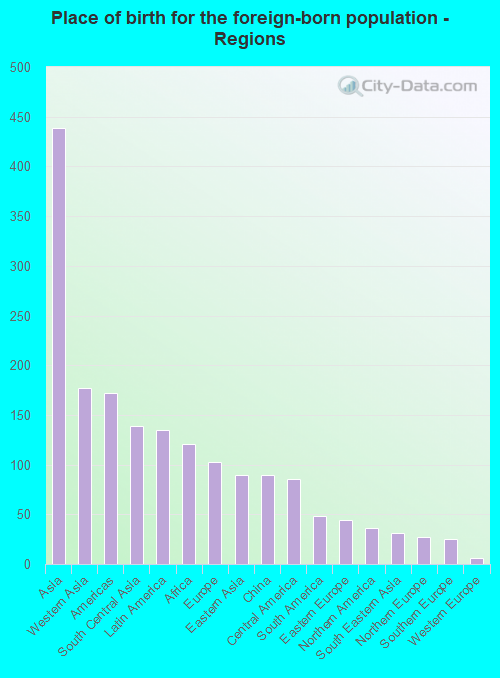
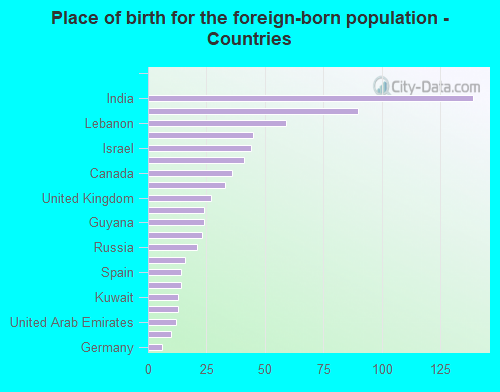
According to 2022 data, the most numerous races in Summerfield, NC are White alone (8,880 residents), Black alone (568 residents), and Hispanic (611 residents). 91.9% of Summerfield residents speak English at home. 7.5% of Summerfield, NC residents are foreign-born (3.8% born in Asia, 1.2% born in Latin America, 1.0% born in Africa, 0.9% born in Europe), which is 6.4% less than the foreign-born rate of 8.0% across the entire state of North Carolina.
Race distribution in Summerfield
2000 2022
5,647,155 70.2% White alone 1,723,301 21.4% Black alone 378,963 4.7% Hispanic 112,416 1.4% Asian alone 95,333 1.2% American Indian alone 79,965 1.0% Two or more races 9,015 0.1% Other race alone 3,165 0.04% Native Hawaiian and Other
6,497,519 60.7% White alone 2,155,650 20.1% Black alone 1,114,799 10.4% Hispanic 438,061 4.1% Two or more races 341,052 3.2% Asian alone 91,758 0.9% American Indian alone 50,180 0.5% Other race alone 9,954 0.09% Native Hawaiian and Other
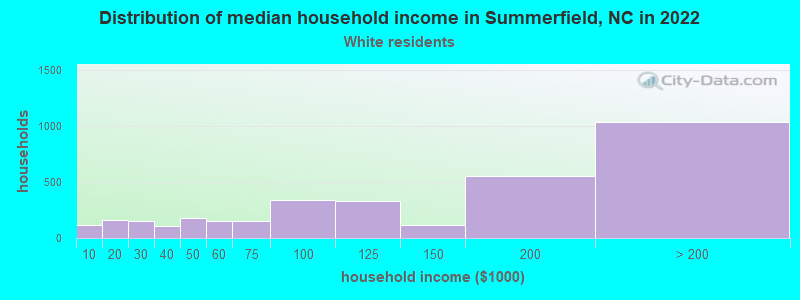
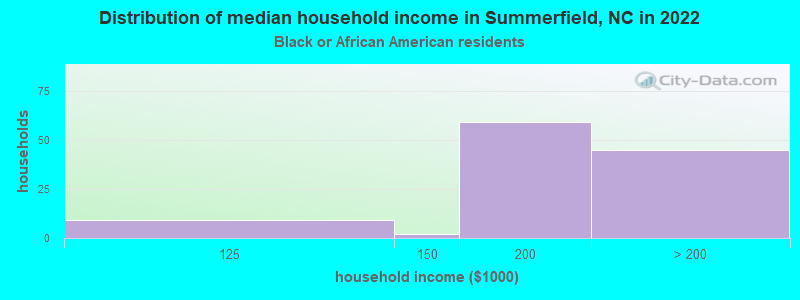
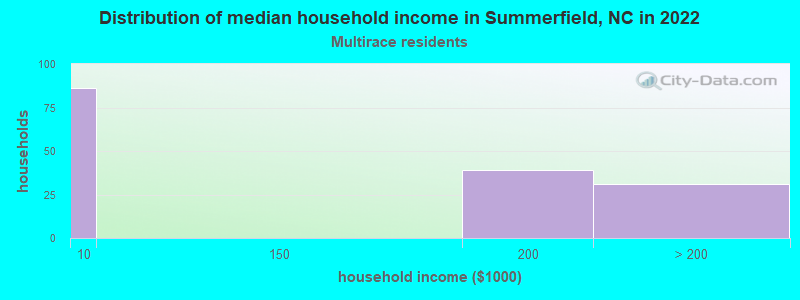
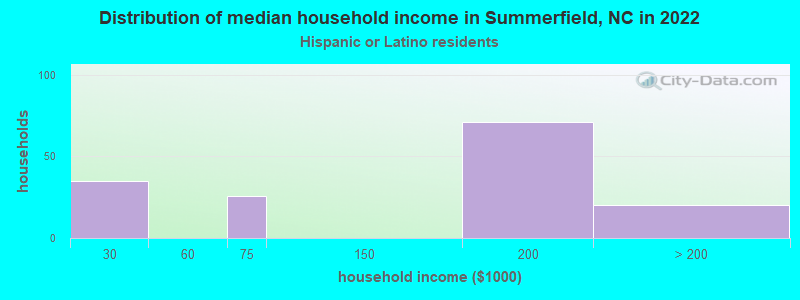
Income and house value in Summerfield Median household income in 2022 $125,712 White non-Hispanic householders$178,987 Black householdersover $200,000 Asian householders$2,826 Two or more races householders$167,938 Hispanic or Latino race householdersMedian 2022 house value $544,939 White Non-Hispanic householders$526,612 Black or African American householders$465,331 American Indian or Alaska Native householdersover $1,000,000 Two or more races householdersover $1,000,000 Hispanic or Latino householders
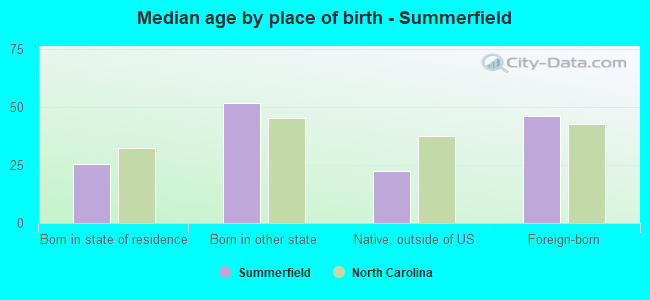
Median age by race in Summerfield
50.9 Median age for White residents51.1 49.9 37.5 Median age for Black or African American residents36.8 41.1 -911,616,160.7 Median age for American Indian / Alaska Native residents-783,333,332.6 -1,007,936,506.9 43.3 Median age for Asian residents42.4 46.7 -609,884,331.7 Median age for Native Hawaiian / Pacific Islander residents-611,708,482.1 -612,403,100.2 10.3 Median age for Other race residents9.0 13.4 15.2 Median age for Two or more races residents15.3 15.3 49.3 Median age for White alone residents50.3 48.7 22.7 Median age for Hispanic or Latino residents46.0 18.4
Owner/renter occupied households by race in Summerfield
House owners and renters - White residents 3,033 87.9% Owner occupied419 12.1% Renter occupiedHouse owners and renters - Black or African American residents 118 100.0% Owner occupiedHouse owners and renters - Asian residents 171 100.0% Owner occupiedHouse owners and renters - Other race residents 93 100.0% Owner occupiedHouse owners and renters - Two or more races residents 41 35.6% Owner occupied74 64.4% Renter occupiedHouse owners and renters - White alone residents 3,008 87.2% Owner occupied443 12.8% Renter occupiedHouse owners and renters - Hispanic or Latino residents 144 100.0% Owner occupied
Language usage in Summerfield
English speakers - Total 91.9% of residents of Summerfield speak English at home.
3.0% of residents speak Spanish at home 212 66.5% Speak English very well107 33.5% Speak English less than very well4.1% of residents speak other language at home 421 97.2% Speak English very well12 2.8% Speak English less than very well
English speakers - Born in the United States 97.3% of residents of Summerfield speak English at home.
1.3% of residents speak Spanish at home 67 100.0% Speak English very well0.9% of residents speak other language at home 47 100.0% Speak English very well
English speakers - Native, born elsewhere 69.8% of residents of Summerfield speak English at home.
22.2% of residents speak other language at home 28 100.0% Speak English very well
English speakers - Foreign-born 54.6% of residents of Summerfield speak English at home.
11.7% of residents speak Spanish at home 10 10.5% Speak English very well85 89.5% Speak English less than very well35.3% of residents speak other language at home 275 95.8% Speak English very well12 4.2% Speak English less than very well
White (Caucasian) - Speak only English Native:
98.6% (8,201)Foreign-born:
70.7% (160)
White (Caucasian) - Speak another language Native:
1.7% (140)Foreign-born:
40.5% (92)
Black or African American - Speak only English Native:
98.9% (425)Foreign-born:
97.9% (112)
Asian - Speak only English Native:
71.5% (117)Foreign-born:
42.8% (111)
Asian - Speak another language Native:
25.5% (42)Foreign-born:
48.2% (125)
Other race - Speak only English Native:
29.4% (54)Foreign-born:
30.2% (32)
Other race - Speak another language Native:
58.8% (108)Foreign-born:
68.3% (72)
Two or more races - Speak another language Native:
22.4% (71)Foreign-born:
94.1% (70)
White alone - Speak only English Native:
97.7% (8,043)Foreign-born:
54.2% (174)
White alone - Speak another language Native:
2.4% (195)Foreign-born:
46.3% (149)
Hispanic or Latino - Speak only English Native:
54.4% (247)Foreign-born:
23.5% (26)
Hispanic or Latino - Speak another language Native:
29.2% (133)Foreign-born:
79.3% (89)
Foreign-born residents in Summerfield 836 residents are foreign born (3.8% Asia , 1.2% Latin America , 1.0% Africa , 0.9% Europe ).
This city:
7.5%North Carolina:
8.3%
Marital status for residents in Summerfield Marital status - White (Caucasian) population 15 years and over
Males 24.9% Never married66.4% Now married1.3% Separated1.5% Widowed5.8% DivorcedFemales 22.8% Never married62.6% Now married1.0% Separated4.3% Widowed9.3% DivorcedWomen who gave birth in the past 12 months Now married:
100.0% (57)Unmarried:
0.0% (0)
Women who did not give birth in the past 12 months Now married:
51.4% (979)Unmarried:
48.6% (924)
Marital status - Black or African American population 15 years and over
Males 29.0% Never married71.0% Now married0.0% Separated0.0% Widowed0.0% DivorcedFemales 41.0% Never married31.3% Now married0.0% Separated8.2% Widowed19.5% DivorcedWomen who did not give birth in the past 12 months Now married:
33.3% (67)Unmarried:
66.7% (135)
Marital status - Asian population 15 years and over
Males 19.3% Never married80.7% Now married0.0% Separated0.0% Widowed0.0% DivorcedFemales 7.6% Never married92.4% Now married0.0% Separated0.0% Widowed0.0% DivorcedWomen who did not give birth in the past 12 months Now married:
91.2% (107)Unmarried:
8.8% (10)
Marital status - Other race population 15 years and over
Males 4.2% Never married95.8% Now married0.0% Separated0.0% Widowed0.0% DivorcedFemales 89.7% Never married10.3% Now married0.0% Separated0.0% Widowed0.0% DivorcedWomen who gave birth in the past 12 months Now married:
20.4% (16)Unmarried:
79.6% (62)
Women who did not give birth in the past 12 months Now married:
0.0% (0)Unmarried:
100.0% (76)
Marital status - Two or more races population 15 years and over
Males 56.2% Never married43.8% Now married0.0% Separated0.0% Widowed0.0% DivorcedFemales 51.2% Never married48.8% Now married0.0% Separated0.0% Widowed0.0% DivorcedWomen who did not give birth in the past 12 months Now married:
68.4% (34)Unmarried:
31.6% (16)
Marital status - White alone, not Hispanic / Latino population 15 years and over
Males 25.1% Never married68.7% Now married0.0% Separated1.5% Widowed4.7% DivorcedFemales 22.8% Never married62.9% Now married1.0% Separated4.4% Widowed8.8% DivorcedWomen who gave birth in the past 12 months Now married:
100.0% (59)Unmarried:
0.0% (0)
Women who did not give birth in the past 12 months Now married:
50.5% (985)Unmarried:
49.5% (963)
Marital status - Hispanic or Latino population 15 years and over
Males 25.7% Never married29.2% Now married22.6% Separated0.0% Widowed22.6% DivorcedFemales 53.0% Never married33.5% Now married0.0% Separated0.0% Widowed13.5% DivorcedWomen who gave birth in the past 12 months Now married:
0.0% (0)Unmarried:
100.0% (42)
Women who did not give birth in the past 12 months Now married:
52.5% (56)Unmarried:
47.5% (51)
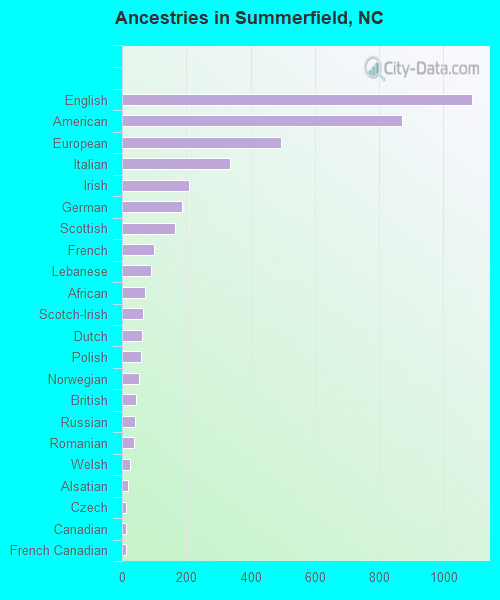
Ancestries in Summerfield
1,088 19.4% English872 15.6% American495 8.8% European335 6.0% Italian210 3.8% Irish187 3.3% German166 3.0% Scottish100 1.8% French91 1.6% Lebanese72 1.3% African66 1.2% Scotch-Irish62 1.1% Dutch59 1.1% Polish52 0.9% Norwegian43 0.8% British41 0.7% Russian37 0.7% Romanian24 0.4% Welsh19 0.3% Alsatian13 0.2% Czech11 0.2% Canadian11 0.2% French Canadian9 0.2% Palestinian9 0.2% Portuguese7 0.1% Turkish5 0.09% Danish5 0.09% Swiss
Children Nativity (place of birth) in Summerfield
Children under 6 years - Living with two parents Both parents native 362 100.0% NativeBoth parents foreign-born 71 100.0% NativeOne native, one foreign-born parent 84 100.0% NativeChildren under 6 years - Living with one parent Native parent 47 100.0% NativeForeign-born parent 98 100.0% NativeChildren 6 to 17 years - Living with two parents Both parents native 1,174 100.0% Native0 0.0% Foreign-bornBoth parents foreign-born 176 96.3% Native7 3.7% Foreign-bornOne native, one foreign-born parent 86 100.0% NativeChildren 6 to 17 years - Living with one parent Native parent 187 100.0% NativeForeign-born parent 168 50.4% Native166 49.6% Foreign-born
Grandparents responsible for own grandchildren in Summerfield
Grandparents (30 to 59 years) White / Caucasian 30 32.6% Responsible for grandchildren63 67.4% Not responsible for grandchildrenWhite alone, not Hispanic / Latino 35 34.4% Responsible for grandchildren68 65.6% Not responsible for grandchildrenGrandparents (60 years and over) White / Caucasian 9 11.3% Responsible for grandchildren73 88.7% Not responsible for grandchildrenWhite alone, not Hispanic / Latino 9 14.1% Responsible for grandchildren57 85.9% Not responsible for grandchildren