Races in Summerfield, Maryland (MD) Detailed Stats
Data:
Races - White alone (%)
Races - White alone (% change since 2000)
Races - Black alone (%)
Races - Black alone (% change since 2000)
Races - American Indian alone (%)
Races - American Indian alone (% change since 2000)
Races - Asian alone (%)
Races - Asian alone (% change since 2000)
Races - Hispanic (%)
Races - Hispanic (% change since 2000)
Races - Native Hawaiian and Other Pacific Islander alone (%)
Races - Native Hawaiian and Other Pacific Islander alone (% change since 2000)
Races - Two or more races(%)
Races - Two or more races(% change since 2000)
Races - Other race alone (%)
Races - Other race alone (% change since 2000)
Racial diversity
Place of birth - Born in state of residence (%)
Place of birth - Born in state of residence (%) - White
Place of birth - Born in state of residence (%) - Black or African American
Place of birth - Born in state of residence (%) - Asian
Place of birth - Born in state of residence (%) - Hispanic or Latino
Place of birth - Born in state of residence (%) - American Indian and Alaska Native
Place of birth - Born in state of residence (%) - Multirace
Place of birth - Born in state of residence (%) - Other Race
Place of birth - Born in other state (%)
Place of birth - Born in other state (%) - White
Place of birth - Born in other state (%) - Black or African American
Place of birth - Born in other state (%) - Asian
Place of birth - Born in other state (%) - Hispanic or Latino
Place of birth - Born in other state (%) - American Indian and Alaska Native
Place of birth - Born in other state (%) - Multirace
Place of birth - Born in other state (%) - Other Race
Place of birth - Native, outside of US (%)
Place of birth - Native, outside of US (%) - White
Place of birth - Native, outside of US (%) - Black or African American
Place of birth - Native, outside of US (%) - Asian
Place of birth - Native, outside of US (%) - Hispanic or Latino
Place of birth - Native, outside of US (%) - American Indian and Alaska Native
Place of birth - Native, outside of US (%) - Multirace
Place of birth - Native, outside of US (%) - Other Race
Place of birth - Foreign born (%)
Place of birth - Foreign born (%) - White
Place of birth - Foreign born (%) - Black or African American
Place of birth - Foreign born (%) - Asian
Place of birth - Foreign born (%) - Hispanic or Latino
Place of birth - Foreign born (%) - American Indian and Alaska Native
Place of birth - Foreign born (%) - Multirace
Place of birth - Foreign born (%) - Other Race
Residents speaking English at home (%)
Residents speaking English at home - Born in the United States (%)
Residents speaking English at home - Native, born elsewhere (%)
Residents speaking English at home - Foreign born (%)
Residents speaking Spanish at home (%)
Residents speaking Spanish at home - Born in the United States (%)
Residents speaking Spanish at home - Native, born elsewhere (%)
Residents speaking Spanish at home - Foreign born (%)
Residents speaking other language at home (%)
Residents speaking other language at home - Born in the United States (%)
Residents speaking other language at home - Native, born elsewhere (%)
Residents speaking other language at home - Foreign born (%)
Marital status - Never married (%)
Marital status - Now married (%)
Marital status - Separated (%)
Marital status - Widowed (%)
Marital status - Divorced (%)
Ancestries Reported - Arab (%)
Ancestries Reported - Czech (%)
Ancestries Reported - Danish (%)
Ancestries Reported - Dutch (%)
Ancestries Reported - English (%)
Ancestries Reported - French (%)
Ancestries Reported - French Canadian (%)
Ancestries Reported - German (%)
Ancestries Reported - Greek (%)
Ancestries Reported - Hungarian (%)
Ancestries Reported - Irish (%)
Ancestries Reported - Italian (%)
Ancestries Reported - Lithuanian (%)
Ancestries Reported - Norwegian (%)
Ancestries Reported - Polish (%)
Ancestries Reported - Portuguese (%)
Ancestries Reported - Russian (%)
Ancestries Reported - Scotch-Irish (%)
Ancestries Reported - Scottish (%)
Ancestries Reported - Slovak (%)
Ancestries Reported - Subsaharan African (%)
Ancestries Reported - Swedish (%)
Ancestries Reported - Swiss (%)
Ancestries Reported - Ukrainian (%)
Ancestries Reported - United States (%)
Ancestries Reported - Welsh (%)
Ancestries Reported - West Indian (%)
Ancestries Reported - Other (%)
Geographical mobility - Same house 1 year ago (%)
Geographical mobility - Same house 1 year ago (%) - White
Geographical mobility - Same house 1 year ago (%) - Black or African American
Geographical mobility - Same house 1 year ago (%) - Asian
Geographical mobility - Same house 1 year ago (%) - Hispanic or Latino
Geographical mobility - Same house 1 year ago (%) - American Indian and Alaska Native
Geographical mobility - Same house 1 year ago (%) - Multirace
Geographical mobility - Same house 1 year ago (%) - Other Race
Geographical mobility - Moved within same county (%)
Geographical mobility - Moved within same county (%) - White
Geographical mobility - Moved within same county (%) - Black or African American
Geographical mobility - Moved within same county (%) - Asian
Geographical mobility - Moved within same county (%) - Hispanic or Latino
Geographical mobility - Moved within same county (%) - American Indian and Alaska Native
Geographical mobility - Moved within same county (%) - Multirace
Geographical mobility - Moved within same county (%) - Other Race
Geographical mobility - Moved from different county within same state (%)
Geographical mobility - Moved from different county within same state (%) - White
Geographical mobility - Moved from different county within same state (%) - Black or African American
Geographical mobility - Moved from different county within same state (%) - Asian
Geographical mobility - Moved from different county within same state (%) - Hispanic or Latino
Geographical mobility - Moved from different county within same state (%) - American Indian and Alaska Native
Geographical mobility - Moved from different county within same state (%) - Multirace
Geographical mobility - Moved from different county within same state (%) - Other Race
Geographical mobility - Moved from different state (%)
Geographical mobility - Moved from different state (%) - White
Geographical mobility - Moved from different state (%) - Black or African American
Geographical mobility - Moved from different state (%) - Asian
Geographical mobility - Moved from different state (%) - Hispanic or Latino
Geographical mobility - Moved from different state (%) - American Indian and Alaska Native
Geographical mobility - Moved from different state (%) - Multirace
Geographical mobility - Moved from different state (%) - Other Race
Geographical mobility - Moved from abroad (%)
Geographical mobility - Moved from abroad (%) - White
Geographical mobility - Moved from abroad (%) - Black or African American
Geographical mobility - Moved from abroad (%) - Asian
Geographical mobility - Moved from abroad (%) - Hispanic or Latino
Geographical mobility - Moved from abroad (%) - American Indian and Alaska Native
Geographical mobility - Moved from abroad (%) - Multirace
Geographical mobility - Moved from abroad (%) - Other Race
Place of birth for the foreign-born population - Ireland (%)
Place of birth for the foreign-born population - Denmark (%)
Place of birth for the foreign-born population - Norway (%)
Place of birth for the foreign-born population - Sweden (%)
Place of birth for the foreign-born population - United Kingdom (%)
Place of birth for the foreign-born population - England (%)
Place of birth for the foreign-born population - Scotland (%)
Place of birth for the foreign-born population - Other Northern Europe (%)
Place of birth for the foreign-born population - Austria (%)
Place of birth for the foreign-born population - Belgium (%)
Place of birth for the foreign-born population - France (%)
Place of birth for the foreign-born population - Germany (%)
Place of birth for the foreign-born population - Netherlands (%)
Place of birth for the foreign-born population - Switzerland (%)
Place of birth for the foreign-born population - Other Western Europe (%)
Place of birth for the foreign-born population - Greece (%)
Place of birth for the foreign-born population - Italy (%)
Place of birth for the foreign-born population - Portugal (%)
Place of birth for the foreign-born population - Spain (%)
Place of birth for the foreign-born population - Other Southern Europe (%)
Place of birth for the foreign-born population - Albania (%)
Place of birth for the foreign-born population - Belarus (%)
Place of birth for the foreign-born population - Bosnia and Herzegovina (%)
Place of birth for the foreign-born population - Bulgaria (%)
Place of birth for the foreign-born population - Croatia (%)
Place of birth for the foreign-born population - Czechoslovakia (%)
Place of birth for the foreign-born population - Hungary (%)
Place of birth for the foreign-born population - Latvia (%)
Place of birth for the foreign-born population - Lithuania (%)
Place of birth for the foreign-born population - North Macedonia (Macedonia) (%)
Place of birth for the foreign-born population - Moldova (%)
Place of birth for the foreign-born population - Poland (%)
Place of birth for the foreign-born population - Romania (%)
Place of birth for the foreign-born population - Russia (%)
Place of birth for the foreign-born population - Serbia (%)
Place of birth for the foreign-born population - Ukraine (%)
Place of birth for the foreign-born population - Other Eastern Europe (%)
Place of birth for the foreign-born population - China (%)
Place of birth for the foreign-born population - Hong Kong (%)
Place of birth for the foreign-born population - Taiwan (%)
Place of birth for the foreign-born population - Japan (%)
Place of birth for the foreign-born population - Korea (%)
Place of birth for the foreign-born population - Other Eastern Asia (%)
Place of birth for the foreign-born population - Afghanistan (%)
Place of birth for the foreign-born population - Bangladesh (%)
Place of birth for the foreign-born population - India (%)
Place of birth for the foreign-born population - Iran (%)
Place of birth for the foreign-born population - Kazakhstan (%)
Place of birth for the foreign-born population - Nepal (%)
Place of birth for the foreign-born population - Pakistan (%)
Place of birth for the foreign-born population - Sri Lanka (%)
Place of birth for the foreign-born population - Uzbekistan (%)
Place of birth for the foreign-born population - Other South Central Asia (%)
Place of birth for the foreign-born population - Burma (%)
Place of birth for the foreign-born population - Cambodia (%)
Place of birth for the foreign-born population - Indonesia (%)
Place of birth for the foreign-born population - Laos (%)
Place of birth for the foreign-born population - Malaysia (%)
Place of birth for the foreign-born population - Philippines (%)
Place of birth for the foreign-born population - Singapore (%)
Place of birth for the foreign-born population - Thailand (%)
Place of birth for the foreign-born population - Vietnam (%)
Place of birth for the foreign-born population - Other South Eastern Asia (%)
Place of birth for the foreign-born population - Armenia (%)
Place of birth for the foreign-born population - Iraq (%)
Place of birth for the foreign-born population - Israel (%)
Place of birth for the foreign-born population - Jordan (%)
Place of birth for the foreign-born population - Kuwait (%)
Place of birth for the foreign-born population - Lebanon (%)
Place of birth for the foreign-born population - Saudi Arabia (%)
Place of birth for the foreign-born population - Syria (%)
Place of birth for the foreign-born population - Turkey (%)
Place of birth for the foreign-born population - Yemen (%)
Place of birth for the foreign-born population - Other Western Asia (%)
Place of birth for the foreign-born population - Eritrea (%)
Place of birth for the foreign-born population - Ethiopia (%)
Place of birth for the foreign-born population - Kenya (%)
Place of birth for the foreign-born population - Somalia (%)
Place of birth for the foreign-born population - Uganda (%)
Place of birth for the foreign-born population - Zimbabwe (%)
Place of birth for the foreign-born population - Other Eastern Africa (%)
Place of birth for the foreign-born population - Cameroon (%)
Place of birth for the foreign-born population - Congo (%)
Place of birth for the foreign-born population - Democratic Republic of Congo (Zaire) (%)
Place of birth for the foreign-born population - Other Middle Africa (%)
Place of birth for the foreign-born population - Egypt (%)
Place of birth for the foreign-born population - Morocco (%)
Place of birth for the foreign-born population - Sudan (%)
Place of birth for the foreign-born population - Other Northern Africa (%)
Place of birth for the foreign-born population - South Africa (%)
Place of birth for the foreign-born population - Other Southern Africa (%)
Place of birth for the foreign-born population - Cabo Verde (%)
Place of birth for the foreign-born population - Ghana (%)
Place of birth for the foreign-born population - Liberia (%)
Place of birth for the foreign-born population - Nigeria (%)
Place of birth for the foreign-born population - Senegal (%)
Place of birth for the foreign-born population - Sierra Leone (%)
Place of birth for the foreign-born population - Other Western Africa (%)
Place of birth for the foreign-born population - Australia (%)
Place of birth for the foreign-born population - New Zealand (%)
Place of birth for the foreign-born population - Fiji (%)
Place of birth for the foreign-born population - Micronesia (%)
Place of birth for the foreign-born population - Bahamas (%)
Place of birth for the foreign-born population - Barbados (%)
Place of birth for the foreign-born population - Cuba (%)
Place of birth for the foreign-born population - Dominica (%)
Place of birth for the foreign-born population - Dominican Republic (%)
Place of birth for the foreign-born population - Grenada (%)
Place of birth for the foreign-born population - Haiti (%)
Place of birth for the foreign-born population - Jamaica (%)
Place of birth for the foreign-born population - St. Vincent and the Grenadines (%)
Place of birth for the foreign-born population - Trinidad and Tobago (%)
Place of birth for the foreign-born population - West Indies (%)
Place of birth for the foreign-born population - Other Caribbean (%)
Place of birth for the foreign-born population - Belize (%)
Place of birth for the foreign-born population - Costa Rica (%)
Place of birth for the foreign-born population - El Salvador (%)
Place of birth for the foreign-born population - Guatemala (%)
Place of birth for the foreign-born population - Honduras (%)
Place of birth for the foreign-born population - Mexico (%)
Place of birth for the foreign-born population - Nicaragua (%)
Place of birth for the foreign-born population - Panama (%)
Place of birth for the foreign-born population - Other Central America (%)
Place of birth for the foreign-born population - Argentina (%)
Place of birth for the foreign-born population - Bolivia (%)
Place of birth for the foreign-born population - Brazil (%)
Place of birth for the foreign-born population - Chile (%)
Place of birth for the foreign-born population - Colombia (%)
Place of birth for the foreign-born population - Ecuador (%)
Place of birth for the foreign-born population - Guyana (%)
Place of birth for the foreign-born population - Peru (%)
Place of birth for the foreign-born population - Uruguay (%)
Place of birth for the foreign-born population - Venezuela (%)
Place of birth for the foreign-born population - Other South America (%)
Place of birth for the foreign-born population - Canada (%)
Place of birth for the foreign-born population - Other Northern America (%)
Place of birth for the foreign-born population - Other (%)
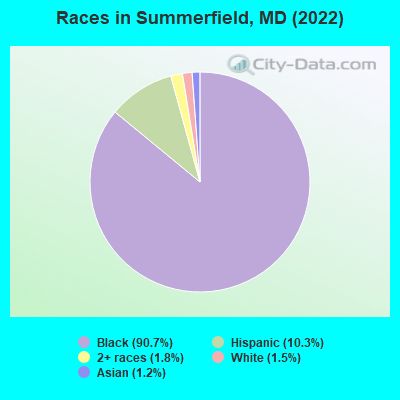
According to 2022 data, the most numerous races in Summerfield, MD are White alone (240 residents), Black alone (14,585 residents), and Hispanic (1,662 residents). 77.0% of Summerfield residents speak English at home.
Race distribution in Summerfield 14,585 90.7% Black alone 1,662 10.3% Hispanic 296 1.8% Two or more races 240 1.5% White alone 185 1.2% Asian alone
2000 2022
3,286,547 62.1% White alone 1,464,735 27.7% Black alone 227,916 4.3% Hispanic 209,738 4.0% Asian alone 82,946 1.6% Two or more races 13,312 0.3% American Indian alone 9,379 0.2% Other race alone 1,913 0.04% Native Hawaiian and Other
2,906,492 47.1% White alone 1,800,914 29.2% Black alone 705,842 11.4% Hispanic 401,818 6.5% Asian alone 291,317 4.7% Two or more races 46,930 0.8% Other race alone 8,930 0.1% American Indian alone 2,417 0.04% Native Hawaiian and Other
Income and house value in Summerfield Median household income in 2022 $129,361 White non-Hispanic householders$79,029 Black householders$78,330 Two or more races householders$82,496 Hispanic or Latino race householders
Median age by race in Summerfield
11.1 Median age for White residents6.4 29.4 37.8 Median age for Black or African American residents36.2 38.7 58.0 Median age for American Indian / Alaska Native residents-674,418,604.0 74.0 67.1 Median age for Asian residents65.0 63.9 -534,101,824.6 Median age for Native Hawaiian / Pacific Islander residents-720,061,021.4 -760,942,760.2 29.5 Median age for Other race residents27.8 33.1 41.7 Median age for Two or more races residents23.5 48.1 30.1 Median age for White alone residents4.4 41.0 32.4 Median age for Hispanic or Latino residents33.1 29.0
Owner/renter occupied households by race in Summerfield
House owners and renters - White residents 92 80.4% Owner occupied22 19.6% Renter occupiedHouse owners and renters - Black or African American residents 2,625 41.8% Owner occupied3,650 58.2% Renter occupiedHouse owners and renters - American Indian / Alaska Native residents 34 74.6% Owner occupied12 25.4% Renter occupiedHouse owners and renters - Asian residents 12 40.6% Owner occupied17 59.4% Renter occupiedHouse owners and renters - Other race residents 35 32.2% Owner occupied74 67.8% Renter occupiedHouse owners and renters - Two or more races residents 172 66.4% Owner occupied87 33.6% Renter occupiedHouse owners and renters - White alone residents 60 72.3% Owner occupied23 27.7% Renter occupiedHouse owners and renters - Hispanic or Latino residents 232 51.9% Owner occupied215 48.1% Renter occupied
Language usage in Summerfield
English speakers - Total 77.0% of residents of Summerfield speak English at home.
9.2% of residents speak Spanish at home 616 44.4% Speak English very well772 55.6% Speak English less than very well14.9% of residents speak other language at home 1,799 80.1% Speak English very well447 19.9% Speak English less than very well
English speakers - Born in the United States 94.5% of residents of Summerfield speak English at home.
3.6% of residents speak Spanish at home 236 76.9% Speak English very well71 23.1% Speak English less than very well1.7% of residents speak other language at home 112 76.2% Speak English very well35 23.8% Speak English less than very well
English speakers - Native, born elsewhere 90.4% of residents of Summerfield speak English at home.
English speakers - Foreign-born 15.3% of residents of Summerfield speak English at home.
32.7% of residents speak Spanish at home 95 11.3% Speak English very well747 88.7% Speak English less than very well57.6% of residents speak other language at home 1,135 76.6% Speak English very well346 23.4% Speak English less than very well
White (Caucasian) - Speak another language Native:
29.2% (59)Foreign-born:
88.0% (25)
Black or African American - Speak only English Native:
93.0% (11,139)Foreign-born:
20.9% (430)
Black or African American - Speak another language Native:
7.5% (895)Foreign-born:
82.7% (1,698)
American Indian / Alaska Native - Speak another language Native:
100.0% (66)Foreign-born:
100.0% (179)
Other race - Speak another language Native:
100.0% (282)Foreign-born:
100.0% (484)
Two or more races - Speak only English Native:
53.2% (248)Foreign-born:
21.0% (24)
Two or more races - Speak another language Native:
60.8% (284)Foreign-born:
76.8% (86)
White alone - Speak another language Native:
17.0% (21)Foreign-born:
100.0% (11)
Hispanic or Latino - Speak only English Native:
34.1% (269)Foreign-born:
3.4% (26)
Hispanic or Latino - Speak another language Native:
65.0% (512)Foreign-born:
98.7% (768)
Foreign-born residents in Summerfield
Marital status for residents in Summerfield Marital status - White (Caucasian) population 15 years and over
Males 1.2% Never married78.6% Now married0.0% Separated0.0% Widowed20.2% DivorcedFemales 15.5% Never married71.6% Now married5.2% Separated0.0% Widowed7.8% DivorcedWomen who gave birth in the past 12 months Now married:
100.0% (23)Unmarried:
0.0% (0)
Women who did not give birth in the past 12 months Now married:
71.4% (43)Unmarried:
28.6% (17)
Marital status - Black or African American population 15 years and over
Males 48.1% Never married34.3% Now married2.4% Separated5.9% Widowed9.3% DivorcedFemales 52.3% Never married24.6% Now married2.8% Separated6.1% Widowed14.3% DivorcedWomen who gave birth in the past 12 months Now married:
35.9% (81)Unmarried:
64.1% (145)
Women who did not give birth in the past 12 months Now married:
23.8% (983)Unmarried:
76.2% (3,152)
Marital status - American Indian / Alaska Native population 15 years and over
Males 38.5% Never married61.5% Now married0.0% Separated0.0% Widowed0.0% DivorcedFemales 30.8% Never married69.2% Now married0.0% Separated0.0% Widowed0.0% DivorcedWomen who did not give birth in the past 12 months Now married:
83.7% (54)Unmarried:
16.3% (10)
Marital status - Asian population 15 years and over
Males 0.0% Never married84.4% Now married0.0% Separated0.0% Widowed15.6% DivorcedFemales 0.0% Never married72.0% Now married0.0% Separated10.8% Widowed17.2% DivorcedWomen who did not give birth in the past 12 months Now married:
30.4% (8)Unmarried:
69.6% (18)
Marital status - Other race population 15 years and over
Males 69.6% Never married30.4% Now married0.0% Separated0.0% Widowed0.0% DivorcedFemales 15.5% Never married56.1% Now married13.5% Separated0.0% Widowed14.9% DivorcedWomen who did not give birth in the past 12 months Now married:
69.6% (122)Unmarried:
30.4% (54)
Marital status - Two or more races population 15 years and over
Males 48.1% Never married51.9% Now married0.0% Separated0.0% Widowed0.0% DivorcedFemales 39.3% Never married29.4% Now married7.0% Separated11.8% Widowed12.5% DivorcedWomen who did not give birth in the past 12 months Now married:
12.0% (30)Unmarried:
88.0% (219)
Marital status - White alone, not Hispanic / Latino population 15 years and over
Males 2.1% Never married61.7% Now married0.0% Separated0.0% Widowed36.2% DivorcedFemales 21.7% Never married60.2% Now married7.2% Separated0.0% Widowed10.8% DivorcedWomen who gave birth in the past 12 months Now married:
100.0% (23)Unmarried:
0.0% (0)
Women who did not give birth in the past 12 months Now married:
40.0% (12)Unmarried:
60.0% (17)
Marital status - Hispanic or Latino population 15 years and over
Males 42.9% Never married53.6% Now married0.0% Separated0.0% Widowed3.5% DivorcedFemales 33.7% Never married57.7% Now married4.1% Separated0.0% Widowed4.5% DivorcedWomen who gave birth in the past 12 months Now married:
100.0% (1)Unmarried:
0.0% (0)
Women who did not give birth in the past 12 months Now married:
52.5% (219)Unmarried:
47.5% (197)
Ancestries in Summerfield
834 7.6% Nigerian693 6.3% Haitian455 4.1% African320 2.9% Jamaican135 1.2% Ghanaian98 0.9% American93 0.8% Senegalese81 0.7% Irish81 0.7% South African66 0.6% Kenyan37 0.3% Sierra Leonean27 0.2% Trinidadian and Tobagonian18 0.2% Polish11 0.1% German11 0.1% West Indian9 0.08% Scottish8 0.07% French Canadian8 0.07% Greek8 0.07% Russian6 0.05% European
Children Nativity (place of birth) in Summerfield
Children under 6 years - Living with two parents Both parents native 127 100.0% NativeBoth parents foreign-born 274 100.0% NativeOne native, one foreign-born parent 40 100.0% NativeChildren under 6 years - Living with one parent Native parent 472 100.0% NativeForeign-born parent 122 100.0% NativeChildren 6 to 17 years - Living with two parents Both parents native 342 100.0% NativeBoth parents foreign-born 447 60.1% Native297 39.9% Foreign-bornOne native, one foreign-born parent 29 100.0% NativeChildren 6 to 17 years - Living with one parent Native parent 1,302 100.0% NativeForeign-born parent 366 53.6% Native316 46.4% Foreign-born
Grandparents responsible for own grandchildren in Summerfield
Grandparents (30 to 59 years) Black or African American 86 67.7% Responsible for grandchildren41 32.3% Not responsible for grandchildrenTwo or more races 41 100.0% Responsible for grandchildren
Grandparents (60 years and over) Black or African American 13 3.5% Responsible for grandchildren359 96.5% Not responsible for grandchildrenTwo or more races 140 100.0% Not responsible for grandchildren