Races in Sugar Hill, Georgia (GA) Detailed Stats
Data:
Races - White alone (%)
Races - White alone (% change since 2000)
Races - Black alone (%)
Races - Black alone (% change since 2000)
Races - American Indian alone (%)
Races - American Indian alone (% change since 2000)
Races - Asian alone (%)
Races - Asian alone (% change since 2000)
Races - Hispanic (%)
Races - Hispanic (% change since 2000)
Races - Native Hawaiian and Other Pacific Islander alone (%)
Races - Native Hawaiian and Other Pacific Islander alone (% change since 2000)
Races - Two or more races(%)
Races - Two or more races(% change since 2000)
Races - Other race alone (%)
Races - Other race alone (% change since 2000)
Racial diversity
Place of birth - Born in state of residence (%)
Place of birth - Born in state of residence (%) - White
Place of birth - Born in state of residence (%) - Black or African American
Place of birth - Born in state of residence (%) - Asian
Place of birth - Born in state of residence (%) - Hispanic or Latino
Place of birth - Born in state of residence (%) - American Indian and Alaska Native
Place of birth - Born in state of residence (%) - Multirace
Place of birth - Born in state of residence (%) - Other Race
Place of birth - Born in other state (%)
Place of birth - Born in other state (%) - White
Place of birth - Born in other state (%) - Black or African American
Place of birth - Born in other state (%) - Asian
Place of birth - Born in other state (%) - Hispanic or Latino
Place of birth - Born in other state (%) - American Indian and Alaska Native
Place of birth - Born in other state (%) - Multirace
Place of birth - Born in other state (%) - Other Race
Place of birth - Native, outside of US (%)
Place of birth - Native, outside of US (%) - White
Place of birth - Native, outside of US (%) - Black or African American
Place of birth - Native, outside of US (%) - Asian
Place of birth - Native, outside of US (%) - Hispanic or Latino
Place of birth - Native, outside of US (%) - American Indian and Alaska Native
Place of birth - Native, outside of US (%) - Multirace
Place of birth - Native, outside of US (%) - Other Race
Place of birth - Foreign born (%)
Place of birth - Foreign born (%) - White
Place of birth - Foreign born (%) - Black or African American
Place of birth - Foreign born (%) - Asian
Place of birth - Foreign born (%) - Hispanic or Latino
Place of birth - Foreign born (%) - American Indian and Alaska Native
Place of birth - Foreign born (%) - Multirace
Place of birth - Foreign born (%) - Other Race
Residents speaking English at home (%)
Residents speaking English at home - Born in the United States (%)
Residents speaking English at home - Native, born elsewhere (%)
Residents speaking English at home - Foreign born (%)
Residents speaking Spanish at home (%)
Residents speaking Spanish at home - Born in the United States (%)
Residents speaking Spanish at home - Native, born elsewhere (%)
Residents speaking Spanish at home - Foreign born (%)
Residents speaking other language at home (%)
Residents speaking other language at home - Born in the United States (%)
Residents speaking other language at home - Native, born elsewhere (%)
Residents speaking other language at home - Foreign born (%)
Marital status - Never married (%)
Marital status - Now married (%)
Marital status - Separated (%)
Marital status - Widowed (%)
Marital status - Divorced (%)
Ancestries Reported - Arab (%)
Ancestries Reported - Czech (%)
Ancestries Reported - Danish (%)
Ancestries Reported - Dutch (%)
Ancestries Reported - English (%)
Ancestries Reported - French (%)
Ancestries Reported - French Canadian (%)
Ancestries Reported - German (%)
Ancestries Reported - Greek (%)
Ancestries Reported - Hungarian (%)
Ancestries Reported - Irish (%)
Ancestries Reported - Italian (%)
Ancestries Reported - Lithuanian (%)
Ancestries Reported - Norwegian (%)
Ancestries Reported - Polish (%)
Ancestries Reported - Portuguese (%)
Ancestries Reported - Russian (%)
Ancestries Reported - Scotch-Irish (%)
Ancestries Reported - Scottish (%)
Ancestries Reported - Slovak (%)
Ancestries Reported - Subsaharan African (%)
Ancestries Reported - Swedish (%)
Ancestries Reported - Swiss (%)
Ancestries Reported - Ukrainian (%)
Ancestries Reported - United States (%)
Ancestries Reported - Welsh (%)
Ancestries Reported - West Indian (%)
Ancestries Reported - Other (%)
Geographical mobility - Same house 1 year ago (%)
Geographical mobility - Same house 1 year ago (%) - White
Geographical mobility - Same house 1 year ago (%) - Black or African American
Geographical mobility - Same house 1 year ago (%) - Asian
Geographical mobility - Same house 1 year ago (%) - Hispanic or Latino
Geographical mobility - Same house 1 year ago (%) - American Indian and Alaska Native
Geographical mobility - Same house 1 year ago (%) - Multirace
Geographical mobility - Same house 1 year ago (%) - Other Race
Geographical mobility - Moved within same county (%)
Geographical mobility - Moved within same county (%) - White
Geographical mobility - Moved within same county (%) - Black or African American
Geographical mobility - Moved within same county (%) - Asian
Geographical mobility - Moved within same county (%) - Hispanic or Latino
Geographical mobility - Moved within same county (%) - American Indian and Alaska Native
Geographical mobility - Moved within same county (%) - Multirace
Geographical mobility - Moved within same county (%) - Other Race
Geographical mobility - Moved from different county within same state (%)
Geographical mobility - Moved from different county within same state (%) - White
Geographical mobility - Moved from different county within same state (%) - Black or African American
Geographical mobility - Moved from different county within same state (%) - Asian
Geographical mobility - Moved from different county within same state (%) - Hispanic or Latino
Geographical mobility - Moved from different county within same state (%) - American Indian and Alaska Native
Geographical mobility - Moved from different county within same state (%) - Multirace
Geographical mobility - Moved from different county within same state (%) - Other Race
Geographical mobility - Moved from different state (%)
Geographical mobility - Moved from different state (%) - White
Geographical mobility - Moved from different state (%) - Black or African American
Geographical mobility - Moved from different state (%) - Asian
Geographical mobility - Moved from different state (%) - Hispanic or Latino
Geographical mobility - Moved from different state (%) - American Indian and Alaska Native
Geographical mobility - Moved from different state (%) - Multirace
Geographical mobility - Moved from different state (%) - Other Race
Geographical mobility - Moved from abroad (%)
Geographical mobility - Moved from abroad (%) - White
Geographical mobility - Moved from abroad (%) - Black or African American
Geographical mobility - Moved from abroad (%) - Asian
Geographical mobility - Moved from abroad (%) - Hispanic or Latino
Geographical mobility - Moved from abroad (%) - American Indian and Alaska Native
Geographical mobility - Moved from abroad (%) - Multirace
Geographical mobility - Moved from abroad (%) - Other Race
Place of birth for the foreign-born population - Ireland (%)
Place of birth for the foreign-born population - Denmark (%)
Place of birth for the foreign-born population - Norway (%)
Place of birth for the foreign-born population - Sweden (%)
Place of birth for the foreign-born population - United Kingdom (%)
Place of birth for the foreign-born population - England (%)
Place of birth for the foreign-born population - Scotland (%)
Place of birth for the foreign-born population - Other Northern Europe (%)
Place of birth for the foreign-born population - Austria (%)
Place of birth for the foreign-born population - Belgium (%)
Place of birth for the foreign-born population - France (%)
Place of birth for the foreign-born population - Germany (%)
Place of birth for the foreign-born population - Netherlands (%)
Place of birth for the foreign-born population - Switzerland (%)
Place of birth for the foreign-born population - Other Western Europe (%)
Place of birth for the foreign-born population - Greece (%)
Place of birth for the foreign-born population - Italy (%)
Place of birth for the foreign-born population - Portugal (%)
Place of birth for the foreign-born population - Spain (%)
Place of birth for the foreign-born population - Other Southern Europe (%)
Place of birth for the foreign-born population - Albania (%)
Place of birth for the foreign-born population - Belarus (%)
Place of birth for the foreign-born population - Bosnia and Herzegovina (%)
Place of birth for the foreign-born population - Bulgaria (%)
Place of birth for the foreign-born population - Croatia (%)
Place of birth for the foreign-born population - Czechoslovakia (%)
Place of birth for the foreign-born population - Hungary (%)
Place of birth for the foreign-born population - Latvia (%)
Place of birth for the foreign-born population - Lithuania (%)
Place of birth for the foreign-born population - North Macedonia (Macedonia) (%)
Place of birth for the foreign-born population - Moldova (%)
Place of birth for the foreign-born population - Poland (%)
Place of birth for the foreign-born population - Romania (%)
Place of birth for the foreign-born population - Russia (%)
Place of birth for the foreign-born population - Serbia (%)
Place of birth for the foreign-born population - Ukraine (%)
Place of birth for the foreign-born population - Other Eastern Europe (%)
Place of birth for the foreign-born population - China (%)
Place of birth for the foreign-born population - Hong Kong (%)
Place of birth for the foreign-born population - Taiwan (%)
Place of birth for the foreign-born population - Japan (%)
Place of birth for the foreign-born population - Korea (%)
Place of birth for the foreign-born population - Other Eastern Asia (%)
Place of birth for the foreign-born population - Afghanistan (%)
Place of birth for the foreign-born population - Bangladesh (%)
Place of birth for the foreign-born population - India (%)
Place of birth for the foreign-born population - Iran (%)
Place of birth for the foreign-born population - Kazakhstan (%)
Place of birth for the foreign-born population - Nepal (%)
Place of birth for the foreign-born population - Pakistan (%)
Place of birth for the foreign-born population - Sri Lanka (%)
Place of birth for the foreign-born population - Uzbekistan (%)
Place of birth for the foreign-born population - Other South Central Asia (%)
Place of birth for the foreign-born population - Burma (%)
Place of birth for the foreign-born population - Cambodia (%)
Place of birth for the foreign-born population - Indonesia (%)
Place of birth for the foreign-born population - Laos (%)
Place of birth for the foreign-born population - Malaysia (%)
Place of birth for the foreign-born population - Philippines (%)
Place of birth for the foreign-born population - Singapore (%)
Place of birth for the foreign-born population - Thailand (%)
Place of birth for the foreign-born population - Vietnam (%)
Place of birth for the foreign-born population - Other South Eastern Asia (%)
Place of birth for the foreign-born population - Armenia (%)
Place of birth for the foreign-born population - Iraq (%)
Place of birth for the foreign-born population - Israel (%)
Place of birth for the foreign-born population - Jordan (%)
Place of birth for the foreign-born population - Kuwait (%)
Place of birth for the foreign-born population - Lebanon (%)
Place of birth for the foreign-born population - Saudi Arabia (%)
Place of birth for the foreign-born population - Syria (%)
Place of birth for the foreign-born population - Turkey (%)
Place of birth for the foreign-born population - Yemen (%)
Place of birth for the foreign-born population - Other Western Asia (%)
Place of birth for the foreign-born population - Eritrea (%)
Place of birth for the foreign-born population - Ethiopia (%)
Place of birth for the foreign-born population - Kenya (%)
Place of birth for the foreign-born population - Somalia (%)
Place of birth for the foreign-born population - Uganda (%)
Place of birth for the foreign-born population - Zimbabwe (%)
Place of birth for the foreign-born population - Other Eastern Africa (%)
Place of birth for the foreign-born population - Cameroon (%)
Place of birth for the foreign-born population - Congo (%)
Place of birth for the foreign-born population - Democratic Republic of Congo (Zaire) (%)
Place of birth for the foreign-born population - Other Middle Africa (%)
Place of birth for the foreign-born population - Egypt (%)
Place of birth for the foreign-born population - Morocco (%)
Place of birth for the foreign-born population - Sudan (%)
Place of birth for the foreign-born population - Other Northern Africa (%)
Place of birth for the foreign-born population - South Africa (%)
Place of birth for the foreign-born population - Other Southern Africa (%)
Place of birth for the foreign-born population - Cabo Verde (%)
Place of birth for the foreign-born population - Ghana (%)
Place of birth for the foreign-born population - Liberia (%)
Place of birth for the foreign-born population - Nigeria (%)
Place of birth for the foreign-born population - Senegal (%)
Place of birth for the foreign-born population - Sierra Leone (%)
Place of birth for the foreign-born population - Other Western Africa (%)
Place of birth for the foreign-born population - Australia (%)
Place of birth for the foreign-born population - New Zealand (%)
Place of birth for the foreign-born population - Fiji (%)
Place of birth for the foreign-born population - Micronesia (%)
Place of birth for the foreign-born population - Bahamas (%)
Place of birth for the foreign-born population - Barbados (%)
Place of birth for the foreign-born population - Cuba (%)
Place of birth for the foreign-born population - Dominica (%)
Place of birth for the foreign-born population - Dominican Republic (%)
Place of birth for the foreign-born population - Grenada (%)
Place of birth for the foreign-born population - Haiti (%)
Place of birth for the foreign-born population - Jamaica (%)
Place of birth for the foreign-born population - St. Vincent and the Grenadines (%)
Place of birth for the foreign-born population - Trinidad and Tobago (%)
Place of birth for the foreign-born population - West Indies (%)
Place of birth for the foreign-born population - Other Caribbean (%)
Place of birth for the foreign-born population - Belize (%)
Place of birth for the foreign-born population - Costa Rica (%)
Place of birth for the foreign-born population - El Salvador (%)
Place of birth for the foreign-born population - Guatemala (%)
Place of birth for the foreign-born population - Honduras (%)
Place of birth for the foreign-born population - Mexico (%)
Place of birth for the foreign-born population - Nicaragua (%)
Place of birth for the foreign-born population - Panama (%)
Place of birth for the foreign-born population - Other Central America (%)
Place of birth for the foreign-born population - Argentina (%)
Place of birth for the foreign-born population - Bolivia (%)
Place of birth for the foreign-born population - Brazil (%)
Place of birth for the foreign-born population - Chile (%)
Place of birth for the foreign-born population - Colombia (%)
Place of birth for the foreign-born population - Ecuador (%)
Place of birth for the foreign-born population - Guyana (%)
Place of birth for the foreign-born population - Peru (%)
Place of birth for the foreign-born population - Uruguay (%)
Place of birth for the foreign-born population - Venezuela (%)
Place of birth for the foreign-born population - Other South America (%)
Place of birth for the foreign-born population - Canada (%)
Place of birth for the foreign-born population - Other Northern America (%)
Place of birth for the foreign-born population - Other (%)
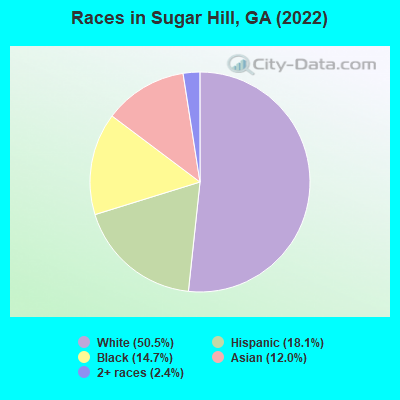
According to 2022 data, the most numerous races in Sugar Hill, GA are White alone (12,814 residents), Black alone (3,731 residents), and Hispanic (4,600 residents). 66.4% of Sugar Hill residents speak English at home. 22.9% of Sugar Hill, GA residents are foreign-born (8.3% born in Latin America, 7.9% born in Asia, 2.8% born in Europe, 2.7% born in Africa), which is 56.4% greater than the foreign-born rate of 10.0% across the entire state of Georgia.
Race distribution in Sugar Hill
2000 2022
5,128,661 62.6% White alone 2,331,465 28.5% Black alone 435,227 5.3% Hispanic 171,513 2.1% Asian alone 87,364 1.1% Two or more races 17,670 0.2% American Indian alone 11,275 0.1% Other race alone 3,278 0.04% Native Hawaiian and Other
5,415,657 49.6% White alone 3,349,240 30.7% Black alone 1,132,604 10.4% Hispanic 479,156 4.4% Asian alone 462,923 4.2% Two or more races 54,416 0.5% Other race alone 11,923 0.1% American Indian alone 6,957 0.06% Native Hawaiian and Other
Income and house value in Sugar Hill Median household income in 2022 $102,664 White non-Hispanic householders$106,280 Black householders$101,787 Asian householders$57,549 Some other race householders$67,986 Two or more races householders$60,692 Hispanic or Latino race householdersMedian 2022 house value $418,460 White Non-Hispanic householders$432,095 Black or African American householders $470,727 Asian householders$507,412 Some other race householders$439,562 Two or more races householders$463,261 Hispanic or Latino householders
Median age by race in Sugar Hill
36.6 Median age for White residents36.5 35.9 40.7 Median age for Black or African American residents42.1 38.7 22.7 Median age for American Indian / Alaska Native residents10.4 -732,307,691.6 41.7 Median age for Asian residents41.8 42.2 -1,080,291,969.7 Median age for Native Hawaiian / Pacific Islander residents-1,248,062,014.3 -776,776,776.0 34.9 Median age for Other race residents34.1 44.8 33.3 Median age for Two or more races residents20.1 35.3 36.0 Median age for White alone residents36.5 34.7 31.2 Median age for Hispanic or Latino residents26.3 36.4
Owner/renter occupied households by race in Sugar Hill
House owners and renters - White residents 4,018 83.2% Owner occupied812 16.8% Renter occupiedHouse owners and renters - Black or African American residents 833 80.3% Owner occupied204 19.7% Renter occupiedHouse owners and renters - American Indian / Alaska Native residents 40 100.0% Renter occupiedHouse owners and renters - Asian residents 1,024 94.1% Owner occupied65 5.9% Renter occupiedHouse owners and renters - Other race residents 255 57.4% Owner occupied189 42.6% Renter occupiedHouse owners and renters - Two or more races residents 647 77.5% Owner occupied188 22.5% Renter occupiedHouse owners and renters - White alone residents 3,858 82.8% Owner occupied801 17.2% Renter occupiedHouse owners and renters - Hispanic or Latino residents 997 71.8% Owner occupied392 28.2% Renter occupied
Language usage in Sugar Hill
English speakers - Total 66.4% of residents of Sugar Hill speak English at home.
15.5% of residents speak Spanish at home 1,496 40.9% Speak English very well2,163 59.1% Speak English less than very well18.0% of residents speak other language at home 2,259 53.1% Speak English very well1,999 46.9% Speak English less than very well
English speakers - Born in the United States 88.2% of residents of Sugar Hill speak English at home.
6.0% of residents speak Spanish at home 202 38.4% Speak English very well324 61.6% Speak English less than very well6.4% of residents speak other language at home 417 73.8% Speak English very well148 26.2% Speak English less than very well
English speakers - Native, born elsewhere 35.4% of residents of Sugar Hill speak English at home.
55.6% of residents speak Spanish at home 124 59.0% Speak English very well86 41.0% Speak English less than very well5.3% of residents speak other language at home 9 45.0% Speak English very well11 55.0% Speak English less than very well
English speakers - Foreign-born 8.9% of residents of Sugar Hill speak English at home.
34.9% of residents speak Spanish at home 636 31.1% Speak English very well1,406 68.9% Speak English less than very well56.5% of residents speak other language at home 1,618 48.9% Speak English very well1,688 51.1% Speak English less than very well
White (Caucasian) - Speak only English Native:
94.3% (10,807)Foreign-born:
22.6% (210)
White (Caucasian) - Speak another language Native:
6.1% (703)Foreign-born:
78.9% (730)
Black or African American - Speak only English Native:
92.4% (2,821)Foreign-born:
1.4% (8)
Black or African American - Speak another language Native:
7.3% (224)Foreign-born:
91.1% (494)
American Indian / Alaska Native - Speak another language Native:
85.3% (105)Foreign-born:
100.0% (193)
Asian - Speak only English Native:
27.8% (189)Foreign-born:
9.4% (207)
Asian - Speak another language Native:
73.4% (499)Foreign-born:
90.4% (2,000)
Other race - Speak another language Native:
99.5% (382)Foreign-born:
99.6% (844)
Two or more races - Speak only English Native:
60.5% (825)Foreign-born:
1.0% (10)
Two or more races - Speak another language Native:
39.0% (531)Foreign-born:
100.0% (982)
White alone - Speak only English Native:
95.6% (10,351)Foreign-born:
22.1% (205)
White alone - Speak another language Native:
4.4% (479)Foreign-born:
76.8% (712)
Hispanic or Latino - Speak only English Native:
40.3% (863)Foreign-born:
1.0% (21)
Hispanic or Latino - Speak another language Native:
61.1% (1,308)Foreign-born:
98.4% (2,066)
Foreign-born residents in Sugar Hill 5,821 residents are foreign born (8.3% Latin America , 7.9% Asia , 2.8% Europe , 2.7% Africa ).
This city:
22.9%Georgia:
10.4%
Marital status for residents in Sugar Hill Marital status - White (Caucasian) population 15 years and over
Males 25.0% Never married66.3% Now married0.2% Separated1.6% Widowed6.8% DivorcedFemales 26.2% Never married57.5% Now married0.9% Separated5.5% Widowed10.0% DivorcedWomen who gave birth in the past 12 months Now married:
100.0% (101)Unmarried:
0.0% (0)
Women who did not give birth in the past 12 months Now married:
59.2% (1,916)Unmarried:
40.8% (1,322)
Marital status - Black or African American population 15 years and over
Males 30.3% Never married57.9% Now married0.0% Separated4.1% Widowed7.7% DivorcedFemales 44.8% Never married34.1% Now married4.4% Separated9.7% Widowed6.8% DivorcedWomen who did not give birth in the past 12 months Now married:
37.9% (593)Unmarried:
62.1% (972)
Marital status - American Indian / Alaska Native population 15 years and over
Males 0.0% Never married100.0% Now married0.0% Separated0.0% Widowed0.0% DivorcedFemales 48.7% Never married51.3% Now married0.0% Separated0.0% Widowed0.0% DivorcedWomen who did not give birth in the past 12 months Now married:
51.3% (62)Unmarried:
48.7% (59)
Marital status - Asian population 15 years and over
Males 23.9% Never married74.9% Now married0.0% Separated1.2% Widowed0.0% DivorcedFemales 15.2% Never married79.7% Now married0.0% Separated0.8% Widowed4.3% DivorcedWomen who gave birth in the past 12 months Now married:
100.0% (19)Unmarried:
0.0% (0)
Women who did not give birth in the past 12 months Now married:
72.1% (556)Unmarried:
27.9% (216)
Marital status - Other race population 15 years and over
Males 41.0% Never married54.7% Now married4.3% Separated0.0% Widowed0.0% DivorcedFemales 28.5% Never married67.6% Now married0.0% Separated0.0% Widowed3.9% DivorcedWomen who did not give birth in the past 12 months Now married:
65.3% (261)Unmarried:
34.7% (139)
Marital status - Two or more races population 15 years and over
Males 42.8% Never married33.1% Now married6.4% Separated0.0% Widowed17.6% DivorcedFemales 46.0% Never married33.1% Now married5.8% Separated2.2% Widowed12.9% DivorcedWomen who gave birth in the past 12 months Now married:
30.6% (19)Unmarried:
69.4% (44)
Women who did not give birth in the past 12 months Now married:
31.9% (188)Unmarried:
68.1% (399)
Marital status - White alone, not Hispanic / Latino population 15 years and over
Males 23.6% Never married66.8% Now married0.3% Separated1.7% Widowed7.6% DivorcedFemales 25.7% Never married58.2% Now married1.0% Separated5.8% Widowed9.3% DivorcedWomen who gave birth in the past 12 months Now married:
100.0% (112)Unmarried:
0.0% (0)
Women who did not give birth in the past 12 months Now married:
59.5% (1,869)Unmarried:
40.5% (1,272)
Marital status - Hispanic or Latino population 15 years and over
Males 41.2% Never married48.8% Now married3.7% Separated0.0% Widowed6.3% DivorcedFemales 36.8% Never married52.3% Now married1.7% Separated2.0% Widowed7.3% DivorcedWomen who gave birth in the past 12 months Now married:
100.0% (16)Unmarried:
0.0% (0)
Women who did not give birth in the past 12 months Now married:
51.8% (659)Unmarried:
48.2% (614)
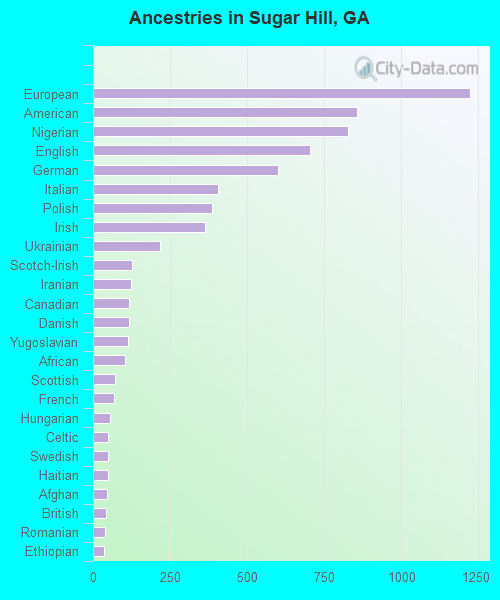
Ancestries in Sugar Hill
1,224 8.9% European856 6.2% American827 6.0% Nigerian705 5.1% English600 4.4% German407 3.0% Italian387 2.8% Polish362 2.6% Irish217 1.6% Ukrainian128 0.9% Scotch-Irish122 0.9% Iranian118 0.9% Canadian116 0.8% Danish112 0.8% Yugoslavian104 0.8% African70 0.5% Scottish67 0.5% French55 0.4% Hungarian49 0.4% Celtic49 0.4% Swedish48 0.3% Haitian44 0.3% Afghan42 0.3% British38 0.3% Romanian37 0.3% Ethiopian31 0.2% Lebanese16 0.1% Finnish15 0.1% Lithuanian13 0.09% Greek13 0.09% French Canadian10 0.07% Palestinian10 0.07% Slovene8 0.06% Zimbabwean7 0.05% Liberian3 0.02% Northern European
Geographical mobility in Sugar Hill Same house 1 year ago 11,975 90.3% White (Caucasian)2,928 79.3% Black or African American300 99.5% American Indian / Alaska Native2,672 88.6% Asian1,160 91.1% Other race2,261 90.1% Two or more races11,531 90.8% White alone, not Hispanic / Latino3,936 86.4% Hispanic or LatinoMoved within same county 676 5.1% White / Caucasian492 13.3% Black or African American156 5.2% Asian19 1.5% Other race62 2.5% Two or more races648 5.1% White alone, not Hispanic / Latino263 5.8% Hispanic or LatinoMoved within same state 418 3.2% White / Caucasian26 0.7% Black or African American114 3.8% Asian86 6.8% Other race35 1.4% Two or more races332 2.6% White alone, not Hispanic / Latino239 5.2% Hispanic or LatinoMoved from different state 160 1.2% White / Caucasian314 8.5% Black or African American6 0.2% Asian2 0.2% Other race28 1.1% Two or more races170 1.3% White alone, not Hispanic / Latino2 0.1% Hispanic or LatinoMoved from abroad 25 0.2% White135 5.4% Two or more races18 0.1% White alone, not Hispanic / Latino151 3.3% Hispanic or Latino
Children Nativity (place of birth) in Sugar Hill
Children under 6 years - Living with two parents Both parents native 999 100.0% Native0 0.0% Foreign-bornBoth parents foreign-born 255 93.7% Native17 6.3% Foreign-bornOne native, one foreign-born parent 38 100.0% NativeChildren under 6 years - Living with one parent Native parent 147 100.0% NativeForeign-born parent 341 100.0% NativeChildren 6 to 17 years - Living with two parents Both parents native 1,908 100.0% NativeBoth parents foreign-born 728 76.0% Native230 24.0% Foreign-bornOne native, one foreign-born parent 498 96.9% Native16 3.1% Foreign-bornChildren 6 to 17 years - Living with one parent Native parent 892 100.0% NativeForeign-born parent 785 50.9% Native758 49.1% Foreign-born
Grandparents responsible for own grandchildren in Sugar Hill
Grandparents (30 to 59 years) White / Caucasian 43 100.0% Not responsible for grandchildrenBlack or African American 18 40.5% Responsible for grandchildren27 59.5% Not responsible for grandchildrenAmerican Indian / Alaska Native 42 100.0% Not responsible for grandchildrenWhite alone, not Hispanic / Latino 46 100.0% Not responsible for grandchildrenHispanic or Latino 48 100.0% Not responsible for grandchildrenGrandparents (60 years and over) White / Caucasian 36 40.6% Responsible for grandchildren53 59.4% Not responsible for grandchildrenBlack or African American 262 100.0% Not responsible for grandchildrenWhite alone, not Hispanic / Latino 36 53.1% Responsible for grandchildren32 46.9% Not responsible for grandchildrenHispanic or Latino 55 100.0% Not responsible for grandchildren