Races in Stickney, Illinois (IL) Detailed Stats
Data:
Races - White alone (%)
Races - White alone (% change since 2000)
Races - Black alone (%)
Races - Black alone (% change since 2000)
Races - American Indian alone (%)
Races - American Indian alone (% change since 2000)
Races - Asian alone (%)
Races - Asian alone (% change since 2000)
Races - Hispanic (%)
Races - Hispanic (% change since 2000)
Races - Native Hawaiian and Other Pacific Islander alone (%)
Races - Native Hawaiian and Other Pacific Islander alone (% change since 2000)
Races - Two or more races(%)
Races - Two or more races(% change since 2000)
Races - Other race alone (%)
Races - Other race alone (% change since 2000)
Racial diversity
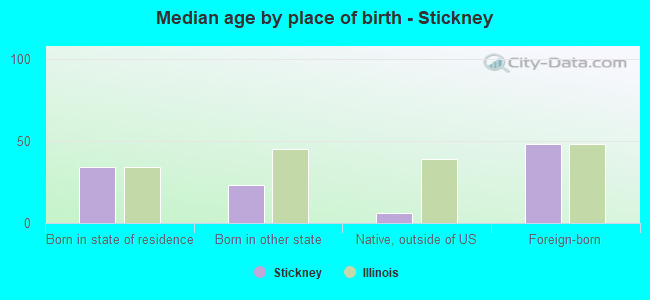
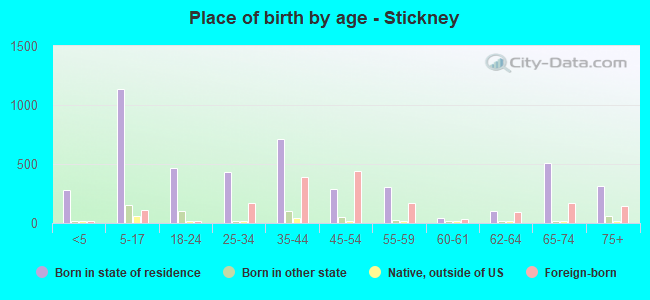
Place of birth - Born in state of residence (%)
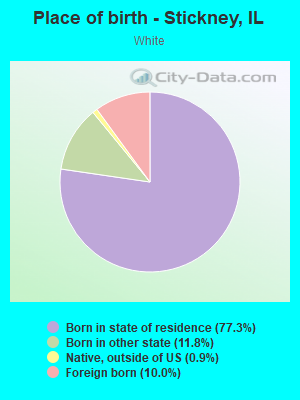
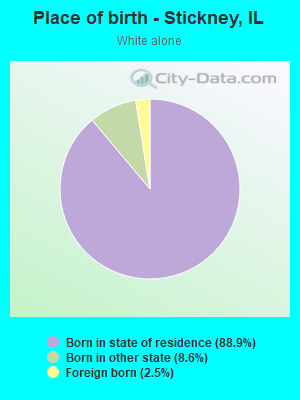
Place of birth - Born in state of residence (%) - White
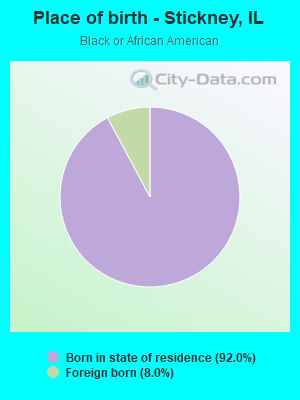
Place of birth - Born in state of residence (%) - Black or African American
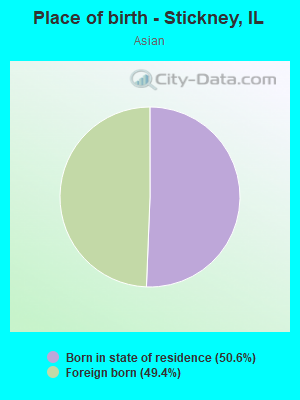
Place of birth - Born in state of residence (%) - Asian
Place of birth - Born in state of residence (%) - Hispanic or Latino
Place of birth - Born in state of residence (%) - American Indian and Alaska Native
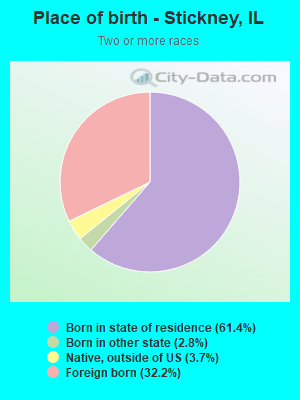
Place of birth - Born in state of residence (%) - Multirace
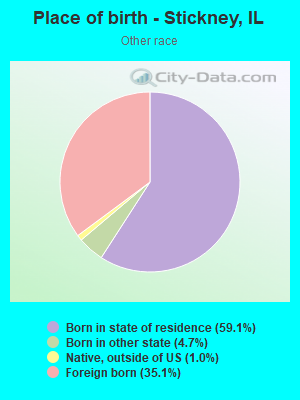
Place of birth - Born in state of residence (%) - Other Race
Place of birth - Born in other state (%)
Place of birth - Born in other state (%) - White
Place of birth - Born in other state (%) - Black or African American
Place of birth - Born in other state (%) - Asian
Place of birth - Born in other state (%) - Hispanic or Latino
Place of birth - Born in other state (%) - American Indian and Alaska Native
Place of birth - Born in other state (%) - Multirace
Place of birth - Born in other state (%) - Other Race
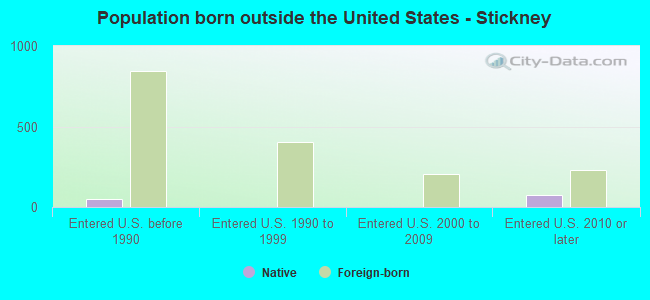
Place of birth - Native, outside of US (%)
Place of birth - Native, outside of US (%) - White
Place of birth - Native, outside of US (%) - Black or African American
Place of birth - Native, outside of US (%) - Asian
Place of birth - Native, outside of US (%) - Hispanic or Latino
Place of birth - Native, outside of US (%) - American Indian and Alaska Native
Place of birth - Native, outside of US (%) - Multirace
Place of birth - Native, outside of US (%) - Other Race
Place of birth - Foreign born (%)
Place of birth - Foreign born (%) - White
Place of birth - Foreign born (%) - Black or African American
Place of birth - Foreign born (%) - Asian
Place of birth - Foreign born (%) - Hispanic or Latino
Place of birth - Foreign born (%) - American Indian and Alaska Native
Place of birth - Foreign born (%) - Multirace
Place of birth - Foreign born (%) - Other Race
Residents speaking English at home (%)
Residents speaking English at home - Born in the United States (%)
Residents speaking English at home - Native, born elsewhere (%)
Residents speaking English at home - Foreign born (%)
Residents speaking Spanish at home (%)
Residents speaking Spanish at home - Born in the United States (%)
Residents speaking Spanish at home - Native, born elsewhere (%)
Residents speaking Spanish at home - Foreign born (%)
Residents speaking other language at home (%)
Residents speaking other language at home - Born in the United States (%)
Residents speaking other language at home - Native, born elsewhere (%)
Residents speaking other language at home - Foreign born (%)
Marital status - Never married (%)
Marital status - Now married (%)
Marital status - Separated (%)
Marital status - Widowed (%)
Marital status - Divorced (%)
Ancestries Reported - Arab (%)
Ancestries Reported - Czech (%)
Ancestries Reported - Danish (%)
Ancestries Reported - Dutch (%)
Ancestries Reported - English (%)
Ancestries Reported - French (%)
Ancestries Reported - French Canadian (%)
Ancestries Reported - German (%)
Ancestries Reported - Greek (%)
Ancestries Reported - Hungarian (%)
Ancestries Reported - Irish (%)
Ancestries Reported - Italian (%)
Ancestries Reported - Lithuanian (%)
Ancestries Reported - Norwegian (%)
Ancestries Reported - Polish (%)
Ancestries Reported - Portuguese (%)
Ancestries Reported - Russian (%)
Ancestries Reported - Scotch-Irish (%)
Ancestries Reported - Scottish (%)
Ancestries Reported - Slovak (%)
Ancestries Reported - Subsaharan African (%)
Ancestries Reported - Swedish (%)
Ancestries Reported - Swiss (%)
Ancestries Reported - Ukrainian (%)
Ancestries Reported - United States (%)
Ancestries Reported - Welsh (%)
Ancestries Reported - West Indian (%)
Ancestries Reported - Other (%)
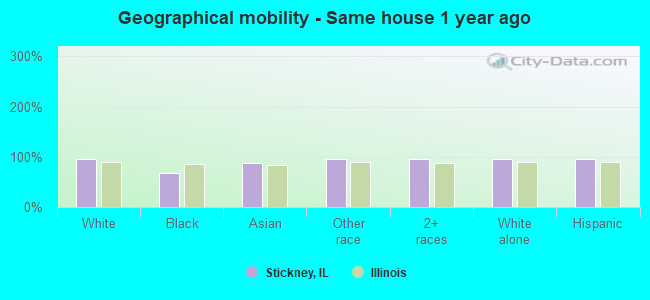
Geographical mobility - Same house 1 year ago (%)
Geographical mobility - Same house 1 year ago (%) - White
Geographical mobility - Same house 1 year ago (%) - Black or African American
Geographical mobility - Same house 1 year ago (%) - Asian
Geographical mobility - Same house 1 year ago (%) - Hispanic or Latino
Geographical mobility - Same house 1 year ago (%) - American Indian and Alaska Native
Geographical mobility - Same house 1 year ago (%) - Multirace
Geographical mobility - Same house 1 year ago (%) - Other Race
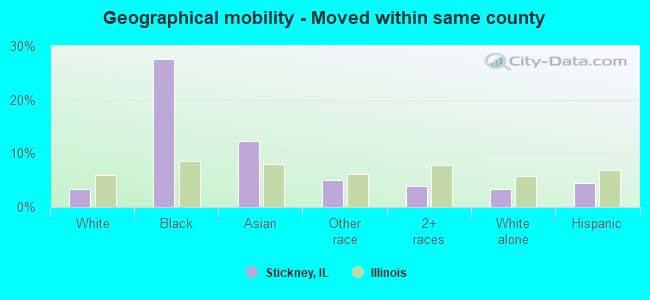
Geographical mobility - Moved within same county (%)
Geographical mobility - Moved within same county (%) - White
Geographical mobility - Moved within same county (%) - Black or African American
Geographical mobility - Moved within same county (%) - Asian
Geographical mobility - Moved within same county (%) - Hispanic or Latino
Geographical mobility - Moved within same county (%) - American Indian and Alaska Native
Geographical mobility - Moved within same county (%) - Multirace
Geographical mobility - Moved within same county (%) - Other Race
Geographical mobility - Moved from different county within same state (%)
Geographical mobility - Moved from different county within same state (%) - White
Geographical mobility - Moved from different county within same state (%) - Black or African American
Geographical mobility - Moved from different county within same state (%) - Asian
Geographical mobility - Moved from different county within same state (%) - Hispanic or Latino
Geographical mobility - Moved from different county within same state (%) - American Indian and Alaska Native
Geographical mobility - Moved from different county within same state (%) - Multirace
Geographical mobility - Moved from different county within same state (%) - Other Race
Geographical mobility - Moved from different state (%)
Geographical mobility - Moved from different state (%) - White
Geographical mobility - Moved from different state (%) - Black or African American
Geographical mobility - Moved from different state (%) - Asian
Geographical mobility - Moved from different state (%) - Hispanic or Latino
Geographical mobility - Moved from different state (%) - American Indian and Alaska Native
Geographical mobility - Moved from different state (%) - Multirace
Geographical mobility - Moved from different state (%) - Other Race
Geographical mobility - Moved from abroad (%)
Geographical mobility - Moved from abroad (%) - White
Geographical mobility - Moved from abroad (%) - Black or African American
Geographical mobility - Moved from abroad (%) - Asian
Geographical mobility - Moved from abroad (%) - Hispanic or Latino
Geographical mobility - Moved from abroad (%) - American Indian and Alaska Native
Geographical mobility - Moved from abroad (%) - Multirace
Geographical mobility - Moved from abroad (%) - Other Race
Place of birth for the foreign-born population - Ireland (%)
Place of birth for the foreign-born population - Denmark (%)
Place of birth for the foreign-born population - Norway (%)
Place of birth for the foreign-born population - Sweden (%)
Place of birth for the foreign-born population - United Kingdom (%)
Place of birth for the foreign-born population - England (%)
Place of birth for the foreign-born population - Scotland (%)
Place of birth for the foreign-born population - Other Northern Europe (%)
Place of birth for the foreign-born population - Austria (%)
Place of birth for the foreign-born population - Belgium (%)
Place of birth for the foreign-born population - France (%)
Place of birth for the foreign-born population - Germany (%)
Place of birth for the foreign-born population - Netherlands (%)
Place of birth for the foreign-born population - Switzerland (%)
Place of birth for the foreign-born population - Other Western Europe (%)
Place of birth for the foreign-born population - Greece (%)
Place of birth for the foreign-born population - Italy (%)
Place of birth for the foreign-born population - Portugal (%)
Place of birth for the foreign-born population - Spain (%)
Place of birth for the foreign-born population - Other Southern Europe (%)
Place of birth for the foreign-born population - Albania (%)
Place of birth for the foreign-born population - Belarus (%)
Place of birth for the foreign-born population - Bosnia and Herzegovina (%)
Place of birth for the foreign-born population - Bulgaria (%)
Place of birth for the foreign-born population - Croatia (%)
Place of birth for the foreign-born population - Czechoslovakia (%)
Place of birth for the foreign-born population - Hungary (%)
Place of birth for the foreign-born population - Latvia (%)
Place of birth for the foreign-born population - Lithuania (%)
Place of birth for the foreign-born population - North Macedonia (Macedonia) (%)
Place of birth for the foreign-born population - Moldova (%)
Place of birth for the foreign-born population - Poland (%)
Place of birth for the foreign-born population - Romania (%)
Place of birth for the foreign-born population - Russia (%)
Place of birth for the foreign-born population - Serbia (%)
Place of birth for the foreign-born population - Ukraine (%)
Place of birth for the foreign-born population - Other Eastern Europe (%)
Place of birth for the foreign-born population - China (%)
Place of birth for the foreign-born population - Hong Kong (%)
Place of birth for the foreign-born population - Taiwan (%)
Place of birth for the foreign-born population - Japan (%)
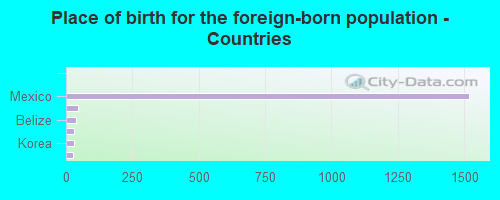
Place of birth for the foreign-born population - Korea (%)
Place of birth for the foreign-born population - Other Eastern Asia (%)
Place of birth for the foreign-born population - Afghanistan (%)
Place of birth for the foreign-born population - Bangladesh (%)
Place of birth for the foreign-born population - India (%)
Place of birth for the foreign-born population - Iran (%)
Place of birth for the foreign-born population - Kazakhstan (%)
Place of birth for the foreign-born population - Nepal (%)
Place of birth for the foreign-born population - Pakistan (%)
Place of birth for the foreign-born population - Sri Lanka (%)
Place of birth for the foreign-born population - Uzbekistan (%)
Place of birth for the foreign-born population - Other South Central Asia (%)
Place of birth for the foreign-born population - Burma (%)
Place of birth for the foreign-born population - Cambodia (%)
Place of birth for the foreign-born population - Indonesia (%)
Place of birth for the foreign-born population - Laos (%)
Place of birth for the foreign-born population - Malaysia (%)
Place of birth for the foreign-born population - Philippines (%)
Place of birth for the foreign-born population - Singapore (%)
Place of birth for the foreign-born population - Thailand (%)
Place of birth for the foreign-born population - Vietnam (%)
Place of birth for the foreign-born population - Other South Eastern Asia (%)
Place of birth for the foreign-born population - Armenia (%)
Place of birth for the foreign-born population - Iraq (%)
Place of birth for the foreign-born population - Israel (%)
Place of birth for the foreign-born population - Jordan (%)
Place of birth for the foreign-born population - Kuwait (%)
Place of birth for the foreign-born population - Lebanon (%)
Place of birth for the foreign-born population - Saudi Arabia (%)
Place of birth for the foreign-born population - Syria (%)
Place of birth for the foreign-born population - Turkey (%)
Place of birth for the foreign-born population - Yemen (%)
Place of birth for the foreign-born population - Other Western Asia (%)
Place of birth for the foreign-born population - Eritrea (%)
Place of birth for the foreign-born population - Ethiopia (%)
Place of birth for the foreign-born population - Kenya (%)
Place of birth for the foreign-born population - Somalia (%)
Place of birth for the foreign-born population - Uganda (%)
Place of birth for the foreign-born population - Zimbabwe (%)
Place of birth for the foreign-born population - Other Eastern Africa (%)
Place of birth for the foreign-born population - Cameroon (%)
Place of birth for the foreign-born population - Congo (%)
Place of birth for the foreign-born population - Democratic Republic of Congo (Zaire) (%)
Place of birth for the foreign-born population - Other Middle Africa (%)
Place of birth for the foreign-born population - Egypt (%)
Place of birth for the foreign-born population - Morocco (%)
Place of birth for the foreign-born population - Sudan (%)
Place of birth for the foreign-born population - Other Northern Africa (%)
Place of birth for the foreign-born population - South Africa (%)
Place of birth for the foreign-born population - Other Southern Africa (%)
Place of birth for the foreign-born population - Cabo Verde (%)
Place of birth for the foreign-born population - Ghana (%)
Place of birth for the foreign-born population - Liberia (%)
Place of birth for the foreign-born population - Nigeria (%)
Place of birth for the foreign-born population - Senegal (%)
Place of birth for the foreign-born population - Sierra Leone (%)
Place of birth for the foreign-born population - Other Western Africa (%)
Place of birth for the foreign-born population - Australia (%)
Place of birth for the foreign-born population - New Zealand (%)
Place of birth for the foreign-born population - Fiji (%)
Place of birth for the foreign-born population - Micronesia (%)
Place of birth for the foreign-born population - Bahamas (%)
Place of birth for the foreign-born population - Barbados (%)
Place of birth for the foreign-born population - Cuba (%)
Place of birth for the foreign-born population - Dominica (%)
Place of birth for the foreign-born population - Dominican Republic (%)
Place of birth for the foreign-born population - Grenada (%)
Place of birth for the foreign-born population - Haiti (%)
Place of birth for the foreign-born population - Jamaica (%)
Place of birth for the foreign-born population - St. Vincent and the Grenadines (%)
Place of birth for the foreign-born population - Trinidad and Tobago (%)
Place of birth for the foreign-born population - West Indies (%)
Place of birth for the foreign-born population - Other Caribbean (%)
Place of birth for the foreign-born population - Belize (%)
Place of birth for the foreign-born population - Costa Rica (%)
Place of birth for the foreign-born population - El Salvador (%)
Place of birth for the foreign-born population - Guatemala (%)
Place of birth for the foreign-born population - Honduras (%)
Place of birth for the foreign-born population - Mexico (%)
Place of birth for the foreign-born population - Nicaragua (%)
Place of birth for the foreign-born population - Panama (%)
Place of birth for the foreign-born population - Other Central America (%)
Place of birth for the foreign-born population - Argentina (%)
Place of birth for the foreign-born population - Bolivia (%)
Place of birth for the foreign-born population - Brazil (%)
Place of birth for the foreign-born population - Chile (%)
Place of birth for the foreign-born population - Colombia (%)
Place of birth for the foreign-born population - Ecuador (%)
Place of birth for the foreign-born population - Guyana (%)
Place of birth for the foreign-born population - Peru (%)
Place of birth for the foreign-born population - Uruguay (%)
Place of birth for the foreign-born population - Venezuela (%)
Place of birth for the foreign-born population - Other South America (%)
Place of birth for the foreign-born population - Canada (%)
Place of birth for the foreign-born population - Other Northern America (%)
Place of birth for the foreign-born population - Other (%)
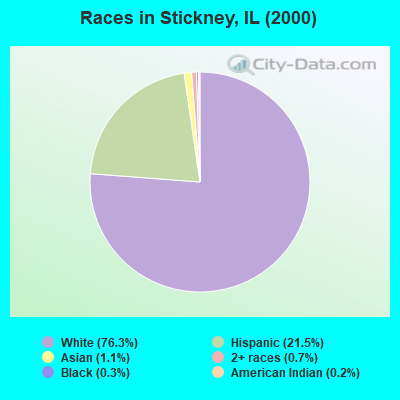
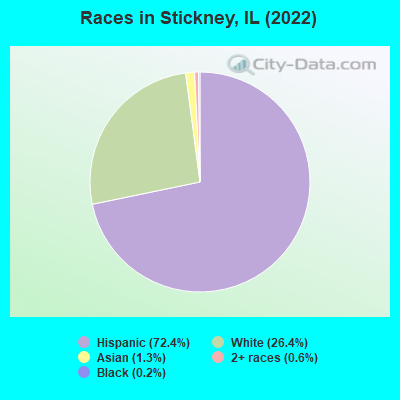
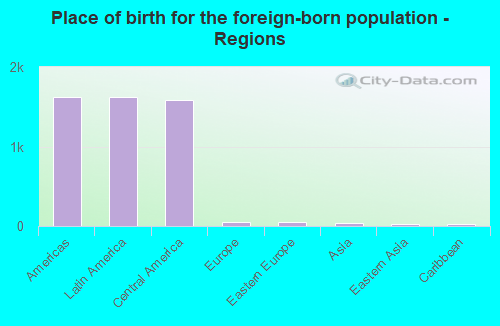
According to 2022 data, the most numerous races in Stickney, IL are White alone (1,817 residents), Hispanic (4,980 residents), and Black alone (11 residents). 39.7% of Stickney residents speak English at home. 24.8% of Stickney, IL residents are foreign-born (23.1% born in Latin America), which is 43.6% greater than the foreign-born rate of 14.0% across the entire state of Illinois.
Race distribution in Stickney
2000 2022
8,424,140 67.8% White alone 1,856,152 14.9% Black alone 1,530,262 12.3% Hispanic 419,916 3.4% Asian alone 153,996 1.2% Two or more races 13,479 0.1% Other race alone 18,232 0.1% American Indian alone 3,116 0.03% Native Hawaiian and Other
7,356,301 58.5% White alone 2,299,726 18.3% Hispanic 1,660,423 13.2% Black alone 747,296 5.9% Asian alone 458,599 3.6% Two or more races 45,386 0.4% Other race alone 10,405 0.08% American Indian alone 3,896 0.03% Native Hawaiian and Other
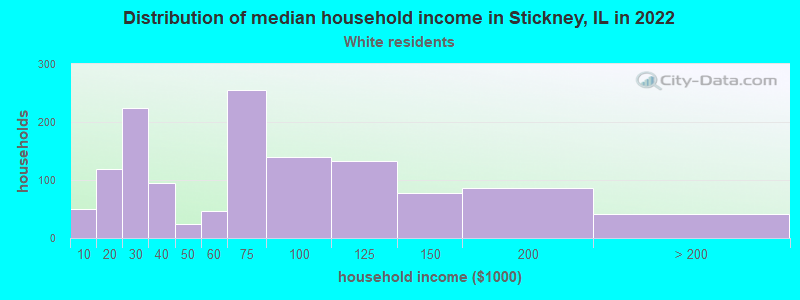
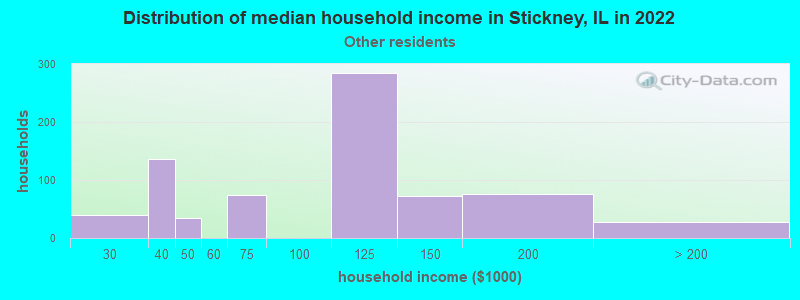
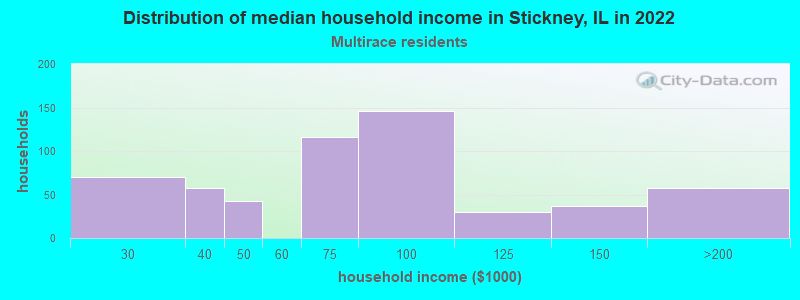
Income and house value in Stickney Median household income in 2022 $60,864 White non-Hispanic householders$113,343 Some other race householders$73,212 Two or more races householders$82,397 Hispanic or Latino race householdersMedian 2022 house value $224,126 White Non-Hispanic householders $369,710 Asian householders$221,333 Some other race householders$228,234 Hispanic or Latino householders
Median age by race in Stickney
56.0 Median age for White residents50.6 57.5 76.1 Median age for Black or African American residents-674,418,604.0 74.1 -680,473,372.1 Median age for American Indian / Alaska Native residents-736,736,736.0 -641,399,416.3 32.3 Median age for Asian residents32.5 23.2 -687,999,999.3 Median age for Native Hawaiian / Pacific Islander residents-918,721,460.3 -610,229,276.3 36.5 Median age for Other race residents37.2 30.4 31.1 Median age for Two or more races residents30.7 32.5 59.3 Median age for White alone residents55.6 69.7 31.2 Median age for Hispanic or Latino residents33.6 30.2
Owner/renter occupied households by race in Stickney
House owners and renters - White residents 1,105 85.3% Owner occupied190 14.7% Renter occupiedHouse owners and renters - Asian residents 13 100.0% Owner occupiedHouse owners and renters - Other race residents 763 100.0% Owner occupiedHouse owners and renters - Two or more races residents 436 76.2% Owner occupied136 23.8% Renter occupiedHouse owners and renters - White alone residents 1,016 86.4% Owner occupied160 13.6% Renter occupiedHouse owners and renters - Hispanic or Latino residents 1,148 88.9% Owner occupied143 11.1% Renter occupied
Language usage in Stickney
English speakers - Total 39.7% of residents of Stickney speak English at home.
59.0% of residents speak Spanish at home 2,643 68.0% Speak English very well1,245 32.0% Speak English less than very well1.3% of residents speak other language at home 64 71.9% Speak English very well25 28.1% Speak English less than very well
English speakers - Born in the United States 49.5% of residents of Stickney speak English at home.
47.0% of residents speak Spanish at home 224 100.0% Speak English very well0.6% of residents speak other language at home 3 100.0% Speak English very well
English speakers - Native, born elsewhere 20.8% of residents of Stickney speak English at home.
82.1% of residents speak Spanish at home 87 100.0% Speak English very well
English speakers - Foreign-born 4.2% of residents of Stickney speak English at home.
93.3% of residents speak Spanish at home 762 47.9% Speak English very well830 52.1% Speak English less than very well3.3% of residents speak other language at home 32 56.1% Speak English very well25 43.9% Speak English less than very well
White (Caucasian) - Speak another language Native:
14.6% (335)Foreign-born:
98.9% (247)
Asian - Speak only English Native:
100.0% (45)Foreign-born:
65.4% (28)
Other race - Speak only English Native:
17.6% (329)Foreign-born:
4.5% (48)
Other race - Speak another language Native:
81.8% (1,527)Foreign-born:
95.5% (1,021)
Two or more races - Speak another language Native:
72.2% (750)Foreign-born:
100.0% (616)
White alone - Speak another language Native:
1.8% (32)Foreign-born:
100.0% (46)
Hispanic or Latino - Speak only English Native:
25.3% (783)Foreign-born:
2.6% (41)
Hispanic or Latino - Speak another language Native:
74.2% (2,298)Foreign-born:
97.6% (1,559)
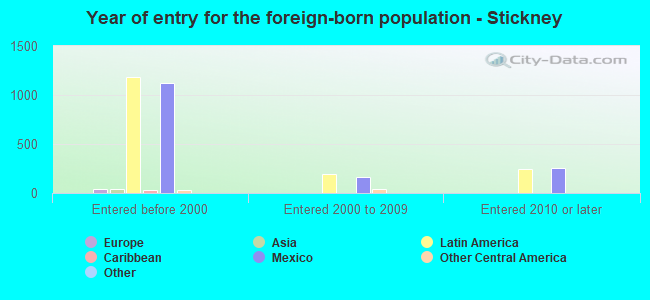
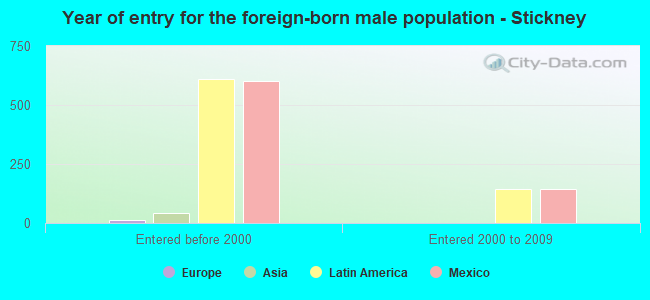
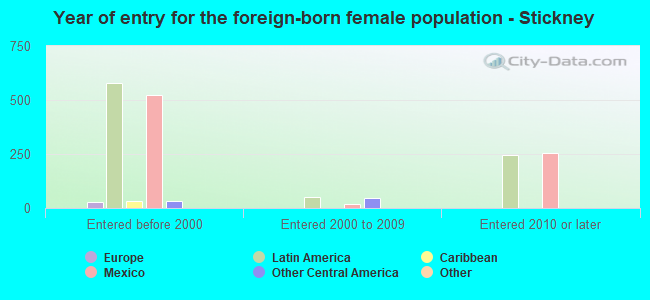
Foreign-born residents in Stickney 1,706 residents are foreign born (23.1% Latin America ).
This city:
24.8%Illinois:
14.1%
Marital status for residents in Stickney Marital status - White (Caucasian) population 15 years and over
Males 46.8% Never married33.7% Now married4.9% Separated0.2% Widowed14.4% DivorcedFemales 34.7% Never married34.8% Now married6.3% Separated19.3% Widowed5.0% DivorcedWomen who gave birth in the past 12 months Now married:
100.0% (22)Unmarried:
0.0% (0)
Women who did not give birth in the past 12 months Now married:
30.6% (136)Unmarried:
69.4% (308)
Marital status - Black or African American population 15 years and over
Males 0.0% Never married50.0% Now married50.0% Separated0.0% Widowed0.0% DivorcedFemales 50.0% Never married0.0% Now married50.0% Separated0.0% Widowed0.0% DivorcedWomen who gave birth in the past 12 months Now married:
0.0% (0)Unmarried:
94.4% (1)
Women who did not give birth in the past 12 months Now married:
0.0% (0)Unmarried:
94.4% (1)
Marital status - Asian population 15 years and over
Males 79.2% Never married20.8% Now married0.0% Separated0.0% Widowed0.0% DivorcedFemales 62.5% Never married37.5% Now married0.0% Separated0.0% Widowed0.0% DivorcedWomen who did not give birth in the past 12 months Now married:
0.0% (0)Unmarried:
100.0% (20)
Marital status - Other race population 15 years and over
Males 21.7% Never married67.8% Now married0.0% Separated5.9% Widowed4.7% DivorcedFemales 19.4% Never married70.4% Now married7.1% Separated0.0% Widowed3.1% DivorcedWomen who did not give birth in the past 12 months Now married:
73.0% (433)Unmarried:
27.0% (160)
Marital status - Two or more races population 15 years and over
Males 35.3% Never married55.7% Now married3.4% Separated5.6% Widowed0.0% DivorcedFemales 28.0% Never married52.2% Now married7.2% Separated3.4% Widowed9.2% DivorcedWomen who gave birth in the past 12 months Now married:
100.0% (103)Unmarried:
0.0% (0)
Women who did not give birth in the past 12 months Now married:
56.0% (221)Unmarried:
44.0% (173)
Marital status - White alone, not Hispanic / Latino population 15 years and over
Males 38.7% Never married35.7% Now married6.9% Separated0.3% Widowed18.4% DivorcedFemales 20.6% Never married39.7% Now married0.0% Separated31.5% Widowed8.2% DivorcedWomen who gave birth in the past 12 months Now married:
100.0% (25)Unmarried:
0.0% (0)
Women who did not give birth in the past 12 months Now married:
54.3% (54)Unmarried:
45.7% (46)
Marital status - Hispanic or Latino population 15 years and over
Males 34.8% Never married56.4% Now married1.0% Separated4.6% Widowed3.2% DivorcedFemales 34.3% Never married50.8% Now married10.2% Separated0.9% Widowed3.8% DivorcedWomen who gave birth in the past 12 months Now married:
100.0% (74)Unmarried:
0.0% (0)
Women who did not give birth in the past 12 months Now married:
51.1% (606)Unmarried:
48.9% (581)
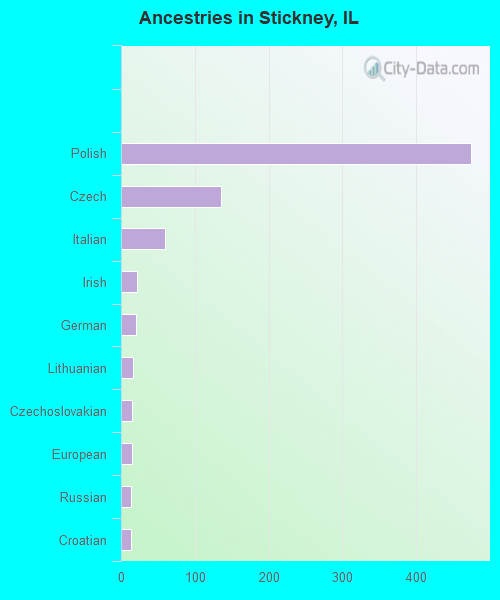
Ancestries in Stickney
475 12.4% Polish136 3.5% Czech59 1.5% Italian22 0.6% Irish21 0.5% German16 0.4% Lithuanian15 0.4% Czechoslovakian15 0.4% European14 0.4% Russian13 0.3% Croatian1 0.03% Greek
Children Nativity (place of birth) in Stickney
Children under 6 years - Living with two parents Both parents native 25 100.0% NativeBoth parents foreign-born 75 67.6% Native36 32.4% Foreign-bornOne native, one foreign-born parent 178 100.0% NativeChildren under 6 years - Living with one parent Native parent 21 100.0% NativeChildren 6 to 17 years - Living with two parents Both parents native 281 100.0% NativeBoth parents foreign-born 144 78.5% Native40 21.5% Foreign-bornOne native, one foreign-born parent 229 100.0% NativeChildren 6 to 17 years - Living with one parent Native parent 358 100.0% NativeForeign-born parent 286 50.1% Native285 49.9% Foreign-born
Grandparents responsible for own grandchildren in Stickney
Grandparents (30 to 59 years) White / Caucasian 17 100.0% Not responsible for grandchildrenOther race 40 43.7% Responsible for grandchildren51 56.3% Not responsible for grandchildrenHispanic or Latino 27 28.1% Responsible for grandchildren68 71.9% Not responsible for grandchildren
Grandparents (60 years and over) White / Caucasian 14 100.0% Responsible for grandchildrenOther race 163 100.0% Not responsible for grandchildrenHispanic or Latino 195 100.0% Not responsible for grandchildren