Races in St. Stephens, North Carolina (NC) Detailed Stats
Data:
Races - White alone (%)
Races - White alone (% change since 2000)
Races - Black alone (%)
Races - Black alone (% change since 2000)
Races - American Indian alone (%)
Races - American Indian alone (% change since 2000)
Races - Asian alone (%)
Races - Asian alone (% change since 2000)
Races - Hispanic (%)
Races - Hispanic (% change since 2000)
Races - Native Hawaiian and Other Pacific Islander alone (%)
Races - Native Hawaiian and Other Pacific Islander alone (% change since 2000)
Races - Two or more races(%)
Races - Two or more races(% change since 2000)
Races - Other race alone (%)
Races - Other race alone (% change since 2000)
Racial diversity
Place of birth - Born in state of residence (%)
Place of birth - Born in state of residence (%) - White
Place of birth - Born in state of residence (%) - Black or African American
Place of birth - Born in state of residence (%) - Asian
Place of birth - Born in state of residence (%) - Hispanic or Latino
Place of birth - Born in state of residence (%) - American Indian and Alaska Native
Place of birth - Born in state of residence (%) - Multirace
Place of birth - Born in state of residence (%) - Other Race
Place of birth - Born in other state (%)
Place of birth - Born in other state (%) - White
Place of birth - Born in other state (%) - Black or African American
Place of birth - Born in other state (%) - Asian
Place of birth - Born in other state (%) - Hispanic or Latino
Place of birth - Born in other state (%) - American Indian and Alaska Native
Place of birth - Born in other state (%) - Multirace
Place of birth - Born in other state (%) - Other Race
Place of birth - Native, outside of US (%)
Place of birth - Native, outside of US (%) - White
Place of birth - Native, outside of US (%) - Black or African American
Place of birth - Native, outside of US (%) - Asian
Place of birth - Native, outside of US (%) - Hispanic or Latino
Place of birth - Native, outside of US (%) - American Indian and Alaska Native
Place of birth - Native, outside of US (%) - Multirace
Place of birth - Native, outside of US (%) - Other Race
Place of birth - Foreign born (%)
Place of birth - Foreign born (%) - White
Place of birth - Foreign born (%) - Black or African American
Place of birth - Foreign born (%) - Asian
Place of birth - Foreign born (%) - Hispanic or Latino
Place of birth - Foreign born (%) - American Indian and Alaska Native
Place of birth - Foreign born (%) - Multirace
Place of birth - Foreign born (%) - Other Race
Residents speaking English at home (%)
Residents speaking English at home - Born in the United States (%)
Residents speaking English at home - Native, born elsewhere (%)
Residents speaking English at home - Foreign born (%)
Residents speaking Spanish at home (%)
Residents speaking Spanish at home - Born in the United States (%)
Residents speaking Spanish at home - Native, born elsewhere (%)
Residents speaking Spanish at home - Foreign born (%)
Residents speaking other language at home (%)
Residents speaking other language at home - Born in the United States (%)
Residents speaking other language at home - Native, born elsewhere (%)
Residents speaking other language at home - Foreign born (%)
Marital status - Never married (%)
Marital status - Now married (%)
Marital status - Separated (%)
Marital status - Widowed (%)
Marital status - Divorced (%)
Ancestries Reported - Arab (%)
Ancestries Reported - Czech (%)
Ancestries Reported - Danish (%)
Ancestries Reported - Dutch (%)
Ancestries Reported - English (%)
Ancestries Reported - French (%)
Ancestries Reported - French Canadian (%)
Ancestries Reported - German (%)
Ancestries Reported - Greek (%)
Ancestries Reported - Hungarian (%)
Ancestries Reported - Irish (%)
Ancestries Reported - Italian (%)
Ancestries Reported - Lithuanian (%)
Ancestries Reported - Norwegian (%)
Ancestries Reported - Polish (%)
Ancestries Reported - Portuguese (%)
Ancestries Reported - Russian (%)
Ancestries Reported - Scotch-Irish (%)
Ancestries Reported - Scottish (%)
Ancestries Reported - Slovak (%)
Ancestries Reported - Subsaharan African (%)
Ancestries Reported - Swedish (%)
Ancestries Reported - Swiss (%)
Ancestries Reported - Ukrainian (%)
Ancestries Reported - United States (%)
Ancestries Reported - Welsh (%)
Ancestries Reported - West Indian (%)
Ancestries Reported - Other (%)
Geographical mobility - Same house 1 year ago (%)
Geographical mobility - Same house 1 year ago (%) - White
Geographical mobility - Same house 1 year ago (%) - Black or African American
Geographical mobility - Same house 1 year ago (%) - Asian
Geographical mobility - Same house 1 year ago (%) - Hispanic or Latino
Geographical mobility - Same house 1 year ago (%) - American Indian and Alaska Native
Geographical mobility - Same house 1 year ago (%) - Multirace
Geographical mobility - Same house 1 year ago (%) - Other Race
Geographical mobility - Moved within same county (%)
Geographical mobility - Moved within same county (%) - White
Geographical mobility - Moved within same county (%) - Black or African American
Geographical mobility - Moved within same county (%) - Asian
Geographical mobility - Moved within same county (%) - Hispanic or Latino
Geographical mobility - Moved within same county (%) - American Indian and Alaska Native
Geographical mobility - Moved within same county (%) - Multirace
Geographical mobility - Moved within same county (%) - Other Race
Geographical mobility - Moved from different county within same state (%)
Geographical mobility - Moved from different county within same state (%) - White
Geographical mobility - Moved from different county within same state (%) - Black or African American
Geographical mobility - Moved from different county within same state (%) - Asian
Geographical mobility - Moved from different county within same state (%) - Hispanic or Latino
Geographical mobility - Moved from different county within same state (%) - American Indian and Alaska Native
Geographical mobility - Moved from different county within same state (%) - Multirace
Geographical mobility - Moved from different county within same state (%) - Other Race
Geographical mobility - Moved from different state (%)
Geographical mobility - Moved from different state (%) - White
Geographical mobility - Moved from different state (%) - Black or African American
Geographical mobility - Moved from different state (%) - Asian
Geographical mobility - Moved from different state (%) - Hispanic or Latino
Geographical mobility - Moved from different state (%) - American Indian and Alaska Native
Geographical mobility - Moved from different state (%) - Multirace
Geographical mobility - Moved from different state (%) - Other Race
Geographical mobility - Moved from abroad (%)
Geographical mobility - Moved from abroad (%) - White
Geographical mobility - Moved from abroad (%) - Black or African American
Geographical mobility - Moved from abroad (%) - Asian
Geographical mobility - Moved from abroad (%) - Hispanic or Latino
Geographical mobility - Moved from abroad (%) - American Indian and Alaska Native
Geographical mobility - Moved from abroad (%) - Multirace
Geographical mobility - Moved from abroad (%) - Other Race
Place of birth for the foreign-born population - Ireland (%)
Place of birth for the foreign-born population - Denmark (%)
Place of birth for the foreign-born population - Norway (%)
Place of birth for the foreign-born population - Sweden (%)
Place of birth for the foreign-born population - United Kingdom (%)
Place of birth for the foreign-born population - England (%)
Place of birth for the foreign-born population - Scotland (%)
Place of birth for the foreign-born population - Other Northern Europe (%)
Place of birth for the foreign-born population - Austria (%)
Place of birth for the foreign-born population - Belgium (%)
Place of birth for the foreign-born population - France (%)
Place of birth for the foreign-born population - Germany (%)
Place of birth for the foreign-born population - Netherlands (%)
Place of birth for the foreign-born population - Switzerland (%)
Place of birth for the foreign-born population - Other Western Europe (%)
Place of birth for the foreign-born population - Greece (%)
Place of birth for the foreign-born population - Italy (%)
Place of birth for the foreign-born population - Portugal (%)
Place of birth for the foreign-born population - Spain (%)
Place of birth for the foreign-born population - Other Southern Europe (%)
Place of birth for the foreign-born population - Albania (%)
Place of birth for the foreign-born population - Belarus (%)
Place of birth for the foreign-born population - Bosnia and Herzegovina (%)
Place of birth for the foreign-born population - Bulgaria (%)
Place of birth for the foreign-born population - Croatia (%)
Place of birth for the foreign-born population - Czechoslovakia (%)
Place of birth for the foreign-born population - Hungary (%)
Place of birth for the foreign-born population - Latvia (%)
Place of birth for the foreign-born population - Lithuania (%)
Place of birth for the foreign-born population - North Macedonia (Macedonia) (%)
Place of birth for the foreign-born population - Moldova (%)
Place of birth for the foreign-born population - Poland (%)
Place of birth for the foreign-born population - Romania (%)
Place of birth for the foreign-born population - Russia (%)
Place of birth for the foreign-born population - Serbia (%)
Place of birth for the foreign-born population - Ukraine (%)
Place of birth for the foreign-born population - Other Eastern Europe (%)
Place of birth for the foreign-born population - China (%)
Place of birth for the foreign-born population - Hong Kong (%)
Place of birth for the foreign-born population - Taiwan (%)
Place of birth for the foreign-born population - Japan (%)
Place of birth for the foreign-born population - Korea (%)
Place of birth for the foreign-born population - Other Eastern Asia (%)
Place of birth for the foreign-born population - Afghanistan (%)
Place of birth for the foreign-born population - Bangladesh (%)
Place of birth for the foreign-born population - India (%)
Place of birth for the foreign-born population - Iran (%)
Place of birth for the foreign-born population - Kazakhstan (%)
Place of birth for the foreign-born population - Nepal (%)
Place of birth for the foreign-born population - Pakistan (%)
Place of birth for the foreign-born population - Sri Lanka (%)
Place of birth for the foreign-born population - Uzbekistan (%)
Place of birth for the foreign-born population - Other South Central Asia (%)
Place of birth for the foreign-born population - Burma (%)
Place of birth for the foreign-born population - Cambodia (%)
Place of birth for the foreign-born population - Indonesia (%)
Place of birth for the foreign-born population - Laos (%)
Place of birth for the foreign-born population - Malaysia (%)
Place of birth for the foreign-born population - Philippines (%)
Place of birth for the foreign-born population - Singapore (%)
Place of birth for the foreign-born population - Thailand (%)
Place of birth for the foreign-born population - Vietnam (%)
Place of birth for the foreign-born population - Other South Eastern Asia (%)
Place of birth for the foreign-born population - Armenia (%)
Place of birth for the foreign-born population - Iraq (%)
Place of birth for the foreign-born population - Israel (%)
Place of birth for the foreign-born population - Jordan (%)
Place of birth for the foreign-born population - Kuwait (%)
Place of birth for the foreign-born population - Lebanon (%)
Place of birth for the foreign-born population - Saudi Arabia (%)
Place of birth for the foreign-born population - Syria (%)
Place of birth for the foreign-born population - Turkey (%)
Place of birth for the foreign-born population - Yemen (%)
Place of birth for the foreign-born population - Other Western Asia (%)
Place of birth for the foreign-born population - Eritrea (%)
Place of birth for the foreign-born population - Ethiopia (%)
Place of birth for the foreign-born population - Kenya (%)
Place of birth for the foreign-born population - Somalia (%)
Place of birth for the foreign-born population - Uganda (%)
Place of birth for the foreign-born population - Zimbabwe (%)
Place of birth for the foreign-born population - Other Eastern Africa (%)
Place of birth for the foreign-born population - Cameroon (%)
Place of birth for the foreign-born population - Congo (%)
Place of birth for the foreign-born population - Democratic Republic of Congo (Zaire) (%)
Place of birth for the foreign-born population - Other Middle Africa (%)
Place of birth for the foreign-born population - Egypt (%)
Place of birth for the foreign-born population - Morocco (%)
Place of birth for the foreign-born population - Sudan (%)
Place of birth for the foreign-born population - Other Northern Africa (%)
Place of birth for the foreign-born population - South Africa (%)
Place of birth for the foreign-born population - Other Southern Africa (%)
Place of birth for the foreign-born population - Cabo Verde (%)
Place of birth for the foreign-born population - Ghana (%)
Place of birth for the foreign-born population - Liberia (%)
Place of birth for the foreign-born population - Nigeria (%)
Place of birth for the foreign-born population - Senegal (%)
Place of birth for the foreign-born population - Sierra Leone (%)
Place of birth for the foreign-born population - Other Western Africa (%)
Place of birth for the foreign-born population - Australia (%)
Place of birth for the foreign-born population - New Zealand (%)
Place of birth for the foreign-born population - Fiji (%)
Place of birth for the foreign-born population - Micronesia (%)
Place of birth for the foreign-born population - Bahamas (%)
Place of birth for the foreign-born population - Barbados (%)
Place of birth for the foreign-born population - Cuba (%)
Place of birth for the foreign-born population - Dominica (%)
Place of birth for the foreign-born population - Dominican Republic (%)
Place of birth for the foreign-born population - Grenada (%)
Place of birth for the foreign-born population - Haiti (%)
Place of birth for the foreign-born population - Jamaica (%)
Place of birth for the foreign-born population - St. Vincent and the Grenadines (%)
Place of birth for the foreign-born population - Trinidad and Tobago (%)
Place of birth for the foreign-born population - West Indies (%)
Place of birth for the foreign-born population - Other Caribbean (%)
Place of birth for the foreign-born population - Belize (%)
Place of birth for the foreign-born population - Costa Rica (%)
Place of birth for the foreign-born population - El Salvador (%)
Place of birth for the foreign-born population - Guatemala (%)
Place of birth for the foreign-born population - Honduras (%)
Place of birth for the foreign-born population - Mexico (%)
Place of birth for the foreign-born population - Nicaragua (%)
Place of birth for the foreign-born population - Panama (%)
Place of birth for the foreign-born population - Other Central America (%)
Place of birth for the foreign-born population - Argentina (%)
Place of birth for the foreign-born population - Bolivia (%)
Place of birth for the foreign-born population - Brazil (%)
Place of birth for the foreign-born population - Chile (%)
Place of birth for the foreign-born population - Colombia (%)
Place of birth for the foreign-born population - Ecuador (%)
Place of birth for the foreign-born population - Guyana (%)
Place of birth for the foreign-born population - Peru (%)
Place of birth for the foreign-born population - Uruguay (%)
Place of birth for the foreign-born population - Venezuela (%)
Place of birth for the foreign-born population - Other South America (%)
Place of birth for the foreign-born population - Canada (%)
Place of birth for the foreign-born population - Other Northern America (%)
Place of birth for the foreign-born population - Other (%)
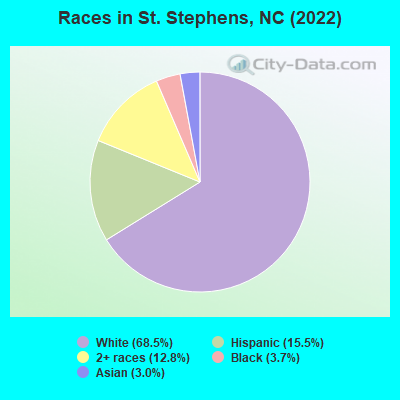
According to 2022 data, the most numerous races in St. Stephens, NC are White alone (6,688 residents), Black alone (357 residents), and Hispanic (1,516 residents). 77.3% of St. Stephens residents speak English at home. 12.5% of St. Stephens, NC residents are foreign-born (7.0% born in Latin America, 4.9% born in Asia), which is 35.8% greater than the foreign-born rate of 8.0% across the entire state of North Carolina.
Race distribution in St. Stephens
2000 2022
5,647,155 70.2% White alone 1,723,301 21.4% Black alone 378,963 4.7% Hispanic 112,416 1.4% Asian alone 95,333 1.2% American Indian alone 79,965 1.0% Two or more races 9,015 0.1% Other race alone 3,165 0.04% Native Hawaiian and Other
6,497,519 60.7% White alone 2,155,650 20.1% Black alone 1,114,799 10.4% Hispanic 438,061 4.1% Two or more races 341,052 3.2% Asian alone 91,758 0.9% American Indian alone 50,180 0.5% Other race alone 9,954 0.09% Native Hawaiian and Other
Income and house value in St. Stephens Median household income in 2022 $68,295 White non-Hispanic householders$59,720 Black householders$80,910 Asian householders$112,013 Some other race householders$12,344 Two or more races householders$35,272 Hispanic or Latino race householdersMedian 2022 house value $217,349 White Non-Hispanic householders$179,540 Black or African American householders $343,238 Asian householders$308,808 Some other race householders$158,417 Two or more races householders$270,154 Hispanic or Latino householders
Median age by race in St. Stephens
46.0 Median age for White residents44.7 49.3 23.0 Median age for Black or African American residents8.6 35.4 -375,111,110.7 Median age for American Indian / Alaska Native residents-434,523,809.1 -682,971,013.8 23.1 Median age for Asian residents20.9 40.6 -666,666,666.0 Median age for Native Hawaiian / Pacific Islander residents-666,666,666.0 -666,666,666.0 49.2 Median age for Other race residents36.4 54.4 21.1 Median age for Two or more races residents15.4 39.6 47.9 Median age for White alone residents44.8 49.8 28.3 Median age for Hispanic or Latino residents29.6 31.2
Owner/renter occupied households by race in St. Stephens
House owners and renters - White residents 2,827 86.3% Owner occupied449 13.7% Renter occupiedHouse owners and renters - Black or African American residents 23 18.0% Owner occupied107 82.0% Renter occupiedHouse owners and renters - American Indian / Alaska Native residents 28 100.0% Owner occupiedHouse owners and renters - Asian residents 55 84.0% Owner occupied11 16.0% Renter occupiedHouse owners and renters - Other race residents 157 73.9% Owner occupied56 26.1% Renter occupiedHouse owners and renters - Two or more races residents 399 68.2% Owner occupied186 31.8% Renter occupiedHouse owners and renters - White alone residents 2,787 88.5% Owner occupied363 11.5% Renter occupiedHouse owners and renters - Hispanic or Latino residents 314 55.4% Owner occupied253 44.6% Renter occupied
Language usage in St. Stephens
English speakers - Total 77.3% of residents of St. Stephens speak English at home.
13.2% of residents speak Spanish at home 698 57.2% Speak English very well523 42.8% Speak English less than very well9.8% of residents speak other language at home 446 49.1% Speak English very well462 50.9% Speak English less than very well
English speakers - Born in the United States 90.1% of residents of St. Stephens speak English at home.
6.5% of residents speak Spanish at home 124 84.9% Speak English very well22 15.1% Speak English less than very well2.0% of residents speak other language at home 45 100.0% Speak English less than very well
English speakers - Native, born elsewhere 69.2% of residents of St. Stephens speak English at home.
123.1% of residents speak Spanish at home 16 100.0% Speak English very well
English speakers - Foreign-born 0.8% of residents of St. Stephens speak English at home.
50.0% of residents speak Spanish at home 254 42.4% Speak English very well345 57.6% Speak English less than very well52.4% of residents speak other language at home 335 53.4% Speak English very well292 46.6% Speak English less than very well
White (Caucasian) - Speak only English Native:
97.0% (6,374)Foreign-born:
3.5% (6)
White (Caucasian) - Speak another language Native:
2.8% (184)Foreign-born:
100.0% (171)
Asian - Speak another language Native:
67.3% (141)Foreign-born:
93.6% (90)
Other race - Speak another language Native:
90.4% (182)Foreign-born:
100.0% (265)
Two or more races - Speak another language Native:
76.1% (638)Foreign-born:
94.3% (985)
White alone - Speak only English Native:
99.8% (6,353)Foreign-born:
57.6% (6)
White alone - Speak another language Native:
0.4% (29)Foreign-born:
24.1% (2)
Hispanic or Latino - Speak another language Native:
89.9% (632)Foreign-born:
98.1% (657)
Foreign-born residents in St. Stephens 1,218 residents are foreign born (7.0% Latin America , 4.9% Asia ).
This city:
12.5%North Carolina:
8.3%
Marital status for residents in St. Stephens Marital status - White (Caucasian) population 15 years and over
Males 31.1% Never married55.9% Now married1.5% Separated3.3% Widowed8.2% DivorcedFemales 16.2% Never married55.7% Now married3.3% Separated12.8% Widowed12.0% DivorcedWomen who gave birth in the past 12 months Now married:
100.0% (97)Unmarried:
0.0% (0)
Women who did not give birth in the past 12 months Now married:
56.8% (727)Unmarried:
43.2% (553)
Marital status - Black or African American population 15 years and over
Males 43.3% Never married53.0% Now married3.7% Separated0.0% Widowed0.0% DivorcedFemales 68.2% Never married26.2% Now married0.0% Separated0.0% Widowed5.6% DivorcedWomen who did not give birth in the past 12 months Now married:
5.2% (4)Unmarried:
94.8% (73)
Marital status - Asian population 15 years and over
Males 55.5% Never married38.7% Now married0.0% Separated0.0% Widowed5.8% DivorcedFemales 40.0% Never married36.4% Now married0.0% Separated18.6% Widowed5.0% DivorcedWomen who did not give birth in the past 12 months Now married:
38.1% (45)Unmarried:
61.9% (73)
Marital status - Other race population 15 years and over
Males 36.2% Never married63.8% Now married0.0% Separated0.0% Widowed0.0% DivorcedFemales 34.7% Never married65.3% Now married0.0% Separated0.0% Widowed0.0% DivorcedWomen who did not give birth in the past 12 months Now married:
72.4% (86)Unmarried:
27.6% (33)
Marital status - Two or more races population 15 years and over
Males 28.5% Never married69.4% Now married0.0% Separated0.0% Widowed2.1% DivorcedFemales 36.4% Never married54.3% Now married9.4% Separated0.0% Widowed0.0% DivorcedWomen who did not give birth in the past 12 months Now married:
56.2% (218)Unmarried:
43.8% (170)
Marital status - White alone, not Hispanic / Latino population 15 years and over
Males 29.7% Never married56.5% Now married1.6% Separated3.5% Widowed8.7% DivorcedFemales 13.7% Never married56.6% Now married3.5% Separated13.5% Widowed12.7% DivorcedWomen who gave birth in the past 12 months Now married:
100.0% (59)Unmarried:
0.0% (0)
Women who did not give birth in the past 12 months Now married:
60.4% (713)Unmarried:
39.6% (467)
Marital status - Hispanic or Latino population 15 years and over
Males 44.0% Never married56.0% Now married0.0% Separated0.0% Widowed0.0% DivorcedFemales 39.3% Never married53.7% Now married7.0% Separated0.0% Widowed0.0% DivorcedWomen who gave birth in the past 12 months Now married:
100.0% (43)Unmarried:
0.0% (0)
Women who did not give birth in the past 12 months Now married:
46.3% (123)Unmarried:
53.7% (143)
Ancestries in St. Stephens
1,061 17.9% American941 15.9% English492 8.3% Iranian380 6.4% German263 4.4% Irish138 2.3% Polish124 2.1% European89 1.5% Scotch-Irish83 1.4% Scottish53 0.9% Italian50 0.8% Haitian48 0.8% African36 0.6% French31 0.5% Finnish24 0.4% Eastern European23 0.4% British22 0.4% Norwegian12 0.2% Russian5 0.08% Dutch5 0.08% Northern European4 0.07% French Canadian2 0.03% Swedish
Children Nativity (place of birth) in St. Stephens
Children under 6 years - Living with two parents Both parents native 296 100.0% NativeBoth parents foreign-born 55 100.0% NativeChildren under 6 years - Living with one parent Native parent 309 100.0% NativeForeign-born parent 28 100.0% NativeChildren 6 to 17 years - Living with two parents Both parents native 527 100.0% NativeBoth parents foreign-born 337 76.3% Native105 23.7% Foreign-bornOne native, one foreign-born parent 67 100.0% NativeChildren 6 to 17 years - Living with one parent Native parent 264 100.0% NativeForeign-born parent 72 51.0% Native69 49.0% Foreign-born
Grandparents responsible for own grandchildren in St. Stephens
Grandparents (30 to 59 years) White / Caucasian 36 100.0% Responsible for grandchildrenBlack or African American 18 100.0% Responsible for grandchildrenWhite alone, not Hispanic / Latino 38 100.0% Responsible for grandchildrenGrandparents (60 years and over) White / Caucasian 87 85.0% Responsible for grandchildren15 15.0% Not responsible for grandchildrenWhite alone, not Hispanic / Latino 87 84.6% Responsible for grandchildren16 15.4% Not responsible for grandchildren