Races in St. Simons, Georgia (GA) Detailed Stats
Ancestries, Foreign-born residents, place of birth
Settings
X


Recent posts about races in St. Simons, Georgia on our local forum with over 2,400,000 registered users:
 | City of Greenhaven proposed for South DeKalb (227 replies) |
| Yes, You Can Build Your Way to Affordable Housing (385 replies) |
| St. Simons Suggestions (6 replies) |
| Relocating to St. Simons Island, GA (22 replies) |
| St. Simons Island makes No. 10 spot on Smithsonian's best small town's list (4 replies) |
| Flurry of development has St. Simons residents consider cityhood (8 replies) |
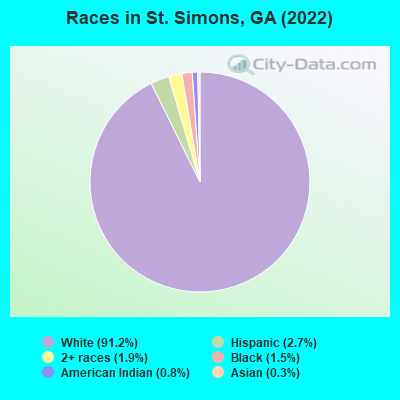
According to 2022 data, the most numerous races in St. Simons, GA are White alone (14,832 residents), Black alone (251 residents), and Hispanic (436 residents). 96.6% of St. Simons residents speak English at home. 3.7% of St. Simons, GA residents are foreign-born (1.3% born in Europe, 0.7% born in North America, 0.7% born in Asia, 0.5% born in Africa, 0.4% born in Latin America), which is 169.3% less than the foreign-born rate of 10.0% across the entire state of Georgia.
Race distribution in St. Simons
2000
2022

- 12,42692.9%White alone
- 4863.6%Black alone
- 2531.9%Hispanic
- 1230.9%Asian alone
- 720.5%Two or more races
- 160.1%American Indian alone
- 30.02%Other race alone
- 20.01%Native Hawaiian and Other
Pacific Islander alone

-
- 14,83291.2%White alone
- 4362.7%Hispanic
- 3131.9%Two or more races
- 2511.5%Black alone
- 1260.8%American Indian alone
- 500.3%Asian alone
- 70.04%Native Hawaiian and Other
Pacific Islander alone
2000
2022
-
- 5,128,66162.6%White alone
- 2,331,46528.5%Black alone
- 435,2275.3%Hispanic
- 171,5132.1%Asian alone
- 87,3641.1%Two or more races
- 17,6700.2%American Indian alone
- 11,2750.1%Other race alone
- 3,2780.04%Native Hawaiian and Other
Pacific Islander alone

-
- 5,415,65749.6%White alone
- 3,349,24030.7%Black alone
- 1,132,60410.4%Hispanic
- 479,1564.4%Asian alone
- 462,9234.2%Two or more races
- 54,4160.5%Other race alone
- 11,9230.1%American Indian alone
- 6,9570.06%Native Hawaiian and Other
Pacific Islander alone

Income and house value in St. Simons
- Median household income in 2022
- $93,578White non-Hispanic householders
- $112,699Two or more races householders
- Median 2022 house value
- $535,475White Non-Hispanic householders
- $438,052Black or African American householders
- $421,932Asian householders
- over $1,000,000Some other race householders
- $408,848Two or more races householders
- $817,697Hispanic or Latino householders
Household income for White non-Hispanic householders

Household income for Black householders

Household income for Some other race householders

Household income for Two or more races householders

Household income for Hispanic or Latino race householders

Median age by race in St. Simons
- 60.7Median age for White residents
- 59.6Males
- 60.7Females
- 68.8Median age for Black or African American residents
- 70.4Males
- 68.3Females
- 18.6Median age for American Indian / Alaska Native residents
- -388,888,888.5Males
- 27.3Females
- 69.9Median age for Asian residents
- -692,810,456.8Males
- 61.9Females
- -657,243,815.6Median age for Native Hawaiian / Pacific Islander residents
- -693,227,090.9Males
- -666,666,666.0Females
- 43.2Median age for Other race residents
- 43.6Males
- 36.7Females
- 63.9Median age for Two or more races residents
- 45.5Males
- 80.7Females
- 58.5Median age for White alone residents
- 57.9Males
- 58.7Females
- 37.7Median age for Hispanic or Latino residents
- 35.6Males
- 48.9Females
Owner/renter occupied households by race in St. Simons
- House owners and renters - White residents
- 6,04185.9%Owner occupied
- 98814.1%Renter occupied
- House owners and renters - Black or African American residents
- 113100.0%Owner occupied
- House owners and renters - Asian residents
- 6100.0%Owner occupied
- House owners and renters - Other race residents
- 3554.7%Owner occupied
- 2945.3%Renter occupied
- House owners and renters - Two or more races residents
- 16658.5%Owner occupied
- 11841.5%Renter occupied
- House owners and renters - White alone residents
- 5,96185.6%Owner occupied
- 1,00714.4%Renter occupied
- House owners and renters - Hispanic or Latino residents
- 13157.7%Owner occupied
- 9642.3%Renter occupied
Language usage in St. Simons
- English speakers - Total
- 96.6% of residents of St. Simons speak English at home.
- 1.6% of residents speak Spanish at home
- 19778.5%Speak English very well
- 5421.5%Speak English less than very well
- 1.3% of residents speak other language at home
- 13062.8%Speak English very well
- 7737.2%Speak English less than very well
- English speakers - Born in the United States
- 99.6% of residents of St. Simons speak English at home.
- 1.2% of residents speak Spanish at home
- 4544.1%Speak English very well
- 5755.9%Speak English less than very well
- 0.1% of residents speak other language at home
- 12100.0%Speak English less than very well
All residents speak only English at home
- English speakers - Foreign-born
- 84.4% of residents of St. Simons speak English at home.
- 2.4% of residents speak Spanish at home
- 18100.0%Speak English less than very well
- 32.8% of residents speak other language at home
- 17973.4%Speak English very well
- 6526.6%Speak English less than very well
White (Caucasian) - Speak only English
| Native: | 100.0% (13,898) |
| Foreign-born: | 83.8% (254) |
White (Caucasian) - Speak another language
| Native: | 0.5% (74) |
| Foreign-born: | 31.1% (94) |
American Indian / Alaska Native - Speak only English
| Native: | 95.0% (108) |
| Foreign-born: | 96.6% (49) |
Asian - Speak only English
| Native: | 95.7% (10) |
| Foreign-born: | 56.9% (23) |
Other race - Speak only English
| Native: | 53.3% (112) |
| Foreign-born: | 100.0% (13) |
Two or more races - Speak another language
| Native: | 6.4% (23) |
| Foreign-born: | 99.4% (86) |
White alone - Speak only English
| Native: | 99.3% (13,862) |
| Foreign-born: | 54.2% (267) |
White alone - Speak another language
| Native: | 0.7% (95) |
| Foreign-born: | 43.1% (212) |
Hispanic or Latino - Speak only English
| Native: | 45.1% (145) |
| Foreign-born: | 53.2% (22) |
Hispanic or Latino - Speak another language
| Native: | 37.1% (119) |
| Foreign-born: | 68.5% (28) |
Foreign-born residents in St. Simons
597 residents are foreign born (1.3% Europe, 0.7% North America, 0.7% Asia, 0.5% Africa, 0.4% Latin America).
| This city: | 3.7% |
| Georgia: | 10.4% |


Marital status for residents in St. Simons
Marital status - White (Caucasian) population 15 years and over
- Males
- 19.5%Never married
- 66.7%Now married
- 0.2%Separated
- 4.8%Widowed
- 8.9%Divorced
- Females
- 14.9%Never married
- 58.4%Now married
- 1.2%Separated
- 13.1%Widowed
- 12.4%Divorced
Women who gave birth in the past 12 months
| Now married: | 100.0% (69) |
| Unmarried: | 0.0% (0) |
Women who did not give birth in the past 12 months
| Now married: | 54.1% (1,180) |
| Unmarried: | 45.9% (1,003) |
Marital status - Black or African American population 15 years and over
- Males
- 10.7%Never married
- 78.5%Now married
- 0.0%Separated
- 0.0%Widowed
- 10.7%Divorced
- Females
- 23.7%Never married
- 24.7%Now married
- 0.0%Separated
- 24.7%Widowed
- 26.8%Divorced
Women who did not give birth in the past 12 months
| Now married: | 36.1% (12) |
| Unmarried: | 63.9% (22) |
Marital status - Asian population 15 years and over
- Males
- 0.0%Never married
- 100.0%Now married
- 0.0%Separated
- 0.0%Widowed
- 0.0%Divorced
- Females
- 20.5%Never married
- 79.5%Now married
- 0.0%Separated
- 0.0%Widowed
- 0.0%Divorced
Women who did not give birth in the past 12 months
| Now married: | 50.0% (9) |
| Unmarried: | 50.0% (9) |
Marital status - Other race population 15 years and over
- Males
- 20.5%Never married
- 79.5%Now married
- 0.0%Separated
- 0.0%Widowed
- 0.0%Divorced
- Females
- 30.3%Never married
- 52.8%Now married
- 0.0%Separated
- 0.0%Widowed
- 16.9%Divorced
Women who did not give birth in the past 12 months
| Now married: | 31.1% (25) |
| Unmarried: | 68.9% (54) |
Marital status - Two or more races population 15 years and over
- Males
- 33.8%Never married
- 66.2%Now married
- 0.0%Separated
- 0.0%Widowed
- 0.0%Divorced
- Females
- 42.2%Never married
- 38.1%Now married
- 0.0%Separated
- 2.7%Widowed
- 17.0%Divorced
Women who did not give birth in the past 12 months
| Now married: | 38.9% (52) |
| Unmarried: | 61.1% (81) |
Marital status - White alone, not Hispanic / Latino population 15 years and over
- Males
- 19.3%Never married
- 66.9%Now married
- 0.0%Separated
- 4.8%Widowed
- 8.9%Divorced
- Females
- 14.6%Never married
- 58.6%Now married
- 1.2%Separated
- 13.2%Widowed
- 12.4%Divorced
Women who gave birth in the past 12 months
| Now married: | 100.0% (73) |
| Unmarried: | 0.0% (0) |
Women who did not give birth in the past 12 months
| Now married: | 53.8% (1,222) |
| Unmarried: | 46.2% (1,050) |
Marital status - Hispanic or Latino population 15 years and over
- Males
- 20.5%Never married
- 72.9%Now married
- 6.6%Separated
- 0.0%Widowed
- 0.0%Divorced
- Females
- 37.9%Never married
- 45.6%Now married
- 0.0%Separated
- 0.0%Widowed
- 16.6%Divorced
Women who did not give birth in the past 12 months
| Now married: | 42.9% (42) |
| Unmarried: | 57.1% (56) |
Ancestries in St. Simons

- 2,13326.6%English
- 95611.9%American
- 5096.3%Irish
- 4495.6%Scottish
- 4165.2%German
- 2603.2%Italian
- 2222.8%Scotch-Irish
- 1722.1%European
- 1531.9%Polish
- 1181.5%French Canadian
- 690.9%British
- 540.7%Dutch
- 500.6%Lebanese
- 500.6%Danish
- 460.6%Swedish
- 450.6%French
- 380.5%Hungarian
- 330.4%Lithuanian
- 220.3%Serbian
- 210.3%Eastern European
- 170.2%Austrian
- 170.2%Belgian
- 160.2%Finnish
- 160.2%Welsh
- 150.2%Czechoslovakian
- 130.2%Norwegian
- 120.1%Romanian
- 110.1%Pennsylvania German
- 110.1%Russian
- 80.10%Slavic
- 70.09%Luxembourger
- 70.09%Ukrainian
- 70.09%Greek
- 60.07%Czech
- 30.04%Brazilian

Geographical mobility in St. Simons

- Same house 1 year ago
- 13,15190.9%White (Caucasian)
- 17973.7%Black or African American
- 13476.5%American Indian / Alaska Native
- 5199.9%Asian
- 8100.0%Native Hawaiian / Pacific Islander
- 22499.7%Other race
- 33076.2%Two or more races
- 13,48090.9%White alone, not Hispanic / Latino
- 26268.0%Hispanic or Latino

-
- Moved within same county
- 4293.0%White / Caucasian
- 41.6%Black or African American
- 5212.0%Two or more races
- 4633.1%White alone, not Hispanic / Latino
- 348.8%Hispanic or Latino

-
- Moved within same state
- 4943.4%White / Caucasian
- 20.8%Black or African American
- 4933.3%White alone, not Hispanic / Latino
- 4211.0%Hispanic or Latino

-
- Moved from different state
- 4062.8%White / Caucasian
- 3815.7%Black or African American
- 4324.4%American Indian / Alaska Native
- 4510.3%Two or more races
- 3832.6%White alone, not Hispanic / Latino
- 5514.2%Hispanic or Latino

-
- Moved from abroad
- 230.2%White
- 230.2%White alone, not Hispanic / Latino

Children Nativity (place of birth) in St. Simons
Place of birth for residents in St. Simons
![Place of birth for the foreign-born population - Regions]()
- 211Europe
- 186Americas
- 125Northern Europe
- 115Northern America
- 111Asia
- 87Africa
- 87Northern Africa
- 74Western Europe
- 70Latin America
- 69Western Asia
- 37Central America
- 33South America
- 27South Central Asia
- 14South Eastern Asia
- 12Southern Europe

![Place of birth for the foreign-born population - Countries]()
- 115Canada
- 87Morocco
- 46England
- 43Netherlands
- 36United Kingdom
- 36Lebanon
- 33Iraq
- 30Sweden
- 29Guyana
- 27El Salvador
- 16Bangladesh
- 15Germany
- 14Belgium
- 12Portugal
- 11Scotland
- 10India
- 10Mexico
- 9Thailand
- 5Philippines
- 4Brazil

Zip codes: 31522.