Races in St. Joseph, Missouri (MO) Detailed Stats
Data:
Races - White alone (%)
Races - White alone (% change since 2000)
Races - Black alone (%)
Races - Black alone (% change since 2000)
Races - American Indian alone (%)
Races - American Indian alone (% change since 2000)
Races - Asian alone (%)
Races - Asian alone (% change since 2000)
Races - Hispanic (%)
Races - Hispanic (% change since 2000)
Races - Native Hawaiian and Other Pacific Islander alone (%)
Races - Native Hawaiian and Other Pacific Islander alone (% change since 2000)
Races - Two or more races(%)
Races - Two or more races(% change since 2000)
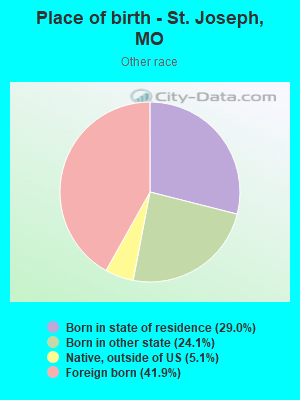
Races - Other race alone (%)
Races - Other race alone (% change since 2000)
Racial diversity
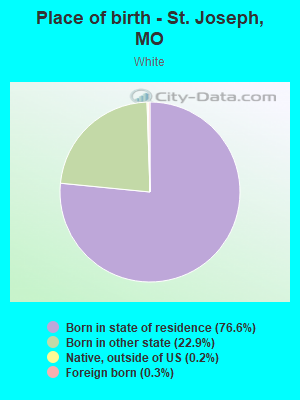
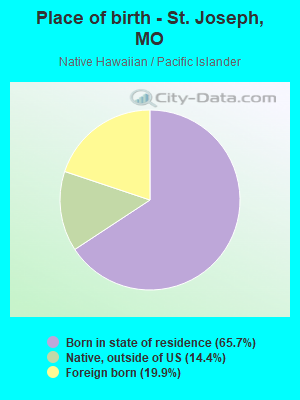
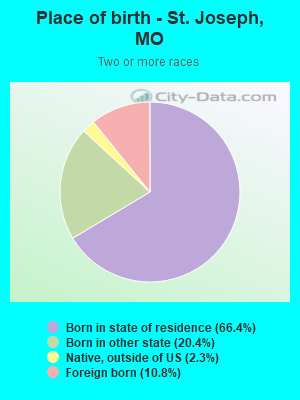
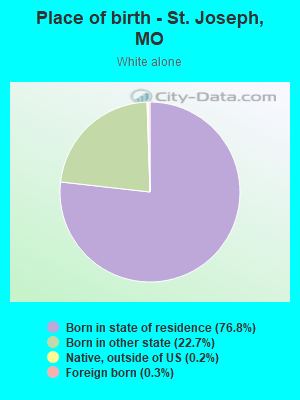
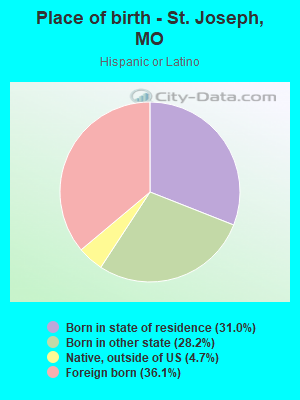
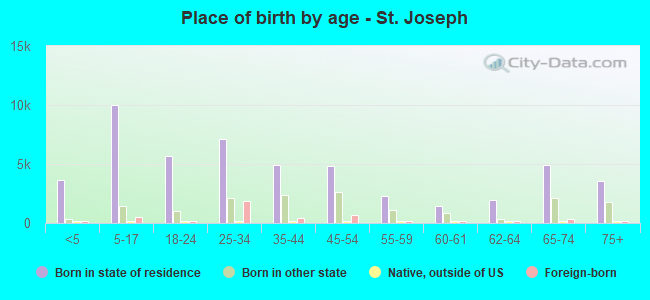
Place of birth - Born in state of residence (%)
Place of birth - Born in state of residence (%) - White
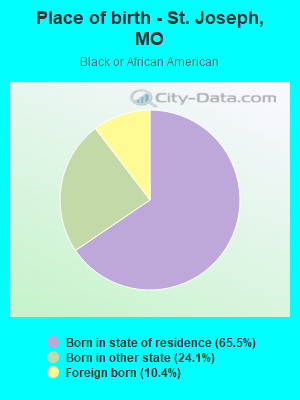
Place of birth - Born in state of residence (%) - Black or African American
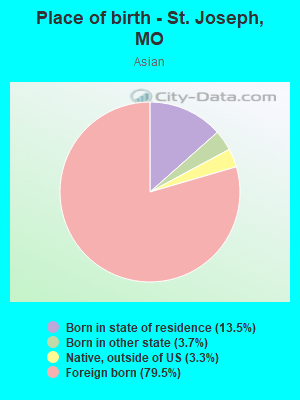
Place of birth - Born in state of residence (%) - Asian
Place of birth - Born in state of residence (%) - Hispanic or Latino
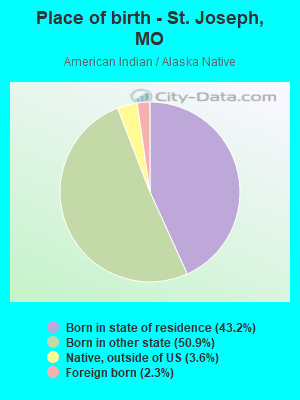
Place of birth - Born in state of residence (%) - American Indian and Alaska Native
Place of birth - Born in state of residence (%) - Multirace
Place of birth - Born in state of residence (%) - Other Race
Place of birth - Born in other state (%)
Place of birth - Born in other state (%) - White
Place of birth - Born in other state (%) - Black or African American
Place of birth - Born in other state (%) - Asian
Place of birth - Born in other state (%) - Hispanic or Latino
Place of birth - Born in other state (%) - American Indian and Alaska Native
Place of birth - Born in other state (%) - Multirace
Place of birth - Born in other state (%) - Other Race
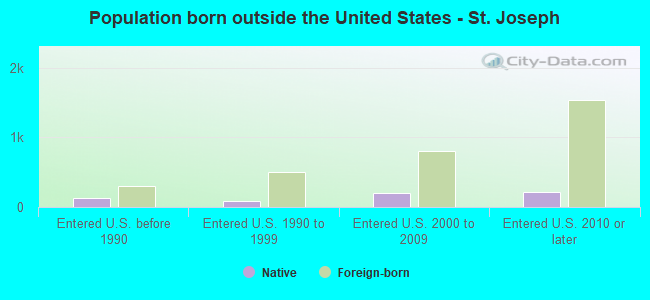
Place of birth - Native, outside of US (%)
Place of birth - Native, outside of US (%) - White
Place of birth - Native, outside of US (%) - Black or African American
Place of birth - Native, outside of US (%) - Asian
Place of birth - Native, outside of US (%) - Hispanic or Latino
Place of birth - Native, outside of US (%) - American Indian and Alaska Native
Place of birth - Native, outside of US (%) - Multirace
Place of birth - Native, outside of US (%) - Other Race
Place of birth - Foreign born (%)
Place of birth - Foreign born (%) - White
Place of birth - Foreign born (%) - Black or African American
Place of birth - Foreign born (%) - Asian
Place of birth - Foreign born (%) - Hispanic or Latino
Place of birth - Foreign born (%) - American Indian and Alaska Native
Place of birth - Foreign born (%) - Multirace
Place of birth - Foreign born (%) - Other Race
Residents speaking English at home (%)
Residents speaking English at home - Born in the United States (%)
Residents speaking English at home - Native, born elsewhere (%)
Residents speaking English at home - Foreign born (%)
Residents speaking Spanish at home (%)
Residents speaking Spanish at home - Born in the United States (%)
Residents speaking Spanish at home - Native, born elsewhere (%)
Residents speaking Spanish at home - Foreign born (%)
Residents speaking other language at home (%)
Residents speaking other language at home - Born in the United States (%)
Residents speaking other language at home - Native, born elsewhere (%)
Residents speaking other language at home - Foreign born (%)
Marital status - Never married (%)
Marital status - Now married (%)
Marital status - Separated (%)
Marital status - Widowed (%)
Marital status - Divorced (%)
Ancestries Reported - Arab (%)
Ancestries Reported - Czech (%)
Ancestries Reported - Danish (%)
Ancestries Reported - Dutch (%)
Ancestries Reported - English (%)
Ancestries Reported - French (%)
Ancestries Reported - French Canadian (%)
Ancestries Reported - German (%)
Ancestries Reported - Greek (%)
Ancestries Reported - Hungarian (%)
Ancestries Reported - Irish (%)
Ancestries Reported - Italian (%)
Ancestries Reported - Lithuanian (%)
Ancestries Reported - Norwegian (%)
Ancestries Reported - Polish (%)
Ancestries Reported - Portuguese (%)
Ancestries Reported - Russian (%)
Ancestries Reported - Scotch-Irish (%)
Ancestries Reported - Scottish (%)
Ancestries Reported - Slovak (%)
Ancestries Reported - Subsaharan African (%)
Ancestries Reported - Swedish (%)
Ancestries Reported - Swiss (%)
Ancestries Reported - Ukrainian (%)
Ancestries Reported - United States (%)
Ancestries Reported - Welsh (%)
Ancestries Reported - West Indian (%)
Ancestries Reported - Other (%)
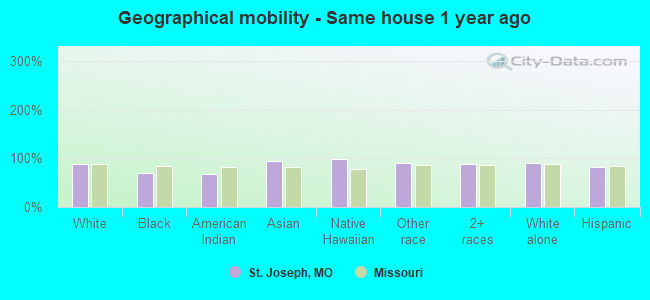
Geographical mobility - Same house 1 year ago (%)
Geographical mobility - Same house 1 year ago (%) - White
Geographical mobility - Same house 1 year ago (%) - Black or African American
Geographical mobility - Same house 1 year ago (%) - Asian
Geographical mobility - Same house 1 year ago (%) - Hispanic or Latino
Geographical mobility - Same house 1 year ago (%) - American Indian and Alaska Native
Geographical mobility - Same house 1 year ago (%) - Multirace
Geographical mobility - Same house 1 year ago (%) - Other Race
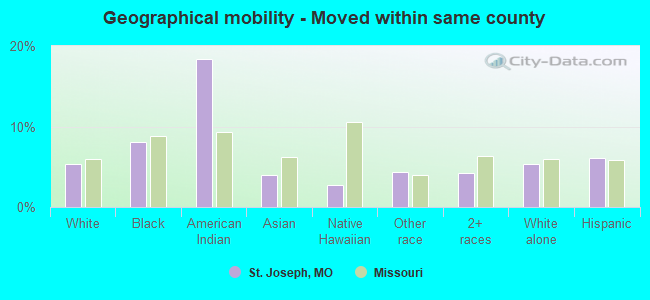
Geographical mobility - Moved within same county (%)
Geographical mobility - Moved within same county (%) - White
Geographical mobility - Moved within same county (%) - Black or African American
Geographical mobility - Moved within same county (%) - Asian
Geographical mobility - Moved within same county (%) - Hispanic or Latino
Geographical mobility - Moved within same county (%) - American Indian and Alaska Native
Geographical mobility - Moved within same county (%) - Multirace
Geographical mobility - Moved within same county (%) - Other Race
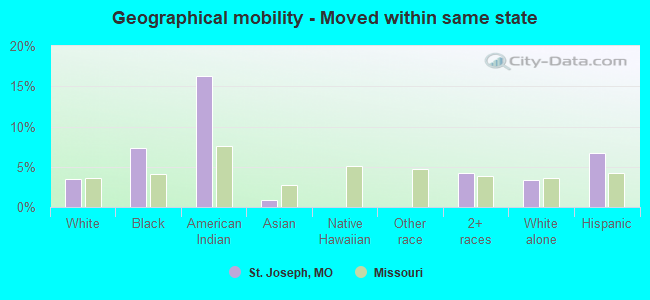
Geographical mobility - Moved from different county within same state (%)
Geographical mobility - Moved from different county within same state (%) - White
Geographical mobility - Moved from different county within same state (%) - Black or African American
Geographical mobility - Moved from different county within same state (%) - Asian
Geographical mobility - Moved from different county within same state (%) - Hispanic or Latino
Geographical mobility - Moved from different county within same state (%) - American Indian and Alaska Native
Geographical mobility - Moved from different county within same state (%) - Multirace
Geographical mobility - Moved from different county within same state (%) - Other Race
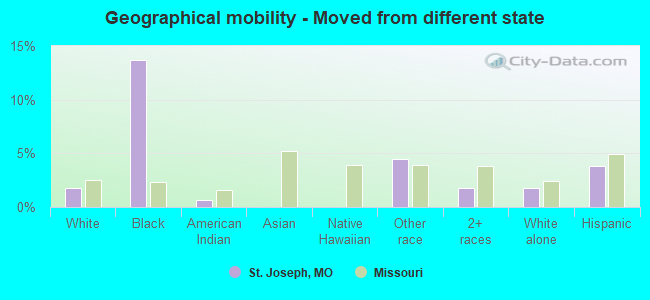
Geographical mobility - Moved from different state (%)
Geographical mobility - Moved from different state (%) - White
Geographical mobility - Moved from different state (%) - Black or African American
Geographical mobility - Moved from different state (%) - Asian
Geographical mobility - Moved from different state (%) - Hispanic or Latino
Geographical mobility - Moved from different state (%) - American Indian and Alaska Native
Geographical mobility - Moved from different state (%) - Multirace
Geographical mobility - Moved from different state (%) - Other Race
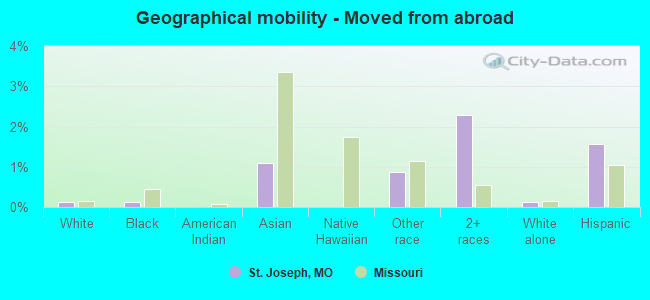
Geographical mobility - Moved from abroad (%)
Geographical mobility - Moved from abroad (%) - White
Geographical mobility - Moved from abroad (%) - Black or African American
Geographical mobility - Moved from abroad (%) - Asian
Geographical mobility - Moved from abroad (%) - Hispanic or Latino
Geographical mobility - Moved from abroad (%) - American Indian and Alaska Native
Geographical mobility - Moved from abroad (%) - Multirace
Geographical mobility - Moved from abroad (%) - Other Race
Place of birth for the foreign-born population - Ireland (%)
Place of birth for the foreign-born population - Denmark (%)
Place of birth for the foreign-born population - Norway (%)
Place of birth for the foreign-born population - Sweden (%)
Place of birth for the foreign-born population - United Kingdom (%)
Place of birth for the foreign-born population - England (%)
Place of birth for the foreign-born population - Scotland (%)
Place of birth for the foreign-born population - Other Northern Europe (%)
Place of birth for the foreign-born population - Austria (%)
Place of birth for the foreign-born population - Belgium (%)
Place of birth for the foreign-born population - France (%)
Place of birth for the foreign-born population - Germany (%)
Place of birth for the foreign-born population - Netherlands (%)
Place of birth for the foreign-born population - Switzerland (%)
Place of birth for the foreign-born population - Other Western Europe (%)
Place of birth for the foreign-born population - Greece (%)
Place of birth for the foreign-born population - Italy (%)
Place of birth for the foreign-born population - Portugal (%)
Place of birth for the foreign-born population - Spain (%)
Place of birth for the foreign-born population - Other Southern Europe (%)
Place of birth for the foreign-born population - Albania (%)
Place of birth for the foreign-born population - Belarus (%)
Place of birth for the foreign-born population - Bosnia and Herzegovina (%)
Place of birth for the foreign-born population - Bulgaria (%)
Place of birth for the foreign-born population - Croatia (%)
Place of birth for the foreign-born population - Czechoslovakia (%)
Place of birth for the foreign-born population - Hungary (%)
Place of birth for the foreign-born population - Latvia (%)
Place of birth for the foreign-born population - Lithuania (%)
Place of birth for the foreign-born population - North Macedonia (Macedonia) (%)
Place of birth for the foreign-born population - Moldova (%)
Place of birth for the foreign-born population - Poland (%)
Place of birth for the foreign-born population - Romania (%)
Place of birth for the foreign-born population - Russia (%)
Place of birth for the foreign-born population - Serbia (%)
Place of birth for the foreign-born population - Ukraine (%)
Place of birth for the foreign-born population - Other Eastern Europe (%)
Place of birth for the foreign-born population - China (%)
Place of birth for the foreign-born population - Hong Kong (%)
Place of birth for the foreign-born population - Taiwan (%)
Place of birth for the foreign-born population - Japan (%)
Place of birth for the foreign-born population - Korea (%)
Place of birth for the foreign-born population - Other Eastern Asia (%)
Place of birth for the foreign-born population - Afghanistan (%)
Place of birth for the foreign-born population - Bangladesh (%)
Place of birth for the foreign-born population - India (%)
Place of birth for the foreign-born population - Iran (%)
Place of birth for the foreign-born population - Kazakhstan (%)
Place of birth for the foreign-born population - Nepal (%)
Place of birth for the foreign-born population - Pakistan (%)
Place of birth for the foreign-born population - Sri Lanka (%)
Place of birth for the foreign-born population - Uzbekistan (%)
Place of birth for the foreign-born population - Other South Central Asia (%)
Place of birth for the foreign-born population - Burma (%)
Place of birth for the foreign-born population - Cambodia (%)
Place of birth for the foreign-born population - Indonesia (%)
Place of birth for the foreign-born population - Laos (%)
Place of birth for the foreign-born population - Malaysia (%)
Place of birth for the foreign-born population - Philippines (%)
Place of birth for the foreign-born population - Singapore (%)
Place of birth for the foreign-born population - Thailand (%)
Place of birth for the foreign-born population - Vietnam (%)
Place of birth for the foreign-born population - Other South Eastern Asia (%)
Place of birth for the foreign-born population - Armenia (%)
Place of birth for the foreign-born population - Iraq (%)
Place of birth for the foreign-born population - Israel (%)
Place of birth for the foreign-born population - Jordan (%)
Place of birth for the foreign-born population - Kuwait (%)
Place of birth for the foreign-born population - Lebanon (%)
Place of birth for the foreign-born population - Saudi Arabia (%)
Place of birth for the foreign-born population - Syria (%)
Place of birth for the foreign-born population - Turkey (%)
Place of birth for the foreign-born population - Yemen (%)
Place of birth for the foreign-born population - Other Western Asia (%)
Place of birth for the foreign-born population - Eritrea (%)
Place of birth for the foreign-born population - Ethiopia (%)
Place of birth for the foreign-born population - Kenya (%)
Place of birth for the foreign-born population - Somalia (%)
Place of birth for the foreign-born population - Uganda (%)
Place of birth for the foreign-born population - Zimbabwe (%)
Place of birth for the foreign-born population - Other Eastern Africa (%)
Place of birth for the foreign-born population - Cameroon (%)
Place of birth for the foreign-born population - Congo (%)
Place of birth for the foreign-born population - Democratic Republic of Congo (Zaire) (%)
Place of birth for the foreign-born population - Other Middle Africa (%)
Place of birth for the foreign-born population - Egypt (%)
Place of birth for the foreign-born population - Morocco (%)
Place of birth for the foreign-born population - Sudan (%)
Place of birth for the foreign-born population - Other Northern Africa (%)
Place of birth for the foreign-born population - South Africa (%)
Place of birth for the foreign-born population - Other Southern Africa (%)
Place of birth for the foreign-born population - Cabo Verde (%)
Place of birth for the foreign-born population - Ghana (%)
Place of birth for the foreign-born population - Liberia (%)
Place of birth for the foreign-born population - Nigeria (%)
Place of birth for the foreign-born population - Senegal (%)
Place of birth for the foreign-born population - Sierra Leone (%)
Place of birth for the foreign-born population - Other Western Africa (%)
Place of birth for the foreign-born population - Australia (%)
Place of birth for the foreign-born population - New Zealand (%)
Place of birth for the foreign-born population - Fiji (%)
Place of birth for the foreign-born population - Micronesia (%)
Place of birth for the foreign-born population - Bahamas (%)
Place of birth for the foreign-born population - Barbados (%)
Place of birth for the foreign-born population - Cuba (%)
Place of birth for the foreign-born population - Dominica (%)
Place of birth for the foreign-born population - Dominican Republic (%)
Place of birth for the foreign-born population - Grenada (%)
Place of birth for the foreign-born population - Haiti (%)
Place of birth for the foreign-born population - Jamaica (%)
Place of birth for the foreign-born population - St. Vincent and the Grenadines (%)
Place of birth for the foreign-born population - Trinidad and Tobago (%)
Place of birth for the foreign-born population - West Indies (%)
Place of birth for the foreign-born population - Other Caribbean (%)
Place of birth for the foreign-born population - Belize (%)
Place of birth for the foreign-born population - Costa Rica (%)
Place of birth for the foreign-born population - El Salvador (%)
Place of birth for the foreign-born population - Guatemala (%)
Place of birth for the foreign-born population - Honduras (%)
Place of birth for the foreign-born population - Mexico (%)
Place of birth for the foreign-born population - Nicaragua (%)
Place of birth for the foreign-born population - Panama (%)
Place of birth for the foreign-born population - Other Central America (%)
Place of birth for the foreign-born population - Argentina (%)
Place of birth for the foreign-born population - Bolivia (%)
Place of birth for the foreign-born population - Brazil (%)
Place of birth for the foreign-born population - Chile (%)
Place of birth for the foreign-born population - Colombia (%)
Place of birth for the foreign-born population - Ecuador (%)
Place of birth for the foreign-born population - Guyana (%)
Place of birth for the foreign-born population - Peru (%)
Place of birth for the foreign-born population - Uruguay (%)
Place of birth for the foreign-born population - Venezuela (%)
Place of birth for the foreign-born population - Other South America (%)
Place of birth for the foreign-born population - Canada (%)
Place of birth for the foreign-born population - Other Northern America (%)
Place of birth for the foreign-born population - Other (%)
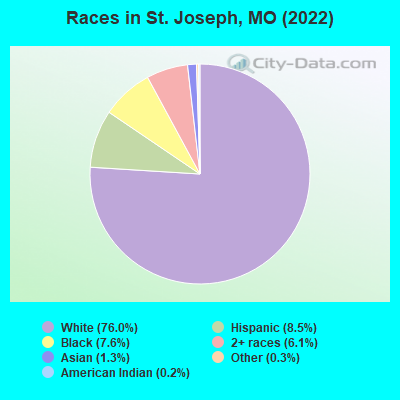
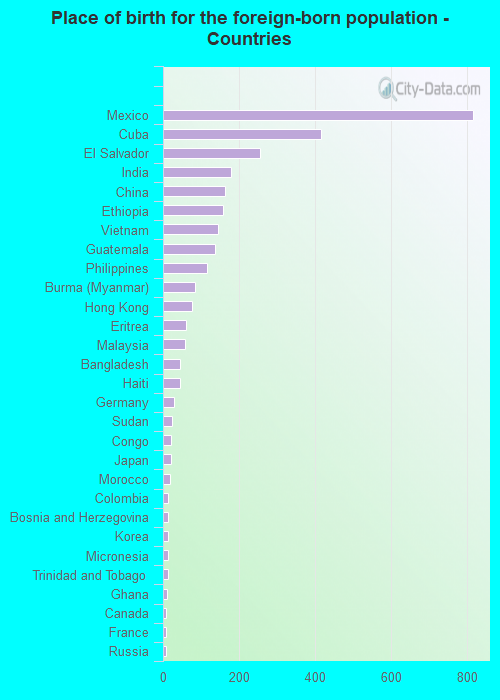
According to 2022 data, the most numerous races in St. Joseph, MO are White alone (53,712 residents), Black alone (5,399 residents), and Two or more races (4,296 residents). 92.5% of St. Joseph residents speak English at home. 4.4% of St. Joseph, MO residents are foreign-born (2.4% born in Latin America, 1.3% born in Asia, 0.5% born in Africa), which is 8.3% greater than the foreign-born rate of 4.0% across the entire state of Missouri.
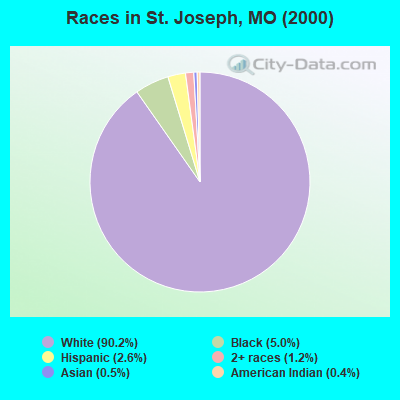
Race distribution in St. Joseph
2000 2022
4,686,474 83.8% White alone 625,667 11.2% Black alone 118,592 2.1% Hispanic 71,905 1.3% Two or more races 61,041 1.1% Asian alone 23,302 0.4% American Indian alone 5,291 0.09% Other race alone 2,939 0.05% Native Hawaiian and Other
4,733,411 76.6% White alone 656,739 10.6% Black alone 316,300 5.1% Two or more races 291,763 4.7% Hispanic 132,436 2.1% Asian alone 27,467 0.4% Other race alone 12,313 0.2% American Indian alone 7,528 0.1% Native Hawaiian and Other
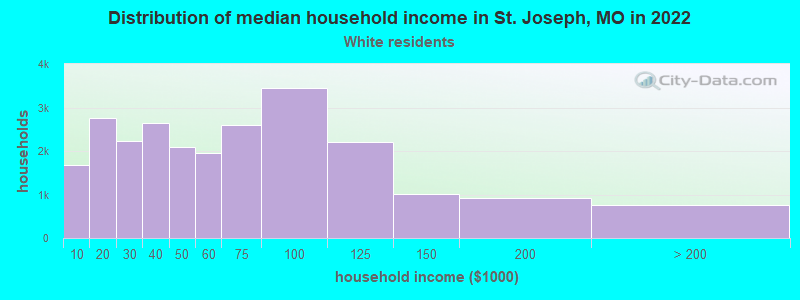
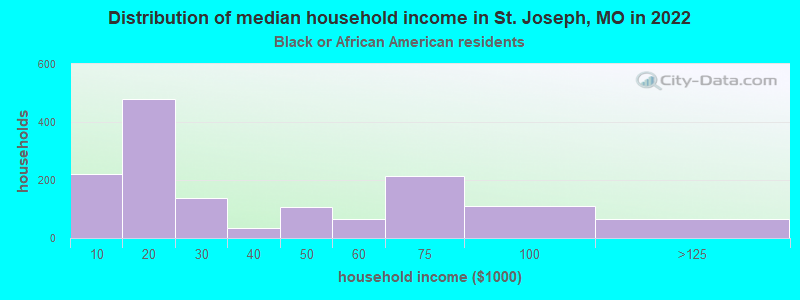
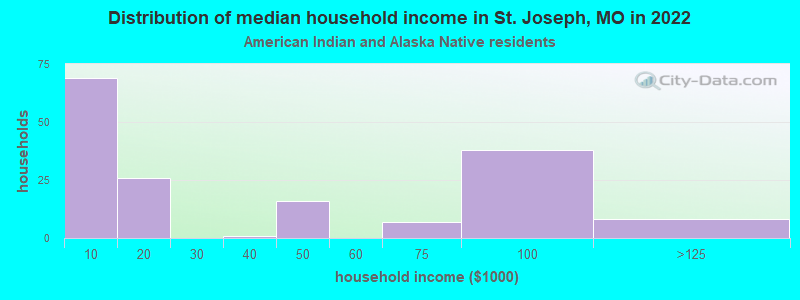
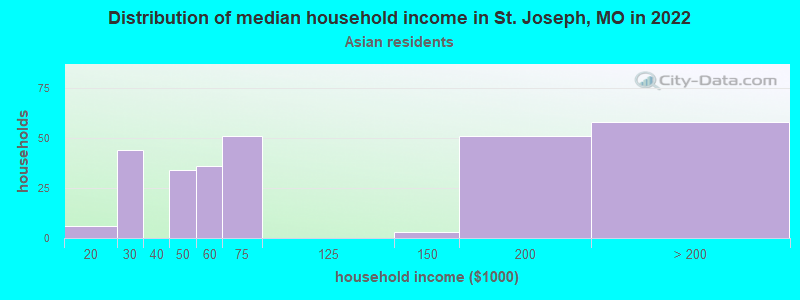
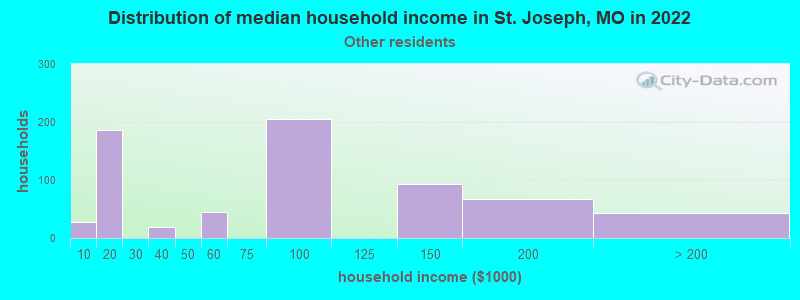
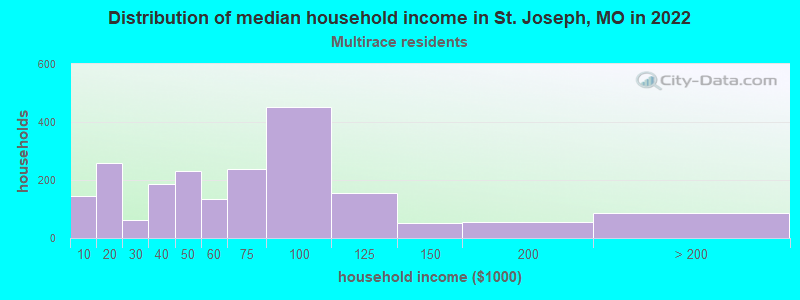
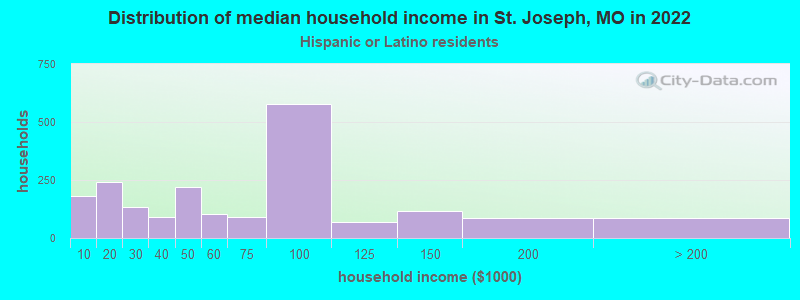
Income and house value in St. Joseph Median household income in 2022 $52,339 White non-Hispanic householders$51,534 Black householders$82,584 American Indian and Alaska Native householders$57,011 Asian householders$84,645 Some other race householders$48,790 Two or more races householders$49,363 Hispanic or Latino race householdersMedian 2022 house value $153,065 White Non-Hispanic householders$100,810 Black or African American householders$127,809 American Indian or Alaska Native householders $107,124 Asian householders$177,887 Native Hawaiian and other Pacific Islander householders$138,042 Some other race householders$153,283 Two or more races householders$143,485 Hispanic or Latino householders
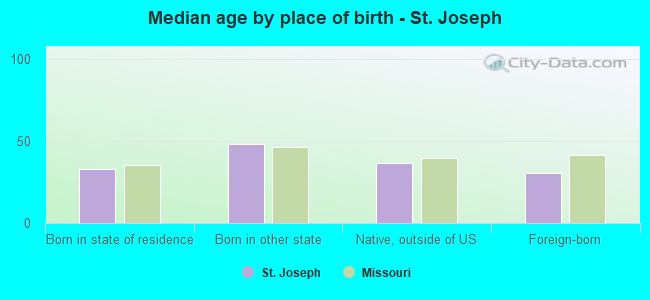
Median age by race in St. Joseph
40.2 Median age for White residents37.7 42.2 24.1 Median age for Black or African American residents23.4 27.4 35.7 Median age for American Indian / Alaska Native residents35.9 -666,666,666.0 37.6 Median age for Asian residents32.1 41.0 -666,666,666.0 Median age for Native Hawaiian / Pacific Islander residents-666,666,666.0 -666,666,666.0 29.1 Median age for Other race residents29.7 28.5 30.5 Median age for Two or more races residents27.6 31.2 40.3 Median age for White alone residents37.9 42.2 28.9 Median age for Hispanic or Latino residents29.7 28.2
Owner/renter occupied households by race in St. Joseph
House owners and renters - White residents 15,261 62.9% Owner occupied9,015 37.1% Renter occupiedHouse owners and renters - Black or African American residents 1,027 71.9% Owner occupied401 28.1% Renter occupiedHouse owners and renters - American Indian / Alaska Native residents 98 62.9% Owner occupied58 37.1% Renter occupiedHouse owners and renters - Asian residents 121 40.5% Owner occupied178 59.5% Renter occupiedHouse owners and renters - Native Hawaiian / Pacific Islander residents 153 100.0% Renter occupiedHouse owners and renters - Other race residents 732 53.4% Owner occupied639 46.6% Renter occupiedHouse owners and renters - Two or more races residents 610 39.1% Owner occupied952 60.9% Renter occupiedHouse owners and renters - White alone residents 15,261 63.4% Owner occupied8,792 36.6% Renter occupiedHouse owners and renters - Hispanic or Latino residents 895 40.5% Owner occupied1,315 59.5% Renter occupied
Language usage in St. Joseph
English speakers - Total 92.5% of residents of St. Joseph speak English at home.
4.8% of residents speak Spanish at home 1,621 49.9% Speak English very well1,627 50.1% Speak English less than very well2.8% of residents speak other language at home 1,143 60.4% Speak English very well748 39.6% Speak English less than very well
English speakers - Born in the United States 96.0% of residents of St. Joseph speak English at home.
3.1% of residents speak Spanish at home 318 61.9% Speak English very well196 38.1% Speak English less than very well1.1% of residents speak other language at home 182 100.0% Speak English very well
English speakers - Native, born elsewhere 56.9% of residents of St. Joseph speak English at home.
30.4% of residents speak Spanish at home 53 28.6% Speak English very well132 71.4% Speak English less than very well21.4% of residents speak other language at home 130 100.0% Speak English less than very well
English speakers - Foreign-born 5.1% of residents of St. Joseph speak English at home.
53.1% of residents speak Spanish at home 484 29.5% Speak English very well1,158 70.5% Speak English less than very well43.5% of residents speak other language at home 765 56.9% Speak English very well580 43.1% Speak English less than very well
White (Caucasian) - Speak only English Native:
99.4% (51,740)Foreign-born:
36.5% (136)
White (Caucasian) - Speak another language Native:
0.6% (289)Foreign-born:
84.6% (316)
Black or African American - Speak only English Native:
96.8% (3,935)Foreign-born:
2.9% (11)
Black or African American - Speak another language Native:
3.5% (141)Foreign-born:
96.7% (381)
American Indian / Alaska Native - Speak another language Native:
58.3% (185)Foreign-born:
100.0% (8)
Asian - Speak only English Native:
25.4% (61)Foreign-born:
4.6% (42)
Asian - Speak another language Native:
65.8% (157)Foreign-born:
95.5% (872)
Native Hawaiian / Pacific Islander - Speak another language Native:
43.2% (59)Foreign-born:
94.6% (43)
Other race - Speak only English Native:
62.2% (861)Foreign-born:
2.8% (30)
Other race - Speak another language Native:
37.1% (514)Foreign-born:
93.0% (979)
Two or more races - Speak only English Native:
86.3% (4,306)Foreign-born:
5.1% (29)
Two or more races - Speak another language Native:
14.5% (721)Foreign-born:
97.3% (558)
White alone - Speak only English Native:
99.5% (51,347)Foreign-born:
21.6% (39)
White alone - Speak another language Native:
0.5% (272)Foreign-born:
27.8% (50)
Hispanic or Latino - Speak only English Native:
73.1% (2,347)Foreign-born:
10.1% (221)
Hispanic or Latino - Speak another language Native:
26.9% (862)Foreign-born:
89.9% (1,957)
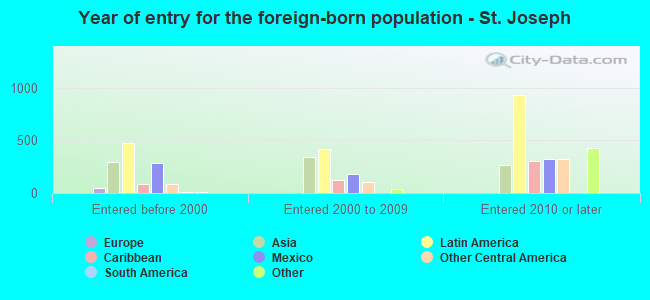
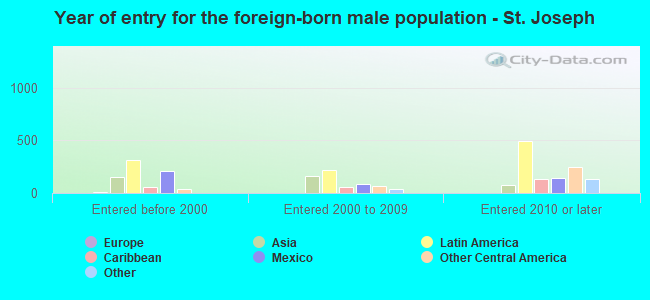
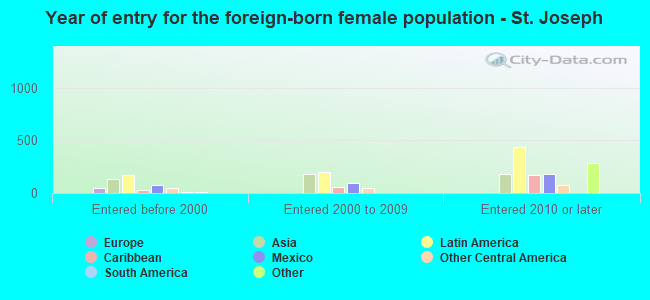
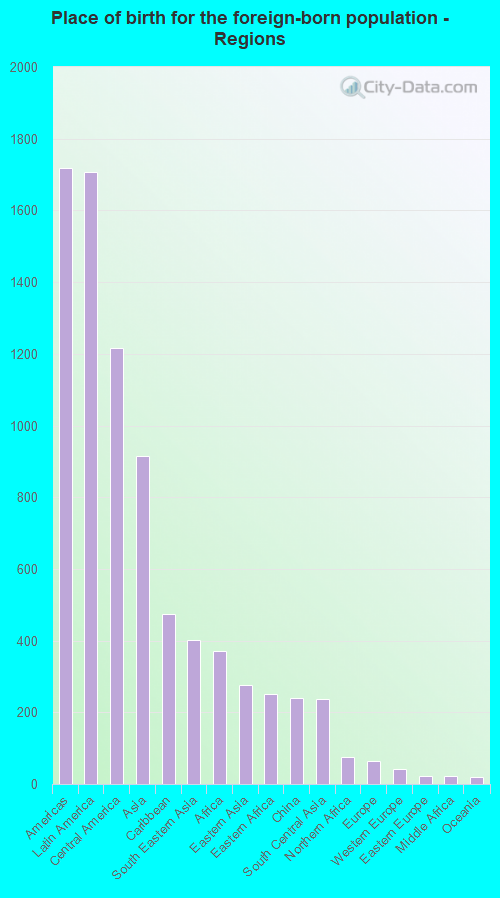
Foreign-born residents in St. Joseph 3,089 residents are foreign born (2.4% Latin America , 1.3% Asia , 0.5% Africa ).
This city:
4.4%Missouri:
4.2%
Marital status for residents in St. Joseph Marital status - White (Caucasian) population 15 years and over
Males 43.0% Never married42.1% Now married1.4% Separated2.8% Widowed10.8% DivorcedFemales 26.0% Never married38.7% Now married2.4% Separated15.2% Widowed17.7% DivorcedWomen who gave birth in the past 12 months Now married:
53.7% (502)Unmarried:
46.3% (433)
Women who did not give birth in the past 12 months Now married:
39.5% (4,251)Unmarried:
60.5% (6,509)
Marital status - Black or African American population 15 years and over
Males 71.4% Never married19.4% Now married0.0% Separated0.0% Widowed9.2% DivorcedFemales 33.3% Never married19.7% Now married1.9% Separated0.0% Widowed45.2% DivorcedWomen who gave birth in the past 12 months Now married:
0.0% (0)Unmarried:
100.0% (205)
Women who did not give birth in the past 12 months Now married:
30.1% (221)Unmarried:
69.9% (514)
Marital status - American Indian / Alaska Native population 15 years and over
Males 56.9% Never married29.2% Now married0.0% Separated4.6% Widowed9.2% DivorcedFemales 37.7% Never married34.4% Now married4.1% Separated4.9% Widowed18.9% DivorcedWomen who gave birth in the past 12 months Now married:
100.0% (6)Unmarried:
0.0% (0)
Women who did not give birth in the past 12 months Now married:
30.3% (20)Unmarried:
69.7% (45)
Marital status - Asian population 15 years and over
Males 26.3% Never married60.9% Now married0.0% Separated0.0% Widowed12.9% DivorcedFemales 28.6% Never married67.6% Now married0.0% Separated3.3% Widowed0.6% DivorcedWomen who gave birth in the past 12 months Now married:
100.0% (30)Unmarried:
0.0% (0)
Women who did not give birth in the past 12 months Now married:
56.8% (212)Unmarried:
43.2% (161)
Marital status - Native Hawaiian / Pacific Islander population 15 years and over
Males 50.6% Never married32.9% Now married0.0% Separated0.0% Widowed16.5% DivorcedFemales 76.5% Never married18.5% Now married5.0% Separated0.0% Widowed0.0% DivorcedWomen who did not give birth in the past 12 months Now married:
6.2% (5)Unmarried:
93.8% (73)
Marital status - Other race population 15 years and over
Males 34.6% Never married46.1% Now married0.0% Separated0.0% Widowed19.3% DivorcedFemales 50.4% Never married39.4% Now married0.0% Separated4.1% Widowed6.1% DivorcedWomen who gave birth in the past 12 months Now married:
50.0% (23)Unmarried:
50.0% (23)
Women who did not give birth in the past 12 months Now married:
40.7% (277)Unmarried:
59.3% (404)
Marital status - Two or more races population 15 years and over
Males 45.1% Never married28.0% Now married0.0% Separated0.0% Widowed26.9% DivorcedFemales 31.0% Never married43.0% Now married0.0% Separated6.4% Widowed19.6% DivorcedWomen who gave birth in the past 12 months Now married:
0.0% (0)Unmarried:
100.0% (29)
Women who did not give birth in the past 12 months Now married:
55.6% (836)Unmarried:
44.4% (669)
Marital status - White alone, not Hispanic / Latino population 15 years and over
Males 42.7% Never married42.5% Now married1.4% Separated2.8% Widowed10.5% DivorcedFemales 25.8% Never married38.7% Now married2.5% Separated15.3% Widowed17.8% DivorcedWomen who gave birth in the past 12 months Now married:
53.7% (502)Unmarried:
46.3% (433)
Women who did not give birth in the past 12 months Now married:
39.7% (4,251)Unmarried:
60.3% (6,455)
Marital status - Hispanic or Latino population 15 years and over
Males 38.5% Never married45.5% Now married0.0% Separated0.0% Widowed16.0% DivorcedFemales 29.8% Never married53.8% Now married0.0% Separated9.3% Widowed7.1% DivorcedWomen who gave birth in the past 12 months Now married:
29.2% (23)Unmarried:
70.8% (55)
Women who did not give birth in the past 12 months Now married:
47.0% (770)Unmarried:
53.0% (869)
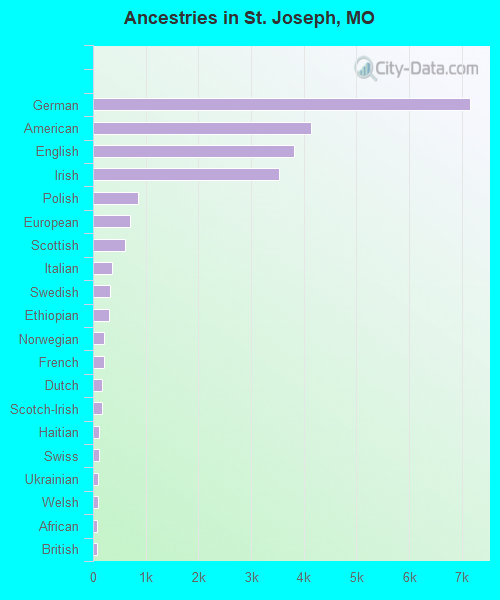
Ancestries in St. Joseph
7,160 20.6% German4,145 11.9% American3,817 11.0% English3,528 10.1% Irish863 2.5% Polish706 2.0% European604 1.7% Scottish352 1.0% Italian319 0.9% Swedish299 0.9% Ethiopian214 0.6% Norwegian205 0.6% French178 0.5% Dutch176 0.5% Scotch-Irish118 0.3% Haitian106 0.3% Swiss89 0.3% Ukrainian87 0.3% Welsh82 0.2% African75 0.2% British63 0.2% French Canadian63 0.2% Belgian48 0.1% Brazilian43 0.1% Scandinavian43 0.1% Lithuanian34 0.10% Danish29 0.08% Czech28 0.08% Northern European25 0.07% Sudanese23 0.07% Slavic22 0.06% Russian22 0.06% Yugoslavian18 0.05% Moroccan17 0.05% Jamaican13 0.04% Romanian13 0.04% Hungarian12 0.03% Syrian12 0.03% Austrian12 0.03% West Indian10 0.03% Greek10 0.03% Canadian10 0.03% Armenian10 0.03% South African9 0.03% Lebanese5 0.01% Croatian4 0.01% Nigerian4 0.01% Eastern European
Geographical mobility in St. Joseph Same house 1 year ago 47,675 89.4% White (Caucasian)3,241 70.0% Black or African American227 68.5% American Indian / Alaska Native1,119 95.0% Asian213 98.1% Native Hawaiian / Pacific Islander2,251 89.5% Other race4,922 87.5% Two or more races47,320 89.4% White alone, not Hispanic / Latino4,667 82.3% Hispanic or LatinoMoved within same county 2,829 5.3% White / Caucasian372 8.0% Black or African American61 18.4% American Indian / Alaska Native47 4.0% Asian6 2.8% Native Hawaiian / Pacific Islander110 4.4% Other race239 4.2% Two or more races2,829 5.3% White alone, not Hispanic / Latino344 6.1% Hispanic or LatinoMoved within same state 1,841 3.5% White / Caucasian337 7.3% Black or African American54 16.3% American Indian / Alaska Native11 0.9% Asian237 4.2% Two or more races1,762 3.3% White alone, not Hispanic / Latino377 6.7% Hispanic or LatinoMoved from different state 932 1.7% White / Caucasian634 13.7% Black or African American2 0.6% American Indian / Alaska Native113 4.5% Other race101 1.8% Two or more races932 1.8% White alone, not Hispanic / Latino216 3.8% Hispanic or LatinoMoved from abroad 72 0.1% White6 0.1% Black or African American13 1.1% Asian22 0.9% Other race129 2.3% Two or more races72 0.1% White alone, not Hispanic / Latino89 1.6% Hispanic or Latino
Children Nativity (place of birth) in St. Joseph
Children under 6 years - Living with two parents Both parents native 2,387 99.9% Native3 0.1% Foreign-bornBoth parents foreign-born 160 91.6% Native15 8.4% Foreign-bornOne native, one foreign-born parent 98 100.0% NativeChildren under 6 years - Living with one parent Native parent 1,916 100.0% NativeForeign-born parent 214 100.0% NativeChildren 6 to 17 years - Living with two parents Both parents native 4,466 100.0% NativeBoth parents foreign-born 614 87.4% Native89 12.6% Foreign-bornOne native, one foreign-born parent 154 97.7% Native4 2.3% Foreign-bornChildren 6 to 17 years - Living with one parent Native parent 3,988 100.0% NativeForeign-born parent 297 52.2% Native273 47.8% Foreign-born
Grandparents responsible for own grandchildren in St. Joseph
Grandparents (30 to 59 years) White / Caucasian 140 42.9% Responsible for grandchildren186 57.1% Not responsible for grandchildrenBlack or African American 35 73.2% Responsible for grandchildren13 26.8% Not responsible for grandchildrenOther race 39 100.0% Not responsible for grandchildrenWhite alone, not Hispanic / Latino 140 42.9% Responsible for grandchildren186 57.1% Not responsible for grandchildrenHispanic or Latino 50 100.0% Not responsible for grandchildrenGrandparents (60 years and over) White / Caucasian 167 27.2% Responsible for grandchildren448 72.8% Not responsible for grandchildrenBlack or African American 10 100.0% Responsible for grandchildrenWhite alone, not Hispanic / Latino 167 27.2% Responsible for grandchildren448 72.8% Not responsible for grandchildrenHispanic or Latino 5 100.0% Not responsible for grandchildren