Races in Springfield, Illinois (IL) Detailed Stats
Data:
Races - White alone (%)
Races - White alone (% change since 2000)
Races - Black alone (%)
Races - Black alone (% change since 2000)
Races - American Indian alone (%)
Races - American Indian alone (% change since 2000)
Races - Asian alone (%)
Races - Asian alone (% change since 2000)
Races - Hispanic (%)
Races - Hispanic (% change since 2000)
Races - Native Hawaiian and Other Pacific Islander alone (%)
Races - Native Hawaiian and Other Pacific Islander alone (% change since 2000)
Races - Two or more races(%)
Races - Two or more races(% change since 2000)
Races - Other race alone (%)
Races - Other race alone (% change since 2000)
Racial diversity
Place of birth - Born in state of residence (%)
Place of birth - Born in state of residence (%) - White
Place of birth - Born in state of residence (%) - Black or African American
Place of birth - Born in state of residence (%) - Asian
Place of birth - Born in state of residence (%) - Hispanic or Latino
Place of birth - Born in state of residence (%) - American Indian and Alaska Native
Place of birth - Born in state of residence (%) - Multirace
Place of birth - Born in state of residence (%) - Other Race
Place of birth - Born in other state (%)
Place of birth - Born in other state (%) - White
Place of birth - Born in other state (%) - Black or African American
Place of birth - Born in other state (%) - Asian
Place of birth - Born in other state (%) - Hispanic or Latino
Place of birth - Born in other state (%) - American Indian and Alaska Native
Place of birth - Born in other state (%) - Multirace
Place of birth - Born in other state (%) - Other Race
Place of birth - Native, outside of US (%)
Place of birth - Native, outside of US (%) - White
Place of birth - Native, outside of US (%) - Black or African American
Place of birth - Native, outside of US (%) - Asian
Place of birth - Native, outside of US (%) - Hispanic or Latino
Place of birth - Native, outside of US (%) - American Indian and Alaska Native
Place of birth - Native, outside of US (%) - Multirace
Place of birth - Native, outside of US (%) - Other Race
Place of birth - Foreign born (%)
Place of birth - Foreign born (%) - White
Place of birth - Foreign born (%) - Black or African American
Place of birth - Foreign born (%) - Asian
Place of birth - Foreign born (%) - Hispanic or Latino
Place of birth - Foreign born (%) - American Indian and Alaska Native
Place of birth - Foreign born (%) - Multirace
Place of birth - Foreign born (%) - Other Race
Residents speaking English at home (%)
Residents speaking English at home - Born in the United States (%)
Residents speaking English at home - Native, born elsewhere (%)
Residents speaking English at home - Foreign born (%)
Residents speaking Spanish at home (%)
Residents speaking Spanish at home - Born in the United States (%)
Residents speaking Spanish at home - Native, born elsewhere (%)
Residents speaking Spanish at home - Foreign born (%)
Residents speaking other language at home (%)
Residents speaking other language at home - Born in the United States (%)
Residents speaking other language at home - Native, born elsewhere (%)
Residents speaking other language at home - Foreign born (%)
Marital status - Never married (%)
Marital status - Now married (%)
Marital status - Separated (%)
Marital status - Widowed (%)
Marital status - Divorced (%)
Ancestries Reported - Arab (%)
Ancestries Reported - Czech (%)
Ancestries Reported - Danish (%)
Ancestries Reported - Dutch (%)
Ancestries Reported - English (%)
Ancestries Reported - French (%)
Ancestries Reported - French Canadian (%)
Ancestries Reported - German (%)
Ancestries Reported - Greek (%)
Ancestries Reported - Hungarian (%)
Ancestries Reported - Irish (%)
Ancestries Reported - Italian (%)
Ancestries Reported - Lithuanian (%)
Ancestries Reported - Norwegian (%)
Ancestries Reported - Polish (%)
Ancestries Reported - Portuguese (%)
Ancestries Reported - Russian (%)
Ancestries Reported - Scotch-Irish (%)
Ancestries Reported - Scottish (%)
Ancestries Reported - Slovak (%)
Ancestries Reported - Subsaharan African (%)
Ancestries Reported - Swedish (%)
Ancestries Reported - Swiss (%)
Ancestries Reported - Ukrainian (%)
Ancestries Reported - United States (%)
Ancestries Reported - Welsh (%)
Ancestries Reported - West Indian (%)
Ancestries Reported - Other (%)
Geographical mobility - Same house 1 year ago (%)
Geographical mobility - Same house 1 year ago (%) - White
Geographical mobility - Same house 1 year ago (%) - Black or African American
Geographical mobility - Same house 1 year ago (%) - Asian
Geographical mobility - Same house 1 year ago (%) - Hispanic or Latino
Geographical mobility - Same house 1 year ago (%) - American Indian and Alaska Native
Geographical mobility - Same house 1 year ago (%) - Multirace
Geographical mobility - Same house 1 year ago (%) - Other Race
Geographical mobility - Moved within same county (%)
Geographical mobility - Moved within same county (%) - White
Geographical mobility - Moved within same county (%) - Black or African American
Geographical mobility - Moved within same county (%) - Asian
Geographical mobility - Moved within same county (%) - Hispanic or Latino
Geographical mobility - Moved within same county (%) - American Indian and Alaska Native
Geographical mobility - Moved within same county (%) - Multirace
Geographical mobility - Moved within same county (%) - Other Race
Geographical mobility - Moved from different county within same state (%)
Geographical mobility - Moved from different county within same state (%) - White
Geographical mobility - Moved from different county within same state (%) - Black or African American
Geographical mobility - Moved from different county within same state (%) - Asian
Geographical mobility - Moved from different county within same state (%) - Hispanic or Latino
Geographical mobility - Moved from different county within same state (%) - American Indian and Alaska Native
Geographical mobility - Moved from different county within same state (%) - Multirace
Geographical mobility - Moved from different county within same state (%) - Other Race
Geographical mobility - Moved from different state (%)
Geographical mobility - Moved from different state (%) - White
Geographical mobility - Moved from different state (%) - Black or African American
Geographical mobility - Moved from different state (%) - Asian
Geographical mobility - Moved from different state (%) - Hispanic or Latino
Geographical mobility - Moved from different state (%) - American Indian and Alaska Native
Geographical mobility - Moved from different state (%) - Multirace
Geographical mobility - Moved from different state (%) - Other Race
Geographical mobility - Moved from abroad (%)
Geographical mobility - Moved from abroad (%) - White
Geographical mobility - Moved from abroad (%) - Black or African American
Geographical mobility - Moved from abroad (%) - Asian
Geographical mobility - Moved from abroad (%) - Hispanic or Latino
Geographical mobility - Moved from abroad (%) - American Indian and Alaska Native
Geographical mobility - Moved from abroad (%) - Multirace
Geographical mobility - Moved from abroad (%) - Other Race
Place of birth for the foreign-born population - Ireland (%)
Place of birth for the foreign-born population - Denmark (%)
Place of birth for the foreign-born population - Norway (%)
Place of birth for the foreign-born population - Sweden (%)
Place of birth for the foreign-born population - United Kingdom (%)
Place of birth for the foreign-born population - England (%)
Place of birth for the foreign-born population - Scotland (%)
Place of birth for the foreign-born population - Other Northern Europe (%)
Place of birth for the foreign-born population - Austria (%)
Place of birth for the foreign-born population - Belgium (%)
Place of birth for the foreign-born population - France (%)
Place of birth for the foreign-born population - Germany (%)
Place of birth for the foreign-born population - Netherlands (%)
Place of birth for the foreign-born population - Switzerland (%)
Place of birth for the foreign-born population - Other Western Europe (%)
Place of birth for the foreign-born population - Greece (%)
Place of birth for the foreign-born population - Italy (%)
Place of birth for the foreign-born population - Portugal (%)
Place of birth for the foreign-born population - Spain (%)
Place of birth for the foreign-born population - Other Southern Europe (%)
Place of birth for the foreign-born population - Albania (%)
Place of birth for the foreign-born population - Belarus (%)
Place of birth for the foreign-born population - Bosnia and Herzegovina (%)
Place of birth for the foreign-born population - Bulgaria (%)
Place of birth for the foreign-born population - Croatia (%)
Place of birth for the foreign-born population - Czechoslovakia (%)
Place of birth for the foreign-born population - Hungary (%)
Place of birth for the foreign-born population - Latvia (%)
Place of birth for the foreign-born population - Lithuania (%)
Place of birth for the foreign-born population - North Macedonia (Macedonia) (%)
Place of birth for the foreign-born population - Moldova (%)
Place of birth for the foreign-born population - Poland (%)
Place of birth for the foreign-born population - Romania (%)
Place of birth for the foreign-born population - Russia (%)
Place of birth for the foreign-born population - Serbia (%)
Place of birth for the foreign-born population - Ukraine (%)
Place of birth for the foreign-born population - Other Eastern Europe (%)
Place of birth for the foreign-born population - China (%)
Place of birth for the foreign-born population - Hong Kong (%)
Place of birth for the foreign-born population - Taiwan (%)
Place of birth for the foreign-born population - Japan (%)
Place of birth for the foreign-born population - Korea (%)
Place of birth for the foreign-born population - Other Eastern Asia (%)
Place of birth for the foreign-born population - Afghanistan (%)
Place of birth for the foreign-born population - Bangladesh (%)
Place of birth for the foreign-born population - India (%)
Place of birth for the foreign-born population - Iran (%)
Place of birth for the foreign-born population - Kazakhstan (%)
Place of birth for the foreign-born population - Nepal (%)
Place of birth for the foreign-born population - Pakistan (%)
Place of birth for the foreign-born population - Sri Lanka (%)
Place of birth for the foreign-born population - Uzbekistan (%)
Place of birth for the foreign-born population - Other South Central Asia (%)
Place of birth for the foreign-born population - Burma (%)
Place of birth for the foreign-born population - Cambodia (%)
Place of birth for the foreign-born population - Indonesia (%)
Place of birth for the foreign-born population - Laos (%)
Place of birth for the foreign-born population - Malaysia (%)
Place of birth for the foreign-born population - Philippines (%)
Place of birth for the foreign-born population - Singapore (%)
Place of birth for the foreign-born population - Thailand (%)
Place of birth for the foreign-born population - Vietnam (%)
Place of birth for the foreign-born population - Other South Eastern Asia (%)
Place of birth for the foreign-born population - Armenia (%)
Place of birth for the foreign-born population - Iraq (%)
Place of birth for the foreign-born population - Israel (%)
Place of birth for the foreign-born population - Jordan (%)
Place of birth for the foreign-born population - Kuwait (%)
Place of birth for the foreign-born population - Lebanon (%)
Place of birth for the foreign-born population - Saudi Arabia (%)
Place of birth for the foreign-born population - Syria (%)
Place of birth for the foreign-born population - Turkey (%)
Place of birth for the foreign-born population - Yemen (%)
Place of birth for the foreign-born population - Other Western Asia (%)
Place of birth for the foreign-born population - Eritrea (%)
Place of birth for the foreign-born population - Ethiopia (%)
Place of birth for the foreign-born population - Kenya (%)
Place of birth for the foreign-born population - Somalia (%)
Place of birth for the foreign-born population - Uganda (%)
Place of birth for the foreign-born population - Zimbabwe (%)
Place of birth for the foreign-born population - Other Eastern Africa (%)
Place of birth for the foreign-born population - Cameroon (%)
Place of birth for the foreign-born population - Congo (%)
Place of birth for the foreign-born population - Democratic Republic of Congo (Zaire) (%)
Place of birth for the foreign-born population - Other Middle Africa (%)
Place of birth for the foreign-born population - Egypt (%)
Place of birth for the foreign-born population - Morocco (%)
Place of birth for the foreign-born population - Sudan (%)
Place of birth for the foreign-born population - Other Northern Africa (%)
Place of birth for the foreign-born population - South Africa (%)
Place of birth for the foreign-born population - Other Southern Africa (%)
Place of birth for the foreign-born population - Cabo Verde (%)
Place of birth for the foreign-born population - Ghana (%)
Place of birth for the foreign-born population - Liberia (%)
Place of birth for the foreign-born population - Nigeria (%)
Place of birth for the foreign-born population - Senegal (%)
Place of birth for the foreign-born population - Sierra Leone (%)
Place of birth for the foreign-born population - Other Western Africa (%)
Place of birth for the foreign-born population - Australia (%)
Place of birth for the foreign-born population - New Zealand (%)
Place of birth for the foreign-born population - Fiji (%)
Place of birth for the foreign-born population - Micronesia (%)
Place of birth for the foreign-born population - Bahamas (%)
Place of birth for the foreign-born population - Barbados (%)
Place of birth for the foreign-born population - Cuba (%)
Place of birth for the foreign-born population - Dominica (%)
Place of birth for the foreign-born population - Dominican Republic (%)
Place of birth for the foreign-born population - Grenada (%)
Place of birth for the foreign-born population - Haiti (%)
Place of birth for the foreign-born population - Jamaica (%)
Place of birth for the foreign-born population - St. Vincent and the Grenadines (%)
Place of birth for the foreign-born population - Trinidad and Tobago (%)
Place of birth for the foreign-born population - West Indies (%)
Place of birth for the foreign-born population - Other Caribbean (%)
Place of birth for the foreign-born population - Belize (%)
Place of birth for the foreign-born population - Costa Rica (%)
Place of birth for the foreign-born population - El Salvador (%)
Place of birth for the foreign-born population - Guatemala (%)
Place of birth for the foreign-born population - Honduras (%)
Place of birth for the foreign-born population - Mexico (%)
Place of birth for the foreign-born population - Nicaragua (%)
Place of birth for the foreign-born population - Panama (%)
Place of birth for the foreign-born population - Other Central America (%)
Place of birth for the foreign-born population - Argentina (%)
Place of birth for the foreign-born population - Bolivia (%)
Place of birth for the foreign-born population - Brazil (%)
Place of birth for the foreign-born population - Chile (%)
Place of birth for the foreign-born population - Colombia (%)
Place of birth for the foreign-born population - Ecuador (%)
Place of birth for the foreign-born population - Guyana (%)
Place of birth for the foreign-born population - Peru (%)
Place of birth for the foreign-born population - Uruguay (%)
Place of birth for the foreign-born population - Venezuela (%)
Place of birth for the foreign-born population - Other South America (%)
Place of birth for the foreign-born population - Canada (%)
Place of birth for the foreign-born population - Other Northern America (%)
Place of birth for the foreign-born population - Other (%)
Latest news about races in Springfield, IL collected exclusively by city-data.com from local newspapers, TV, and radio stations
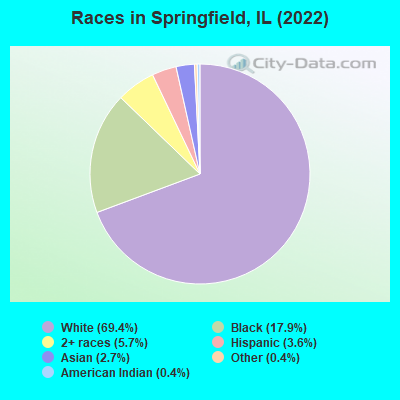
According to 2022 data, the most numerous races in Springfield, IL are White alone (78,676 residents), Hispanic (4,033 residents), and Black alone (20,307 residents). 93.3% of Springfield residents speak English at home. 4.3% of Springfield, IL residents are foreign-born (2.1% born in Asia, 0.8% born in Africa, 0.7% born in Latin America, 0.5% born in Europe), which is 227.2% less than the foreign-born rate of 14.0% across the entire state of Illinois.
Race distribution in Springfield
2000 2022
89,510 80.3% White alone 17,007 15.3% Black alone 1,612 1.4% Asian alone 1,551 1.4% Two or more races 1,337 1.2% Hispanic 204 0.2% Other race alone 203 0.2% American Indian alone 30 0.03% Native Hawaiian and Other
78,676 69.4% White alone 20,307 17.9% Black alone 6,420 5.7% Two or more races 4,033 3.6% Hispanic 3,068 2.7% Asian alone 418 0.4% Other race alone 409 0.4% American Indian alone
2000 2022
8,424,140 67.8% White alone 1,856,152 14.9% Black alone 1,530,262 12.3% Hispanic 419,916 3.4% Asian alone 153,996 1.2% Two or more races 13,479 0.1% Other race alone 18,232 0.1% American Indian alone 3,116 0.03% Native Hawaiian and Other
7,356,301 58.5% White alone 2,299,726 18.3% Hispanic 1,660,423 13.2% Black alone 747,296 5.9% Asian alone 458,599 3.6% Two or more races 45,386 0.4% Other race alone 10,405 0.08% American Indian alone 3,896 0.03% Native Hawaiian and Other
Income and house value in Springfield Median household income in 2022 $65,142 White non-Hispanic householders$28,300 Black householders$134,146 Asian householders$52,926 Some other race householders$40,700 Two or more races householders$41,968 Hispanic or Latino race householdersMedian 2022 house value $159,196 White Non-Hispanic householders$101,689 Black or African American householders$24,545 American Indian or Alaska Native householders $241,424 Asian householders$130,442 Some other race householders$149,553 Two or more races householders$131,494 Hispanic or Latino householders
Median age by race in Springfield
48.6 Median age for White residents43.1 51.2 30.4 Median age for Black or African American residents28.1 33.4 22.7 Median age for American Indian / Alaska Native residents21.2 26.6 32.4 Median age for Asian residents33.4 32.3 -666,666,666.0 Median age for Native Hawaiian / Pacific Islander residents-666,666,666.0 -666,666,666.0 37.4 Median age for Other race residents37.7 27.8 24.5 Median age for Two or more races residents24.8 24.3 49.2 Median age for White alone residents44.1 51.7 27.1 Median age for Hispanic or Latino residents16.8 28.8
Owner/renter occupied households by race in Springfield
House owners and renters - White residents 29,794 76.6% Owner occupied9,126 23.4% Renter occupiedHouse owners and renters - Black or African American residents 2,199 28.2% Owner occupied5,591 71.8% Renter occupiedHouse owners and renters - American Indian / Alaska Native residents 14 40.3% Owner occupied20 59.7% Renter occupiedHouse owners and renters - Asian residents 625 62.4% Owner occupied377 37.6% Renter occupiedHouse owners and renters - Other race residents 152 64.4% Owner occupied84 35.6% Renter occupiedHouse owners and renters - Two or more races residents 1,242 53.7% Owner occupied1,073 46.3% Renter occupiedHouse owners and renters - White alone residents 29,278 76.6% Owner occupied8,948 23.4% Renter occupiedHouse owners and renters - Hispanic or Latino residents 827 51.0% Owner occupied793 49.0% Renter occupied
Language usage in Springfield
English speakers - Total 93.3% of residents of Springfield speak English at home.
2.1% of residents speak Spanish at home 2,028 89.1% Speak English very well247 10.9% Speak English less than very well4.6% of residents speak other language at home 3,288 65.1% Speak English very well1,764 34.9% Speak English less than very well
English speakers - Born in the United States 92.4% of residents of Springfield speak English at home.
3.4% of residents speak Spanish at home 425 80.6% Speak English very well102 19.4% Speak English less than very well4.2% of residents speak other language at home 633 96.6% Speak English very well22 3.4% Speak English less than very well
English speakers - Native, born elsewhere 57.6% of residents of Springfield speak English at home.
42.4% of residents speak Spanish at home 318 89.1% Speak English very well39 10.9% Speak English less than very well
English speakers - Foreign-born 23.7% of residents of Springfield speak English at home.
14.7% of residents speak Spanish at home 800 95.2% Speak English very well40 4.8% Speak English less than very well61.6% of residents speak other language at home 2,336 66.2% Speak English very well1,191 33.8% Speak English less than very well
White (Caucasian) - Speak only English Native:
98.5% (75,880)Foreign-born:
24.2% (304)
White (Caucasian) - Speak another language Native:
1.5% (1,151)Foreign-born:
75.8% (954)
Black or African American - Speak only English Native:
98.8% (19,067)Foreign-born:
16.8% (131)
Black or African American - Speak another language Native:
1.2% (239)Foreign-born:
80.8% (633)
Asian - Speak only English Native:
59.3% (635)Foreign-born:
18.8% (351)
Asian - Speak another language Native:
40.7% (436)Foreign-born:
81.2% (1,519)
Other race - Speak only English Native:
72.4% (460)Foreign-born:
29.9% (33)
Other race - Speak another language Native:
32.3% (205)Foreign-born:
70.5% (79)
Two or more races - Speak only English Native:
87.5% (5,948)Foreign-born:
42.7% (211)
Two or more races - Speak another language Native:
10.8% (732)Foreign-born:
100.0% (493)
White alone - Speak only English Native:
98.6% (74,399)Foreign-born:
29.0% (304)
White alone - Speak another language Native:
1.4% (1,067)Foreign-born:
71.0% (743)
Hispanic or Latino - Speak another language Native:
28.4% (941)Foreign-born:
100.0% (552)
Foreign-born residents in Springfield 4,847 residents are foreign born (2.1% Asia , 0.8% Africa , 0.7% Latin America , 0.5% Europe ).
This city:
4.3%Illinois:
14.1%
Marital status for residents in Springfield Marital status - White (Caucasian) population 15 years and over
Males 31.4% Never married54.8% Now married0.9% Separated2.5% Widowed10.4% DivorcedFemales 28.3% Never married45.7% Now married1.3% Separated9.6% Widowed15.1% DivorcedWomen who gave birth in the past 12 months Now married:
72.8% (634)Unmarried:
27.2% (237)
Women who did not give birth in the past 12 months Now married:
41.3% (6,730)Unmarried:
58.7% (9,548)
Marital status - Black or African American population 15 years and over
Males 60.7% Never married25.7% Now married2.9% Separated2.6% Widowed8.0% DivorcedFemales 64.5% Never married11.1% Now married1.7% Separated5.6% Widowed17.1% DivorcedWomen who gave birth in the past 12 months Now married:
10.7% (80)Unmarried:
89.3% (670)
Women who did not give birth in the past 12 months Now married:
9.6% (479)Unmarried:
90.4% (4,488)
Marital status - American Indian / Alaska Native population 15 years and over
Males 68.5% Never married26.1% Now married0.0% Separated2.2% Widowed3.3% DivorcedFemales 76.1% Never married10.9% Now married0.0% Separated13.0% Widowed0.0% DivorcedWomen who gave birth in the past 12 months Now married:
0.0% (0)Unmarried:
100.0% (30)
Women who did not give birth in the past 12 months Now married:
22.7% (8)Unmarried:
77.3% (28)
Marital status - Asian population 15 years and over
Males 45.4% Never married50.7% Now married0.0% Separated1.2% Widowed2.7% DivorcedFemales 39.5% Never married54.3% Now married0.0% Separated1.0% Widowed5.2% DivorcedWomen who gave birth in the past 12 months Now married:
57.1% (24)Unmarried:
42.9% (18)
Women who did not give birth in the past 12 months Now married:
51.1% (564)Unmarried:
48.9% (539)
Marital status - Other race population 15 years and over
Males 63.7% Never married30.2% Now married3.8% Separated0.0% Widowed2.3% DivorcedFemales 31.6% Never married46.2% Now married0.8% Separated0.0% Widowed21.4% DivorcedWomen who did not give birth in the past 12 months Now married:
10.8% (19)Unmarried:
89.2% (153)
Marital status - Two or more races population 15 years and over
Males 62.8% Never married28.3% Now married0.0% Separated0.0% Widowed8.8% DivorcedFemales 55.0% Never married26.9% Now married1.7% Separated3.3% Widowed13.1% DivorcedWomen who gave birth in the past 12 months Now married:
65.9% (39)Unmarried:
34.1% (20)
Women who did not give birth in the past 12 months Now married:
22.7% (427)Unmarried:
77.3% (1,457)
Marital status - White alone, not Hispanic / Latino population 15 years and over
Males 30.5% Never married55.4% Now married0.9% Separated2.5% Widowed10.7% DivorcedFemales 28.3% Never married46.0% Now married1.4% Separated9.7% Widowed14.6% DivorcedWomen who gave birth in the past 12 months Now married:
70.8% (575)Unmarried:
29.2% (237)
Women who did not give birth in the past 12 months Now married:
42.2% (6,641)Unmarried:
57.8% (9,105)
Marital status - Hispanic or Latino population 15 years and over
Males 48.2% Never married41.5% Now married0.8% Separated0.0% Widowed9.4% DivorcedFemales 41.4% Never married37.4% Now married1.5% Separated4.3% Widowed15.3% DivorcedWomen who gave birth in the past 12 months Now married:
100.0% (52)Unmarried:
0.0% (0)
Women who did not give birth in the past 12 months Now married:
37.5% (384)Unmarried:
62.5% (642)
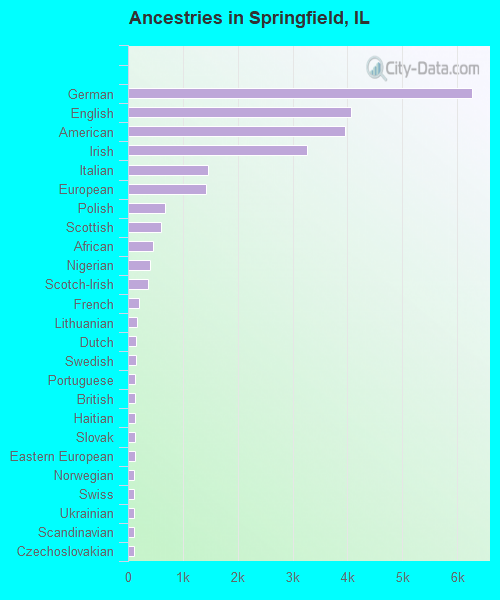
Ancestries in Springfield
6,268 12.0% German4,058 7.8% English3,955 7.6% American3,266 6.3% Irish1,461 2.8% Italian1,419 2.7% European682 1.3% Polish593 1.1% Scottish447 0.9% African394 0.8% Nigerian370 0.7% Scotch-Irish205 0.4% French171 0.3% Lithuanian142 0.3% Dutch137 0.3% Swedish130 0.2% Portuguese128 0.2% British125 0.2% Haitian123 0.2% Slovak121 0.2% Eastern European118 0.2% Norwegian117 0.2% Swiss115 0.2% Ukrainian111 0.2% Scandinavian110 0.2% Czechoslovakian108 0.2% Czech73 0.1% Welsh66 0.1% Danish60 0.1% Hungarian56 0.1% Russian44 0.08% Syrian41 0.08% Northern European38 0.07% French Canadian33 0.06% Croatian31 0.06% Iranian31 0.06% Palestinian30 0.06% Belizean25 0.05% Greek22 0.04% Pennsylvania German22 0.04% Austrian19 0.04% Icelander19 0.04% Canadian18 0.03% Romanian18 0.03% Turkish14 0.03% Slovene14 0.03% Bulgarian12 0.02% Ghanaian11 0.02% Egyptian10 0.02% Jordanian10 0.02% Somali10 0.02% Moroccan8 0.02% Iraqi8 0.02% Jamaican8 0.02% Lebanese7 0.01% Serbian6 0.01% Cajun
Geographical mobility in Springfield Same house 1 year ago 70,659 88.3% White (Caucasian)16,364 75.7% Black or African American171 75.1% American Indian / Alaska Native3,195 84.5% Asian698 87.0% Other race6,698 82.3% Two or more races69,098 88.3% White alone, not Hispanic / Latino3,006 83.1% Hispanic or LatinoMoved within same county 6,790 8.5% White / Caucasian3,719 17.2% Black or African American29 12.6% American Indian / Alaska Native224 5.9% Asian49 6.1% Other race1,054 12.9% Two or more races6,701 8.6% White alone, not Hispanic / Latino347 9.6% Hispanic or LatinoMoved within same state 1,812 2.3% White / Caucasian678 3.1% Black or African American2 0.8% American Indian / Alaska Native134 3.5% Asian23 2.9% Other race213 2.6% Two or more races1,775 2.3% White alone, not Hispanic / Latino133 3.7% Hispanic or LatinoMoved from different state 689 0.9% White / Caucasian493 2.3% Black or African American26 11.5% American Indian / Alaska Native80 2.1% Asian34 4.2% Other race132 1.6% Two or more races600 0.8% White alone, not Hispanic / Latino137 3.8% Hispanic or LatinoMoved from abroad 115 0.1% White27 0.1% Black or African American108 2.8% Asian27 0.3% Two or more races115 0.1% White alone, not Hispanic / Latino11 0.3% Hispanic or Latino
Children Nativity (place of birth) in Springfield
Children under 6 years - Living with two parents Both parents native 3,232 100.0% NativeBoth parents foreign-born 317 83.0% Native65 17.0% Foreign-bornOne native, one foreign-born parent 167 100.0% NativeChildren under 6 years - Living with one parent Native parent 3,139 100.0% NativeForeign-born parent 68 100.0% NativeChildren 6 to 17 years - Living with two parents Both parents native 6,072 99.1% Native55 0.9% Foreign-bornBoth parents foreign-born 396 70.4% Native167 29.6% Foreign-bornOne native, one foreign-born parent 671 100.0% NativeChildren 6 to 17 years - Living with one parent Native parent 7,681 100.0% NativeForeign-born parent 244 56.4% Native188 43.6% Foreign-born
Grandparents responsible for own grandchildren in Springfield
Grandparents (30 to 59 years) White / Caucasian 263 59.8% Responsible for grandchildren177 40.2% Not responsible for grandchildrenBlack or African American 185 82.0% Responsible for grandchildren41 18.0% Not responsible for grandchildrenAsian 11 100.0% Not responsible for grandchildrenWhite alone, not Hispanic / Latino 263 54.6% Responsible for grandchildren219 45.4% Not responsible for grandchildrenGrandparents (60 years and over) White / Caucasian 199 62.0% Responsible for grandchildren122 38.0% Not responsible for grandchildrenBlack or African American 125 58.5% Responsible for grandchildren88 41.5% Not responsible for grandchildrenAsian 22 100.0% Not responsible for grandchildrenWhite alone, not Hispanic / Latino 199 62.0% Responsible for grandchildren122 38.0% Not responsible for grandchildren