Races in Springdale, New Jersey (NJ) Detailed Stats
Data:
Races - White alone (%)
Races - White alone (% change since 2000)
Races - Black alone (%)
Races - Black alone (% change since 2000)
Races - American Indian alone (%)
Races - American Indian alone (% change since 2000)
Races - Asian alone (%)
Races - Asian alone (% change since 2000)
Races - Hispanic (%)
Races - Hispanic (% change since 2000)
Races - Native Hawaiian and Other Pacific Islander alone (%)
Races - Native Hawaiian and Other Pacific Islander alone (% change since 2000)
Races - Two or more races(%)
Races - Two or more races(% change since 2000)
Races - Other race alone (%)
Races - Other race alone (% change since 2000)
Racial diversity
Place of birth - Born in state of residence (%)
Place of birth - Born in state of residence (%) - White
Place of birth - Born in state of residence (%) - Black or African American
Place of birth - Born in state of residence (%) - Asian
Place of birth - Born in state of residence (%) - Hispanic or Latino
Place of birth - Born in state of residence (%) - American Indian and Alaska Native
Place of birth - Born in state of residence (%) - Multirace
Place of birth - Born in state of residence (%) - Other Race
Place of birth - Born in other state (%)
Place of birth - Born in other state (%) - White
Place of birth - Born in other state (%) - Black or African American
Place of birth - Born in other state (%) - Asian
Place of birth - Born in other state (%) - Hispanic or Latino
Place of birth - Born in other state (%) - American Indian and Alaska Native
Place of birth - Born in other state (%) - Multirace
Place of birth - Born in other state (%) - Other Race
Place of birth - Native, outside of US (%)
Place of birth - Native, outside of US (%) - White
Place of birth - Native, outside of US (%) - Black or African American
Place of birth - Native, outside of US (%) - Asian
Place of birth - Native, outside of US (%) - Hispanic or Latino
Place of birth - Native, outside of US (%) - American Indian and Alaska Native
Place of birth - Native, outside of US (%) - Multirace
Place of birth - Native, outside of US (%) - Other Race
Place of birth - Foreign born (%)
Place of birth - Foreign born (%) - White
Place of birth - Foreign born (%) - Black or African American
Place of birth - Foreign born (%) - Asian
Place of birth - Foreign born (%) - Hispanic or Latino
Place of birth - Foreign born (%) - American Indian and Alaska Native
Place of birth - Foreign born (%) - Multirace
Place of birth - Foreign born (%) - Other Race
Residents speaking English at home (%)
Residents speaking English at home - Born in the United States (%)
Residents speaking English at home - Native, born elsewhere (%)
Residents speaking English at home - Foreign born (%)
Residents speaking Spanish at home (%)
Residents speaking Spanish at home - Born in the United States (%)
Residents speaking Spanish at home - Native, born elsewhere (%)
Residents speaking Spanish at home - Foreign born (%)
Residents speaking other language at home (%)
Residents speaking other language at home - Born in the United States (%)
Residents speaking other language at home - Native, born elsewhere (%)
Residents speaking other language at home - Foreign born (%)
Marital status - Never married (%)
Marital status - Now married (%)
Marital status - Separated (%)
Marital status - Widowed (%)
Marital status - Divorced (%)
Ancestries Reported - Arab (%)
Ancestries Reported - Czech (%)
Ancestries Reported - Danish (%)
Ancestries Reported - Dutch (%)
Ancestries Reported - English (%)
Ancestries Reported - French (%)
Ancestries Reported - French Canadian (%)
Ancestries Reported - German (%)
Ancestries Reported - Greek (%)
Ancestries Reported - Hungarian (%)
Ancestries Reported - Irish (%)
Ancestries Reported - Italian (%)
Ancestries Reported - Lithuanian (%)
Ancestries Reported - Norwegian (%)
Ancestries Reported - Polish (%)
Ancestries Reported - Portuguese (%)
Ancestries Reported - Russian (%)
Ancestries Reported - Scotch-Irish (%)
Ancestries Reported - Scottish (%)
Ancestries Reported - Slovak (%)
Ancestries Reported - Subsaharan African (%)
Ancestries Reported - Swedish (%)
Ancestries Reported - Swiss (%)
Ancestries Reported - Ukrainian (%)
Ancestries Reported - United States (%)
Ancestries Reported - Welsh (%)
Ancestries Reported - West Indian (%)
Ancestries Reported - Other (%)
Geographical mobility - Same house 1 year ago (%)
Geographical mobility - Same house 1 year ago (%) - White
Geographical mobility - Same house 1 year ago (%) - Black or African American
Geographical mobility - Same house 1 year ago (%) - Asian
Geographical mobility - Same house 1 year ago (%) - Hispanic or Latino
Geographical mobility - Same house 1 year ago (%) - American Indian and Alaska Native
Geographical mobility - Same house 1 year ago (%) - Multirace
Geographical mobility - Same house 1 year ago (%) - Other Race
Geographical mobility - Moved within same county (%)
Geographical mobility - Moved within same county (%) - White
Geographical mobility - Moved within same county (%) - Black or African American
Geographical mobility - Moved within same county (%) - Asian
Geographical mobility - Moved within same county (%) - Hispanic or Latino
Geographical mobility - Moved within same county (%) - American Indian and Alaska Native
Geographical mobility - Moved within same county (%) - Multirace
Geographical mobility - Moved within same county (%) - Other Race
Geographical mobility - Moved from different county within same state (%)
Geographical mobility - Moved from different county within same state (%) - White
Geographical mobility - Moved from different county within same state (%) - Black or African American
Geographical mobility - Moved from different county within same state (%) - Asian
Geographical mobility - Moved from different county within same state (%) - Hispanic or Latino
Geographical mobility - Moved from different county within same state (%) - American Indian and Alaska Native
Geographical mobility - Moved from different county within same state (%) - Multirace
Geographical mobility - Moved from different county within same state (%) - Other Race
Geographical mobility - Moved from different state (%)
Geographical mobility - Moved from different state (%) - White
Geographical mobility - Moved from different state (%) - Black or African American
Geographical mobility - Moved from different state (%) - Asian
Geographical mobility - Moved from different state (%) - Hispanic or Latino
Geographical mobility - Moved from different state (%) - American Indian and Alaska Native
Geographical mobility - Moved from different state (%) - Multirace
Geographical mobility - Moved from different state (%) - Other Race
Geographical mobility - Moved from abroad (%)
Geographical mobility - Moved from abroad (%) - White
Geographical mobility - Moved from abroad (%) - Black or African American
Geographical mobility - Moved from abroad (%) - Asian
Geographical mobility - Moved from abroad (%) - Hispanic or Latino
Geographical mobility - Moved from abroad (%) - American Indian and Alaska Native
Geographical mobility - Moved from abroad (%) - Multirace
Geographical mobility - Moved from abroad (%) - Other Race
Place of birth for the foreign-born population - Ireland (%)
Place of birth for the foreign-born population - Denmark (%)
Place of birth for the foreign-born population - Norway (%)
Place of birth for the foreign-born population - Sweden (%)
Place of birth for the foreign-born population - United Kingdom (%)
Place of birth for the foreign-born population - England (%)
Place of birth for the foreign-born population - Scotland (%)
Place of birth for the foreign-born population - Other Northern Europe (%)
Place of birth for the foreign-born population - Austria (%)
Place of birth for the foreign-born population - Belgium (%)
Place of birth for the foreign-born population - France (%)
Place of birth for the foreign-born population - Germany (%)
Place of birth for the foreign-born population - Netherlands (%)
Place of birth for the foreign-born population - Switzerland (%)
Place of birth for the foreign-born population - Other Western Europe (%)
Place of birth for the foreign-born population - Greece (%)
Place of birth for the foreign-born population - Italy (%)
Place of birth for the foreign-born population - Portugal (%)
Place of birth for the foreign-born population - Spain (%)
Place of birth for the foreign-born population - Other Southern Europe (%)
Place of birth for the foreign-born population - Albania (%)
Place of birth for the foreign-born population - Belarus (%)
Place of birth for the foreign-born population - Bosnia and Herzegovina (%)
Place of birth for the foreign-born population - Bulgaria (%)
Place of birth for the foreign-born population - Croatia (%)
Place of birth for the foreign-born population - Czechoslovakia (%)
Place of birth for the foreign-born population - Hungary (%)
Place of birth for the foreign-born population - Latvia (%)
Place of birth for the foreign-born population - Lithuania (%)
Place of birth for the foreign-born population - North Macedonia (Macedonia) (%)
Place of birth for the foreign-born population - Moldova (%)
Place of birth for the foreign-born population - Poland (%)
Place of birth for the foreign-born population - Romania (%)
Place of birth for the foreign-born population - Russia (%)
Place of birth for the foreign-born population - Serbia (%)
Place of birth for the foreign-born population - Ukraine (%)
Place of birth for the foreign-born population - Other Eastern Europe (%)
Place of birth for the foreign-born population - China (%)
Place of birth for the foreign-born population - Hong Kong (%)
Place of birth for the foreign-born population - Taiwan (%)
Place of birth for the foreign-born population - Japan (%)
Place of birth for the foreign-born population - Korea (%)
Place of birth for the foreign-born population - Other Eastern Asia (%)
Place of birth for the foreign-born population - Afghanistan (%)
Place of birth for the foreign-born population - Bangladesh (%)
Place of birth for the foreign-born population - India (%)
Place of birth for the foreign-born population - Iran (%)
Place of birth for the foreign-born population - Kazakhstan (%)
Place of birth for the foreign-born population - Nepal (%)
Place of birth for the foreign-born population - Pakistan (%)
Place of birth for the foreign-born population - Sri Lanka (%)
Place of birth for the foreign-born population - Uzbekistan (%)
Place of birth for the foreign-born population - Other South Central Asia (%)
Place of birth for the foreign-born population - Burma (%)
Place of birth for the foreign-born population - Cambodia (%)
Place of birth for the foreign-born population - Indonesia (%)
Place of birth for the foreign-born population - Laos (%)
Place of birth for the foreign-born population - Malaysia (%)
Place of birth for the foreign-born population - Philippines (%)
Place of birth for the foreign-born population - Singapore (%)
Place of birth for the foreign-born population - Thailand (%)
Place of birth for the foreign-born population - Vietnam (%)
Place of birth for the foreign-born population - Other South Eastern Asia (%)
Place of birth for the foreign-born population - Armenia (%)
Place of birth for the foreign-born population - Iraq (%)
Place of birth for the foreign-born population - Israel (%)
Place of birth for the foreign-born population - Jordan (%)
Place of birth for the foreign-born population - Kuwait (%)
Place of birth for the foreign-born population - Lebanon (%)
Place of birth for the foreign-born population - Saudi Arabia (%)
Place of birth for the foreign-born population - Syria (%)
Place of birth for the foreign-born population - Turkey (%)
Place of birth for the foreign-born population - Yemen (%)
Place of birth for the foreign-born population - Other Western Asia (%)
Place of birth for the foreign-born population - Eritrea (%)
Place of birth for the foreign-born population - Ethiopia (%)
Place of birth for the foreign-born population - Kenya (%)
Place of birth for the foreign-born population - Somalia (%)
Place of birth for the foreign-born population - Uganda (%)
Place of birth for the foreign-born population - Zimbabwe (%)
Place of birth for the foreign-born population - Other Eastern Africa (%)
Place of birth for the foreign-born population - Cameroon (%)
Place of birth for the foreign-born population - Congo (%)
Place of birth for the foreign-born population - Democratic Republic of Congo (Zaire) (%)
Place of birth for the foreign-born population - Other Middle Africa (%)
Place of birth for the foreign-born population - Egypt (%)
Place of birth for the foreign-born population - Morocco (%)
Place of birth for the foreign-born population - Sudan (%)
Place of birth for the foreign-born population - Other Northern Africa (%)
Place of birth for the foreign-born population - South Africa (%)
Place of birth for the foreign-born population - Other Southern Africa (%)
Place of birth for the foreign-born population - Cabo Verde (%)
Place of birth for the foreign-born population - Ghana (%)
Place of birth for the foreign-born population - Liberia (%)
Place of birth for the foreign-born population - Nigeria (%)
Place of birth for the foreign-born population - Senegal (%)
Place of birth for the foreign-born population - Sierra Leone (%)
Place of birth for the foreign-born population - Other Western Africa (%)
Place of birth for the foreign-born population - Australia (%)
Place of birth for the foreign-born population - New Zealand (%)
Place of birth for the foreign-born population - Fiji (%)
Place of birth for the foreign-born population - Micronesia (%)
Place of birth for the foreign-born population - Bahamas (%)
Place of birth for the foreign-born population - Barbados (%)
Place of birth for the foreign-born population - Cuba (%)
Place of birth for the foreign-born population - Dominica (%)
Place of birth for the foreign-born population - Dominican Republic (%)
Place of birth for the foreign-born population - Grenada (%)
Place of birth for the foreign-born population - Haiti (%)
Place of birth for the foreign-born population - Jamaica (%)
Place of birth for the foreign-born population - St. Vincent and the Grenadines (%)
Place of birth for the foreign-born population - Trinidad and Tobago (%)
Place of birth for the foreign-born population - West Indies (%)
Place of birth for the foreign-born population - Other Caribbean (%)
Place of birth for the foreign-born population - Belize (%)
Place of birth for the foreign-born population - Costa Rica (%)
Place of birth for the foreign-born population - El Salvador (%)
Place of birth for the foreign-born population - Guatemala (%)
Place of birth for the foreign-born population - Honduras (%)
Place of birth for the foreign-born population - Mexico (%)
Place of birth for the foreign-born population - Nicaragua (%)
Place of birth for the foreign-born population - Panama (%)
Place of birth for the foreign-born population - Other Central America (%)
Place of birth for the foreign-born population - Argentina (%)
Place of birth for the foreign-born population - Bolivia (%)
Place of birth for the foreign-born population - Brazil (%)
Place of birth for the foreign-born population - Chile (%)
Place of birth for the foreign-born population - Colombia (%)
Place of birth for the foreign-born population - Ecuador (%)
Place of birth for the foreign-born population - Guyana (%)
Place of birth for the foreign-born population - Peru (%)
Place of birth for the foreign-born population - Uruguay (%)
Place of birth for the foreign-born population - Venezuela (%)
Place of birth for the foreign-born population - Other South America (%)
Place of birth for the foreign-born population - Canada (%)
Place of birth for the foreign-born population - Other Northern America (%)
Place of birth for the foreign-born population - Other (%)
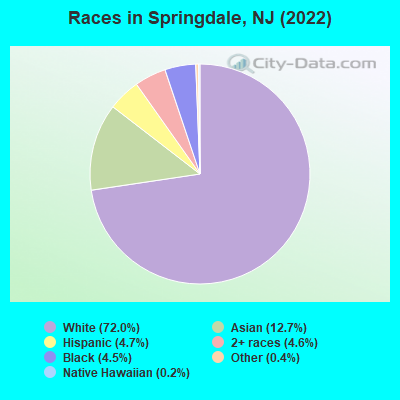
According to 2022 data, the most numerous races in Springdale, NJ are White alone (11,021 residents), Hispanic (725 residents), and Black alone (682 residents). 75.4% of Springdale residents speak English at home. 18.8% of Springdale, NJ residents are foreign-born (10.7% born in Asia, 4.6% born in Europe), which is 22.5% less than the foreign-born rate of 23.0% across the entire state of New Jersey.
Race distribution in Springdale
2000 2022
5,557,209 66.0% White alone 1,117,191 13.3% Hispanic 1,096,171 13.0% Black alone 477,012 5.7% Asian alone 133,689 1.6% Two or more races 19,565 0.2% Other race alone 11,338 0.1% American Indian alone 2,175 0.03% Native Hawaiian and Other
4,766,476 51.5% White alone 2,028,470 21.9% Hispanic 1,111,632 12.0% Black alone 923,546 10.0% Asian alone 332,237 3.6% Two or more races 89,847 1.0% Other race alone 8,557 0.09% American Indian alone 934 0.01% Native Hawaiian and Other
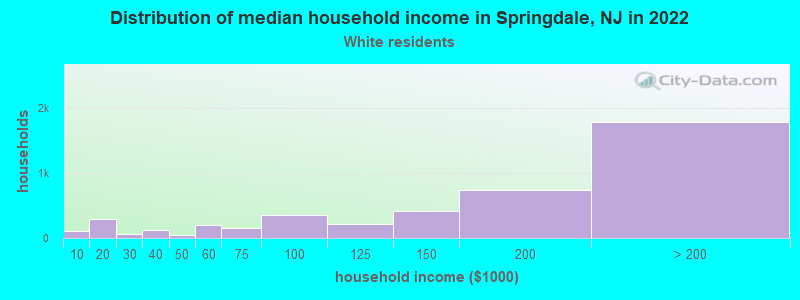
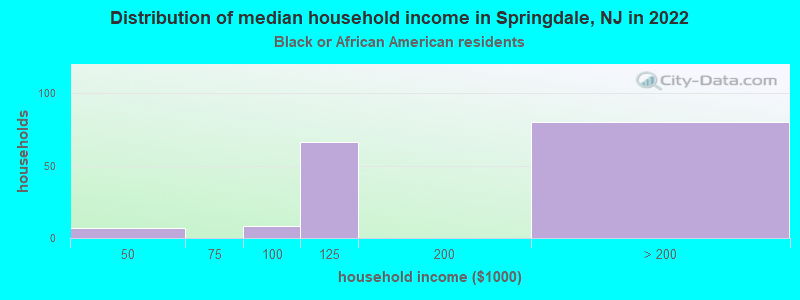
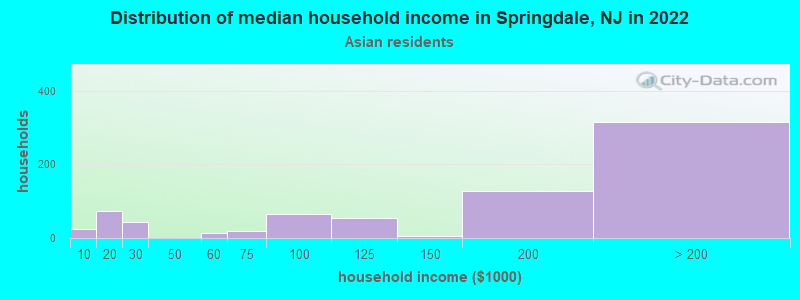
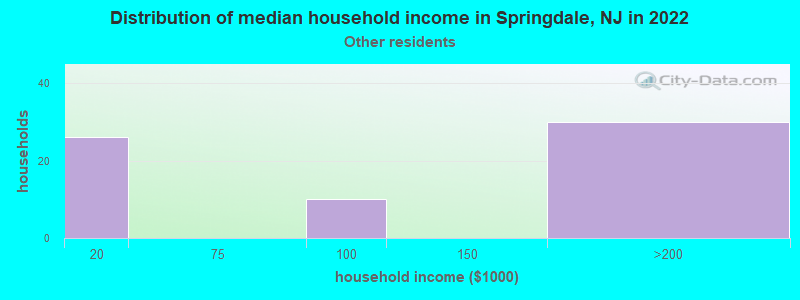
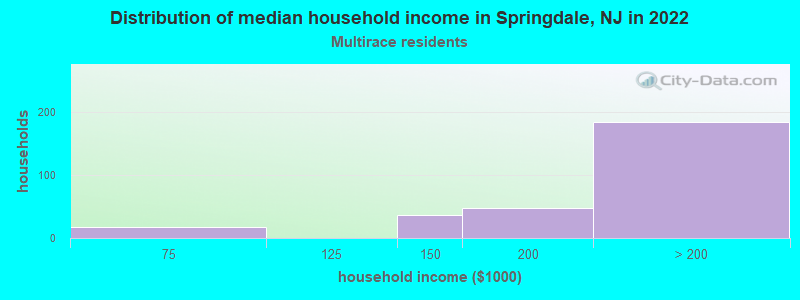
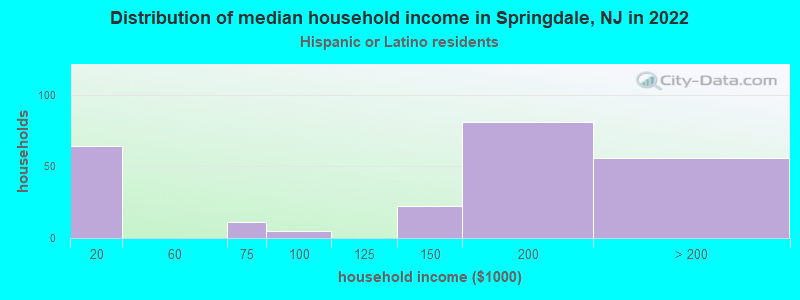
Income and house value in Springdale Median household income in 2022 $164,616 White non-Hispanic householdersover $200,000 Black householders$188,334 Asian householdersover $200,000 Two or more races householdersMedian 2022 house value $498,262 White Non-Hispanic householders$525,596 Black or African American householders$220,060 American Indian or Alaska Native householders $432,244 Asian householders$687,745 Two or more races householders$400,046 Hispanic or Latino householders
Median age by race in Springdale
50.3 Median age for White residents47.5 52.2 35.0 Median age for Black or African American residents44.5 33.1 -676,272,813.9 Median age for American Indian / Alaska Native residents-670,465,336.5 -688,298,917.7 53.0 Median age for Asian residents50.8 54.3 18.3 Median age for Native Hawaiian / Pacific Islander residents22.6 12.8 56.2 Median age for Other race residents41.8 74.8 13.6 Median age for Two or more races residents12.6 16.1 49.9 Median age for White alone residents46.6 52.3 45.2 Median age for Hispanic or Latino residents40.9 46.3
Owner/renter occupied households by race in Springdale
House owners and renters - White residents 3,730 85.0% Owner occupied657 15.0% Renter occupiedHouse owners and renters - Black or African American residents 135 94.1% Owner occupied9 5.9% Renter occupiedHouse owners and renters - Asian residents 787 96.1% Owner occupied32 3.9% Renter occupiedHouse owners and renters - Native Hawaiian / Pacific Islander residents 7 100.0% Owner occupiedHouse owners and renters - Other race residents 41 50.5% Owner occupied40 49.5% Renter occupiedHouse owners and renters - Two or more races residents 237 94.7% Owner occupied13 5.3% Renter occupiedHouse owners and renters - White alone residents 3,740 85.3% Owner occupied644 14.7% Renter occupiedHouse owners and renters - Hispanic or Latino residents 155 59.5% Owner occupied105 40.5% Renter occupied
Language usage in Springdale
English speakers - Total 75.4% of residents of Springdale speak English at home.
3.5% of residents speak Spanish at home 228 44.4% Speak English very well285 55.6% Speak English less than very well18.7% of residents speak other language at home 1,510 55.5% Speak English very well1,211 44.5% Speak English less than very well
English speakers - Born in the United States 96.2% of residents of Springdale speak English at home.
4.7% of residents speak other language at home 282 84.7% Speak English very well51 15.3% Speak English less than very well
English speakers - Native, born elsewhere 13.3% of residents of Springdale speak English at home.
68.4% of residents speak Spanish at home 37 18.4% Speak English very well164 81.6% Speak English less than very well12.9% of residents speak other language at home 38 100.0% Speak English very well
English speakers - Foreign-born 16.7% of residents of Springdale speak English at home.
5.0% of residents speak Spanish at home 93 62.8% Speak English very well55 37.2% Speak English less than very well66.9% of residents speak other language at home 864 43.9% Speak English very well1,104 56.1% Speak English less than very well
White (Caucasian) - Speak only English Native:
94.8% (9,030)Foreign-born:
20.5% (166)
White (Caucasian) - Speak another language Native:
5.1% (489)Foreign-born:
79.7% (643)
Black or African American - Speak only English Native:
84.4% (433)Foreign-born:
100.0% (80)
Asian - Speak only English Native:
49.7% (249)Foreign-born:
11.2% (157)
Asian - Speak another language Native:
47.9% (239)Foreign-born:
88.9% (1,249)
Native Hawaiian / Pacific Islander - Speak only English Native:
99.5% (38)Foreign-born:
96.3% (12)
Other race - Speak another language Native:
54.5% (94)Foreign-born:
99.7% (50)
Two or more races - Speak only English Native:
74.1% (525)Foreign-born:
15.6% (24)
Two or more races - Speak another language Native:
25.9% (183)Foreign-born:
74.2% (115)
White alone - Speak only English Native:
94.6% (9,038)Foreign-born:
18.7% (175)
White alone - Speak another language Native:
6.0% (573)Foreign-born:
82.8% (776)
Hispanic or Latino - Speak only English Native:
32.8% (145)Foreign-born:
18.3% (37)
Hispanic or Latino - Speak another language Native:
67.5% (298)Foreign-born:
76.7% (153)
Foreign-born residents in Springdale 2,875 residents are foreign born (10.7% Asia , 4.6% Europe ).
This city:
18.8%New Jersey:
23.2%
Marital status for residents in Springdale Marital status - White (Caucasian) population 15 years and over
Males 23.8% Never married66.6% Now married2.8% Separated2.3% Widowed4.5% DivorcedFemales 18.8% Never married63.6% Now married0.4% Separated9.5% Widowed7.7% DivorcedWomen who gave birth in the past 12 months Now married:
80.4% (73)Unmarried:
19.6% (18)
Women who did not give birth in the past 12 months Now married:
56.5% (972)Unmarried:
43.5% (748)
Marital status - Black or African American population 15 years and over
Males 13.9% Never married82.9% Now married0.0% Separated3.3% Widowed0.0% DivorcedFemales 18.3% Never married67.4% Now married0.0% Separated8.7% Widowed5.5% DivorcedWomen who did not give birth in the past 12 months Now married:
82.3% (112)Unmarried:
17.7% (24)
Marital status - Asian population 15 years and over
Males 30.6% Never married69.4% Now married0.0% Separated0.0% Widowed0.0% DivorcedFemales 14.0% Never married62.2% Now married0.0% Separated21.1% Widowed2.8% DivorcedWomen who gave birth in the past 12 months Now married:
100.0% (13)Unmarried:
0.0% (0)
Women who did not give birth in the past 12 months Now married:
64.8% (242)Unmarried:
35.2% (132)
Marital status - Native Hawaiian / Pacific Islander population 15 years and over
Males 79.3% Never married20.7% Now married0.0% Separated0.0% Widowed0.0% DivorcedFemales 0.0% Never married100.0% Now married0.0% Separated0.0% Widowed0.0% DivorcedWomen who did not give birth in the past 12 months Now married:
100.0% (6)Unmarried:
0.0% (0)
Marital status - Other race population 15 years and over
Males 30.5% Never married59.8% Now married0.0% Separated0.0% Widowed9.8% DivorcedFemales 8.5% Never married17.0% Now married0.0% Separated0.0% Widowed74.5% DivorcedWomen who did not give birth in the past 12 months Now married:
0.0% (0)Unmarried:
100.0% (9)
Marital status - Two or more races population 15 years and over
Males 30.5% Never married63.0% Now married0.0% Separated0.0% Widowed6.5% DivorcedFemales 22.1% Never married71.6% Now married0.0% Separated0.0% Widowed6.3% DivorcedWomen who did not give birth in the past 12 months Now married:
80.5% (186)Unmarried:
19.5% (45)
Marital status - White alone, not Hispanic / Latino population 15 years and over
Males 23.9% Never married66.3% Now married2.8% Separated2.4% Widowed4.6% DivorcedFemales 18.7% Never married63.8% Now married0.4% Separated9.7% Widowed7.4% DivorcedWomen who gave birth in the past 12 months Now married:
80.4% (75)Unmarried:
19.6% (18)
Women who did not give birth in the past 12 months Now married:
57.0% (1,008)Unmarried:
43.0% (760)
Marital status - Hispanic or Latino population 15 years and over
Males 30.0% Never married63.8% Now married0.0% Separated0.0% Widowed6.3% DivorcedFemales 7.0% Never married49.6% Now married0.0% Separated0.0% Widowed43.5% DivorcedWomen who did not give birth in the past 12 months Now married:
82.2% (76)Unmarried:
17.8% (16)
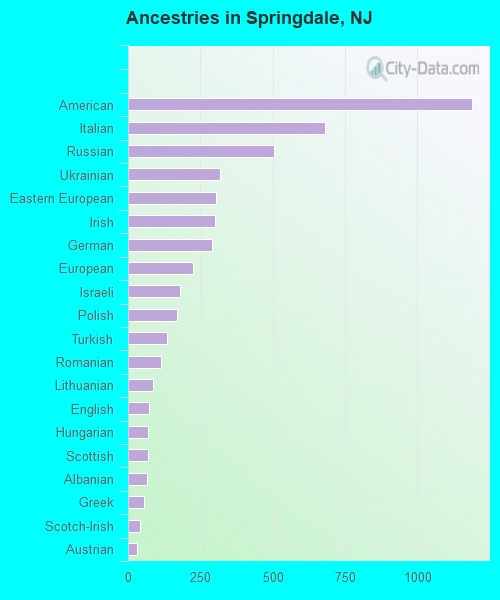
Ancestries in Springdale
1,188 15.0% American680 8.6% Italian506 6.4% Russian318 4.0% Ukrainian304 3.8% Eastern European302 3.8% Irish291 3.7% German223 2.8% European179 2.3% Israeli171 2.2% Polish134 1.7% Turkish115 1.5% Romanian85 1.1% Lithuanian71 0.9% English69 0.9% Hungarian69 0.9% Scottish65 0.8% Albanian56 0.7% Greek41 0.5% Scotch-Irish30 0.4% Austrian10 0.1% Iranian10 0.1% British West Indian9 0.1% Slovak8 0.1% Egyptian7 0.09% French6 0.08% Croatian6 0.08% Norwegian5 0.06% Dutch
Children Nativity (place of birth) in Springdale
Children under 6 years - Living with two parents Both parents native 621 100.0% NativeBoth parents foreign-born 108 100.0% NativeOne native, one foreign-born parent 108 100.0% NativeChildren under 6 years - Living with one parent Native parent 30 100.0% NativeChildren 6 to 17 years - Living with two parents Both parents native 1,337 99.4% Native8 0.6% Foreign-bornBoth parents foreign-born 369 77.1% Native109 22.9% Foreign-bornOne native, one foreign-born parent 214 100.0% NativeChildren 6 to 17 years - Living with one parent Native parent 254 100.0% NativeForeign-born parent 49 51.5% Native46 48.5% Foreign-born
Grandparents responsible for own grandchildren in Springdale
Grandparents (30 to 59 years) White / Caucasian 6 100.0% Not responsible for grandchildrenWhite alone, not Hispanic / Latino 6 100.0% Not responsible for grandchildrenGrandparents (60 years and over) White / Caucasian 7 22.6% Responsible for grandchildren25 77.4% Not responsible for grandchildrenWhite alone, not Hispanic / Latino 8 20.9% Responsible for grandchildren29 79.1% Not responsible for grandchildren