Races in Southern Pines, North Carolina (NC) Detailed Stats
Data:
Races - White alone (%)
Races - White alone (% change since 2000)
Races - Black alone (%)
Races - Black alone (% change since 2000)
Races - American Indian alone (%)
Races - American Indian alone (% change since 2000)
Races - Asian alone (%)
Races - Asian alone (% change since 2000)
Races - Hispanic (%)
Races - Hispanic (% change since 2000)
Races - Native Hawaiian and Other Pacific Islander alone (%)
Races - Native Hawaiian and Other Pacific Islander alone (% change since 2000)
Races - Two or more races(%)
Races - Two or more races(% change since 2000)
Races - Other race alone (%)
Races - Other race alone (% change since 2000)
Racial diversity
Place of birth - Born in state of residence (%)
Place of birth - Born in state of residence (%) - White
Place of birth - Born in state of residence (%) - Black or African American
Place of birth - Born in state of residence (%) - Asian
Place of birth - Born in state of residence (%) - Hispanic or Latino
Place of birth - Born in state of residence (%) - American Indian and Alaska Native
Place of birth - Born in state of residence (%) - Multirace
Place of birth - Born in state of residence (%) - Other Race
Place of birth - Born in other state (%)
Place of birth - Born in other state (%) - White
Place of birth - Born in other state (%) - Black or African American
Place of birth - Born in other state (%) - Asian
Place of birth - Born in other state (%) - Hispanic or Latino
Place of birth - Born in other state (%) - American Indian and Alaska Native
Place of birth - Born in other state (%) - Multirace
Place of birth - Born in other state (%) - Other Race
Place of birth - Native, outside of US (%)
Place of birth - Native, outside of US (%) - White
Place of birth - Native, outside of US (%) - Black or African American
Place of birth - Native, outside of US (%) - Asian
Place of birth - Native, outside of US (%) - Hispanic or Latino
Place of birth - Native, outside of US (%) - American Indian and Alaska Native
Place of birth - Native, outside of US (%) - Multirace
Place of birth - Native, outside of US (%) - Other Race
Place of birth - Foreign born (%)
Place of birth - Foreign born (%) - White
Place of birth - Foreign born (%) - Black or African American
Place of birth - Foreign born (%) - Asian
Place of birth - Foreign born (%) - Hispanic or Latino
Place of birth - Foreign born (%) - American Indian and Alaska Native
Place of birth - Foreign born (%) - Multirace
Place of birth - Foreign born (%) - Other Race
Residents speaking English at home (%)
Residents speaking English at home - Born in the United States (%)
Residents speaking English at home - Native, born elsewhere (%)
Residents speaking English at home - Foreign born (%)
Residents speaking Spanish at home (%)
Residents speaking Spanish at home - Born in the United States (%)
Residents speaking Spanish at home - Native, born elsewhere (%)
Residents speaking Spanish at home - Foreign born (%)
Residents speaking other language at home (%)
Residents speaking other language at home - Born in the United States (%)
Residents speaking other language at home - Native, born elsewhere (%)
Residents speaking other language at home - Foreign born (%)
Marital status - Never married (%)
Marital status - Now married (%)
Marital status - Separated (%)
Marital status - Widowed (%)
Marital status - Divorced (%)
Ancestries Reported - Arab (%)
Ancestries Reported - Czech (%)
Ancestries Reported - Danish (%)
Ancestries Reported - Dutch (%)
Ancestries Reported - English (%)
Ancestries Reported - French (%)
Ancestries Reported - French Canadian (%)
Ancestries Reported - German (%)
Ancestries Reported - Greek (%)
Ancestries Reported - Hungarian (%)
Ancestries Reported - Irish (%)
Ancestries Reported - Italian (%)
Ancestries Reported - Lithuanian (%)
Ancestries Reported - Norwegian (%)
Ancestries Reported - Polish (%)
Ancestries Reported - Portuguese (%)
Ancestries Reported - Russian (%)
Ancestries Reported - Scotch-Irish (%)
Ancestries Reported - Scottish (%)
Ancestries Reported - Slovak (%)
Ancestries Reported - Subsaharan African (%)
Ancestries Reported - Swedish (%)
Ancestries Reported - Swiss (%)
Ancestries Reported - Ukrainian (%)
Ancestries Reported - United States (%)
Ancestries Reported - Welsh (%)
Ancestries Reported - West Indian (%)
Ancestries Reported - Other (%)
Geographical mobility - Same house 1 year ago (%)
Geographical mobility - Same house 1 year ago (%) - White
Geographical mobility - Same house 1 year ago (%) - Black or African American
Geographical mobility - Same house 1 year ago (%) - Asian
Geographical mobility - Same house 1 year ago (%) - Hispanic or Latino
Geographical mobility - Same house 1 year ago (%) - American Indian and Alaska Native
Geographical mobility - Same house 1 year ago (%) - Multirace
Geographical mobility - Same house 1 year ago (%) - Other Race
Geographical mobility - Moved within same county (%)
Geographical mobility - Moved within same county (%) - White
Geographical mobility - Moved within same county (%) - Black or African American
Geographical mobility - Moved within same county (%) - Asian
Geographical mobility - Moved within same county (%) - Hispanic or Latino
Geographical mobility - Moved within same county (%) - American Indian and Alaska Native
Geographical mobility - Moved within same county (%) - Multirace
Geographical mobility - Moved within same county (%) - Other Race
Geographical mobility - Moved from different county within same state (%)
Geographical mobility - Moved from different county within same state (%) - White
Geographical mobility - Moved from different county within same state (%) - Black or African American
Geographical mobility - Moved from different county within same state (%) - Asian
Geographical mobility - Moved from different county within same state (%) - Hispanic or Latino
Geographical mobility - Moved from different county within same state (%) - American Indian and Alaska Native
Geographical mobility - Moved from different county within same state (%) - Multirace
Geographical mobility - Moved from different county within same state (%) - Other Race
Geographical mobility - Moved from different state (%)
Geographical mobility - Moved from different state (%) - White
Geographical mobility - Moved from different state (%) - Black or African American
Geographical mobility - Moved from different state (%) - Asian
Geographical mobility - Moved from different state (%) - Hispanic or Latino
Geographical mobility - Moved from different state (%) - American Indian and Alaska Native
Geographical mobility - Moved from different state (%) - Multirace
Geographical mobility - Moved from different state (%) - Other Race
Geographical mobility - Moved from abroad (%)
Geographical mobility - Moved from abroad (%) - White
Geographical mobility - Moved from abroad (%) - Black or African American
Geographical mobility - Moved from abroad (%) - Asian
Geographical mobility - Moved from abroad (%) - Hispanic or Latino
Geographical mobility - Moved from abroad (%) - American Indian and Alaska Native
Geographical mobility - Moved from abroad (%) - Multirace
Geographical mobility - Moved from abroad (%) - Other Race
Place of birth for the foreign-born population - Ireland (%)
Place of birth for the foreign-born population - Denmark (%)
Place of birth for the foreign-born population - Norway (%)
Place of birth for the foreign-born population - Sweden (%)
Place of birth for the foreign-born population - United Kingdom (%)
Place of birth for the foreign-born population - England (%)
Place of birth for the foreign-born population - Scotland (%)
Place of birth for the foreign-born population - Other Northern Europe (%)
Place of birth for the foreign-born population - Austria (%)
Place of birth for the foreign-born population - Belgium (%)
Place of birth for the foreign-born population - France (%)
Place of birth for the foreign-born population - Germany (%)
Place of birth for the foreign-born population - Netherlands (%)
Place of birth for the foreign-born population - Switzerland (%)
Place of birth for the foreign-born population - Other Western Europe (%)
Place of birth for the foreign-born population - Greece (%)
Place of birth for the foreign-born population - Italy (%)
Place of birth for the foreign-born population - Portugal (%)
Place of birth for the foreign-born population - Spain (%)
Place of birth for the foreign-born population - Other Southern Europe (%)
Place of birth for the foreign-born population - Albania (%)
Place of birth for the foreign-born population - Belarus (%)
Place of birth for the foreign-born population - Bosnia and Herzegovina (%)
Place of birth for the foreign-born population - Bulgaria (%)
Place of birth for the foreign-born population - Croatia (%)
Place of birth for the foreign-born population - Czechoslovakia (%)
Place of birth for the foreign-born population - Hungary (%)
Place of birth for the foreign-born population - Latvia (%)
Place of birth for the foreign-born population - Lithuania (%)
Place of birth for the foreign-born population - North Macedonia (Macedonia) (%)
Place of birth for the foreign-born population - Moldova (%)
Place of birth for the foreign-born population - Poland (%)
Place of birth for the foreign-born population - Romania (%)
Place of birth for the foreign-born population - Russia (%)
Place of birth for the foreign-born population - Serbia (%)
Place of birth for the foreign-born population - Ukraine (%)
Place of birth for the foreign-born population - Other Eastern Europe (%)
Place of birth for the foreign-born population - China (%)
Place of birth for the foreign-born population - Hong Kong (%)
Place of birth for the foreign-born population - Taiwan (%)
Place of birth for the foreign-born population - Japan (%)
Place of birth for the foreign-born population - Korea (%)
Place of birth for the foreign-born population - Other Eastern Asia (%)
Place of birth for the foreign-born population - Afghanistan (%)
Place of birth for the foreign-born population - Bangladesh (%)
Place of birth for the foreign-born population - India (%)
Place of birth for the foreign-born population - Iran (%)
Place of birth for the foreign-born population - Kazakhstan (%)
Place of birth for the foreign-born population - Nepal (%)
Place of birth for the foreign-born population - Pakistan (%)
Place of birth for the foreign-born population - Sri Lanka (%)
Place of birth for the foreign-born population - Uzbekistan (%)
Place of birth for the foreign-born population - Other South Central Asia (%)
Place of birth for the foreign-born population - Burma (%)
Place of birth for the foreign-born population - Cambodia (%)
Place of birth for the foreign-born population - Indonesia (%)
Place of birth for the foreign-born population - Laos (%)
Place of birth for the foreign-born population - Malaysia (%)
Place of birth for the foreign-born population - Philippines (%)
Place of birth for the foreign-born population - Singapore (%)
Place of birth for the foreign-born population - Thailand (%)
Place of birth for the foreign-born population - Vietnam (%)
Place of birth for the foreign-born population - Other South Eastern Asia (%)
Place of birth for the foreign-born population - Armenia (%)
Place of birth for the foreign-born population - Iraq (%)
Place of birth for the foreign-born population - Israel (%)
Place of birth for the foreign-born population - Jordan (%)
Place of birth for the foreign-born population - Kuwait (%)
Place of birth for the foreign-born population - Lebanon (%)
Place of birth for the foreign-born population - Saudi Arabia (%)
Place of birth for the foreign-born population - Syria (%)
Place of birth for the foreign-born population - Turkey (%)
Place of birth for the foreign-born population - Yemen (%)
Place of birth for the foreign-born population - Other Western Asia (%)
Place of birth for the foreign-born population - Eritrea (%)
Place of birth for the foreign-born population - Ethiopia (%)
Place of birth for the foreign-born population - Kenya (%)
Place of birth for the foreign-born population - Somalia (%)
Place of birth for the foreign-born population - Uganda (%)
Place of birth for the foreign-born population - Zimbabwe (%)
Place of birth for the foreign-born population - Other Eastern Africa (%)
Place of birth for the foreign-born population - Cameroon (%)
Place of birth for the foreign-born population - Congo (%)
Place of birth for the foreign-born population - Democratic Republic of Congo (Zaire) (%)
Place of birth for the foreign-born population - Other Middle Africa (%)
Place of birth for the foreign-born population - Egypt (%)
Place of birth for the foreign-born population - Morocco (%)
Place of birth for the foreign-born population - Sudan (%)
Place of birth for the foreign-born population - Other Northern Africa (%)
Place of birth for the foreign-born population - South Africa (%)
Place of birth for the foreign-born population - Other Southern Africa (%)
Place of birth for the foreign-born population - Cabo Verde (%)
Place of birth for the foreign-born population - Ghana (%)
Place of birth for the foreign-born population - Liberia (%)
Place of birth for the foreign-born population - Nigeria (%)
Place of birth for the foreign-born population - Senegal (%)
Place of birth for the foreign-born population - Sierra Leone (%)
Place of birth for the foreign-born population - Other Western Africa (%)
Place of birth for the foreign-born population - Australia (%)
Place of birth for the foreign-born population - New Zealand (%)
Place of birth for the foreign-born population - Fiji (%)
Place of birth for the foreign-born population - Micronesia (%)
Place of birth for the foreign-born population - Bahamas (%)
Place of birth for the foreign-born population - Barbados (%)
Place of birth for the foreign-born population - Cuba (%)
Place of birth for the foreign-born population - Dominica (%)
Place of birth for the foreign-born population - Dominican Republic (%)
Place of birth for the foreign-born population - Grenada (%)
Place of birth for the foreign-born population - Haiti (%)
Place of birth for the foreign-born population - Jamaica (%)
Place of birth for the foreign-born population - St. Vincent and the Grenadines (%)
Place of birth for the foreign-born population - Trinidad and Tobago (%)
Place of birth for the foreign-born population - West Indies (%)
Place of birth for the foreign-born population - Other Caribbean (%)
Place of birth for the foreign-born population - Belize (%)
Place of birth for the foreign-born population - Costa Rica (%)
Place of birth for the foreign-born population - El Salvador (%)
Place of birth for the foreign-born population - Guatemala (%)
Place of birth for the foreign-born population - Honduras (%)
Place of birth for the foreign-born population - Mexico (%)
Place of birth for the foreign-born population - Nicaragua (%)
Place of birth for the foreign-born population - Panama (%)
Place of birth for the foreign-born population - Other Central America (%)
Place of birth for the foreign-born population - Argentina (%)
Place of birth for the foreign-born population - Bolivia (%)
Place of birth for the foreign-born population - Brazil (%)
Place of birth for the foreign-born population - Chile (%)
Place of birth for the foreign-born population - Colombia (%)
Place of birth for the foreign-born population - Ecuador (%)
Place of birth for the foreign-born population - Guyana (%)
Place of birth for the foreign-born population - Peru (%)
Place of birth for the foreign-born population - Uruguay (%)
Place of birth for the foreign-born population - Venezuela (%)
Place of birth for the foreign-born population - Other South America (%)
Place of birth for the foreign-born population - Canada (%)
Place of birth for the foreign-born population - Other Northern America (%)
Place of birth for the foreign-born population - Other (%)
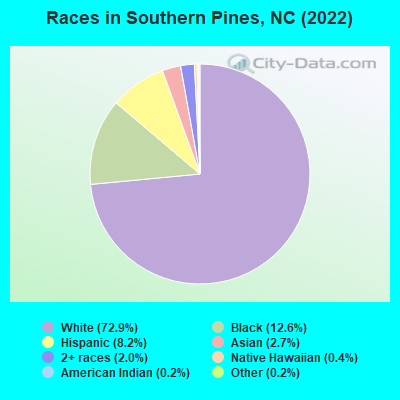
According to 2022 data, the most numerous races in Southern Pines, NC are White alone (11,995 residents), Black alone (2,070 residents), and Hispanic (1,348 residents). 90.7% of Southern Pines residents speak English at home. 5.3% of Southern Pines, NC residents are foreign-born (2.1% born in Latin America, 1.6% born in Asia, 0.8% born in Europe), which is 51.7% less than the foreign-born rate of 8.0% across the entire state of North Carolina.
Race distribution in Southern Pines
2000 2022
5,647,155 70.2% White alone 1,723,301 21.4% Black alone 378,963 4.7% Hispanic 112,416 1.4% Asian alone 95,333 1.2% American Indian alone 79,965 1.0% Two or more races 9,015 0.1% Other race alone 3,165 0.04% Native Hawaiian and Other
6,497,519 60.7% White alone 2,155,650 20.1% Black alone 1,114,799 10.4% Hispanic 438,061 4.1% Two or more races 341,052 3.2% Asian alone 91,758 0.9% American Indian alone 50,180 0.5% Other race alone 9,954 0.09% Native Hawaiian and Other
Income and house value in Southern Pines Median household income in 2022 $98,558 White non-Hispanic householders$59,226 Black householders$80,579 Asian householders$85,391 Two or more races householders$106,229 Hispanic or Latino race householdersMedian 2022 house value $518,136 White Non-Hispanic householders$220,694 Black or African American householders$316,187 Two or more races householders$397,886 Hispanic or Latino householders
Median age by race in Southern Pines
40.3 Median age for White residents37.3 43.4 33.7 Median age for Black or African American residents41.8 34.9 72.8 Median age for American Indian / Alaska Native residents-668,604,650.5 74.6 40.2 Median age for Asian residents23.4 49.3 16.0 Median age for Native Hawaiian / Pacific Islander residents-611,708,482.1 -612,403,100.2 32.8 Median age for Other race residents39.8 10.7 29.7 Median age for Two or more races residents35.2 32.2 42.4 Median age for White alone residents38.5 44.6 25.0 Median age for Hispanic or Latino residents23.7 26.3
Owner/renter occupied households by race in Southern Pines
House owners and renters - White residents 3,676 60.8% Owner occupied2,370 39.2% Renter occupiedHouse owners and renters - Black or African American residents 438 56.9% Owner occupied331 43.1% Renter occupiedHouse owners and renters - Asian residents 131 52.9% Owner occupied116 47.1% Renter occupiedHouse owners and renters - Other race residents 128 71.5% Owner occupied51 28.5% Renter occupiedHouse owners and renters - Two or more races residents 213 66.0% Owner occupied110 34.0% Renter occupiedHouse owners and renters - White alone residents 3,675 62.9% Owner occupied2,163 37.1% Renter occupiedHouse owners and renters - Hispanic or Latino residents 149 33.8% Owner occupied291 66.2% Renter occupied
Language usage in Southern Pines
English speakers - Total 90.7% of residents of Southern Pines speak English at home.
4.8% of residents speak Spanish at home 428 58.3% Speak English very well306 41.7% Speak English less than very well4.3% of residents speak other language at home 566 85.8% Speak English very well94 14.2% Speak English less than very well
English speakers - Born in the United States 93.2% of residents of Southern Pines speak English at home.
3.9% of residents speak Spanish at home 111 30.5% Speak English very well253 69.5% Speak English less than very well4.0% of residents speak other language at home 323 87.8% Speak English very well45 12.2% Speak English less than very well
English speakers - Native, born elsewhere 51.1% of residents of Southern Pines speak English at home.
8.4% of residents speak Spanish at home 40 64.5% Speak English very well22 35.5% Speak English less than very well24.0% of residents speak other language at home 177 100.0% Speak English very well
English speakers - Foreign-born 42.2% of residents of Southern Pines speak English at home.
23.8% of residents speak Spanish at home 77 43.0% Speak English very well102 57.0% Speak English less than very well36.1% of residents speak other language at home 220 80.9% Speak English very well52 19.1% Speak English less than very well
White (Caucasian) - Speak only English Native:
93.8% (10,419)Foreign-born:
69.5% (215)
White (Caucasian) - Speak another language Native:
7.1% (789)Foreign-born:
30.7% (95)
Black or African American - Speak only English Native:
100.0% (2,057)Foreign-born:
100.0% (14)
Asian - Speak only English Native:
61.9% (137)Foreign-born:
18.2% (50)
Asian - Speak another language Native:
38.0% (84)Foreign-born:
81.8% (227)
Other race - Speak another language Native:
32.2% (170)Foreign-born:
100.0% (73)
Two or more races - Speak only English Native:
76.9% (556)Foreign-born:
10.8% (24)
Two or more races - Speak another language Native:
23.1% (167)Foreign-born:
89.1% (202)
White alone - Speak only English Native:
94.5% (10,162)Foreign-born:
62.5% (205)
White alone - Speak another language Native:
6.0% (649)Foreign-born:
28.4% (93)
Hispanic or Latino - Speak only English Native:
79.6% (922)Foreign-born:
10.6% (19)
Hispanic or Latino - Speak another language Native:
25.6% (296)Foreign-born:
86.9% (153)
Foreign-born residents in Southern Pines 867 residents are foreign born (2.1% Latin America , 1.6% Asia , 0.8% Europe ).
This city:
5.3%North Carolina:
8.3%
Marital status for residents in Southern Pines Marital status - White (Caucasian) population 15 years and over
Males 20.6% Never married63.1% Now married0.5% Separated4.9% Widowed10.8% DivorcedFemales 17.1% Never married56.1% Now married0.9% Separated14.3% Widowed11.5% DivorcedWomen who gave birth in the past 12 months Now married:
100.0% (97)Unmarried:
0.0% (0)
Women who did not give birth in the past 12 months Now married:
61.2% (1,670)Unmarried:
38.8% (1,058)
Marital status - Black or African American population 15 years and over
Males 68.0% Never married15.3% Now married0.0% Separated2.0% Widowed14.6% DivorcedFemales 46.4% Never married25.9% Now married2.2% Separated12.5% Widowed13.0% DivorcedWomen who did not give birth in the past 12 months Now married:
34.9% (208)Unmarried:
65.1% (387)
Marital status - Asian population 15 years and over
Males 40.4% Never married59.6% Now married0.0% Separated0.0% Widowed0.0% DivorcedFemales 4.3% Never married44.0% Now married0.0% Separated9.7% Widowed42.0% DivorcedWomen who gave birth in the past 12 months Now married:
100.0% (36)Unmarried:
0.0% (0)
Women who did not give birth in the past 12 months Now married:
0.0% (0)Unmarried:
100.0% (94)
Marital status - Native Hawaiian / Pacific Islander population 15 years and over
Males 50.0% Never married50.0% Now married0.0% Separated0.0% Widowed0.0% DivorcedFemales 100.0% Never married0.0% Now married0.0% Separated0.0% Widowed0.0% DivorcedWomen who did not give birth in the past 12 months Now married:
0.0% (0)Unmarried:
100.0% (14)
Marital status - Other race population 15 years and over
Males 31.8% Never married68.2% Now married0.0% Separated0.0% Widowed0.0% DivorcedFemales 36.0% Never married32.6% Now married0.0% Separated0.0% Widowed31.4% DivorcedWomen who gave birth in the past 12 months Now married:
100.0% (26)Unmarried:
0.0% (0)
Women who did not give birth in the past 12 months Now married:
22.5% (12)Unmarried:
77.5% (43)
Marital status - Two or more races population 15 years and over
Males 56.7% Never married38.8% Now married1.7% Separated0.0% Widowed2.7% DivorcedFemales 45.1% Never married24.7% Now married0.0% Separated2.7% Widowed27.5% DivorcedWomen who did not give birth in the past 12 months Now married:
32.4% (75)Unmarried:
67.6% (157)
Marital status - White alone, not Hispanic / Latino population 15 years and over
Males 18.8% Never married64.5% Now married0.5% Separated5.1% Widowed11.1% DivorcedFemales 17.6% Never married55.4% Now married1.0% Separated14.4% Widowed11.6% DivorcedWomen who gave birth in the past 12 months Now married:
100.0% (98)Unmarried:
0.0% (0)
Women who did not give birth in the past 12 months Now married:
59.8% (1,584)Unmarried:
40.2% (1,067)
Marital status - Hispanic or Latino population 15 years and over
Males 51.9% Never married48.1% Now married0.0% Separated0.0% Widowed0.0% DivorcedFemales 26.5% Never married46.7% Now married0.0% Separated3.9% Widowed22.9% DivorcedWomen who gave birth in the past 12 months Now married:
100.0% (21)Unmarried:
0.0% (0)
Women who did not give birth in the past 12 months Now married:
57.5% (140)Unmarried:
42.5% (104)
Ancestries in Southern Pines
1,011 12.6% English772 9.6% German576 7.2% American444 5.5% Irish324 4.0% Italian251 3.1% European164 2.0% Scottish146 1.8% Scotch-Irish106 1.3% British102 1.3% Polish94 1.2% Norwegian61 0.8% Dutch55 0.7% Slovak54 0.7% French49 0.6% Welsh38 0.5% Russian38 0.5% Swedish34 0.4% Finnish26 0.3% Ukrainian23 0.3% Egyptian18 0.2% Portuguese17 0.2% Yugoslavian15 0.2% Jamaican8 0.10% Cajun8 0.10% Canadian7 0.09% French Canadian6 0.07% African
Geographical mobility in Southern Pines Same house 1 year ago 9,739 79.5% White (Caucasian)1,752 84.2% Black or African American319 64.6% Asian64 100.0% Native Hawaiian / Pacific Islander443 72.4% Other race785 90.6% Two or more races9,459 79.8% White alone, not Hispanic / Latino1,083 82.3% Hispanic or LatinoMoved within same county 1,361 11.1% White / Caucasian242 11.6% Black or African American14 39.0% American Indian / Alaska Native7 1.5% Asian49 8.0% Other race94 10.9% Two or more races1,307 11.0% White alone, not Hispanic / Latino100 7.6% Hispanic or LatinoMoved within same state 470 3.8% White / Caucasian40 1.9% Black or African American10 28.4% American Indian / Alaska Native15 3.0% Asian127 20.8% Other race58 6.7% Two or more races415 3.5% White alone, not Hispanic / Latino147 11.1% Hispanic or LatinoMoved from different state 597 4.9% White / Caucasian121 24.6% Asian593 5.0% White alone, not Hispanic / Latino11 0.8% Hispanic or LatinoMoved from abroad 43 0.4% White14 2.9% Asian44 0.4% White alone, not Hispanic / Latino
Children Nativity (place of birth) in Southern Pines
Children under 6 years - Living with two parents Both parents native 1,067 100.0% NativeBoth parents foreign-born 76 100.0% NativeOne native, one foreign-born parent 78 100.0% NativeChildren under 6 years - Living with one parent Native parent 81 100.0% Native
Children 6 to 17 years - Living with two parents Both parents native 1,132 97.2% Native33 2.8% Foreign-bornBoth parents foreign-born 16 100.0% Foreign-bornOne native, one foreign-born parent 12 100.0% NativeChildren 6 to 17 years - Living with one parent Native parent 363 100.0% Native