Races in South Whidbey, Washington (WA) Detailed Stats
Ancestries, Foreign-born residents, place of birth
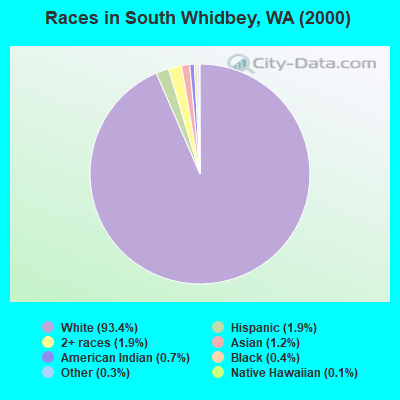
Race distribution in South Whidbey

- 11,83193.4%White alone
- 2431.9%Hispanic
- 2381.9%Two or more races
- 1541.2%Asian alone
- 930.7%American Indian alone
- 530.4%Black alone
- 320.3%Other race alone
- 180.1%Native Hawaiian and Other
Pacific Islander alone
2000
2022
-
- 4,652,49078.9%White alone
- 441,5097.5%Hispanic
- 319,4015.4%Asian alone
- 184,6313.1%Black alone
- 175,9263.0%Two or more races
- 85,3961.4%American Indian alone
- 22,7790.4%Native Hawaiian and Other
Pacific Islander alone - 11,9890.2%Other race alone

-
- 4,941,45663.5%White alone
- 1,093,31314.0%Hispanic
- 755,8329.7%Asian alone
- 523,4486.7%Two or more races
- 299,5373.8%Black alone
- 69,0240.9%American Indian alone
- 52,2310.7%Native Hawaiian and Other
Pacific Islander alone - 50,9450.7%Other race alone

Income and house value in South Whidbey
- Median household income in 2022
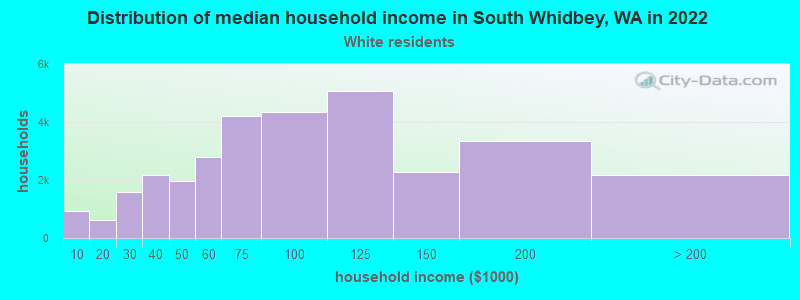
- $80,998White non-Hispanic householders
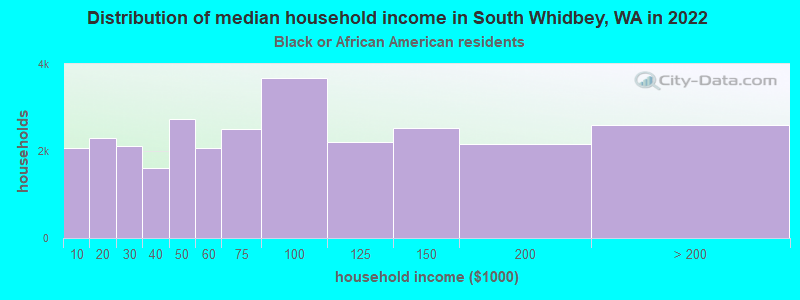
- $18,904Black householders
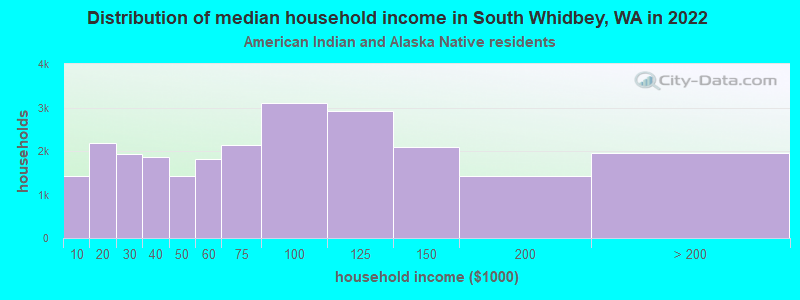
- $100,200American Indian and Alaska Native householders
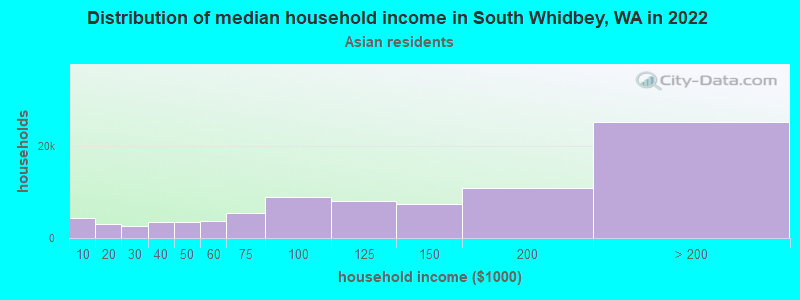
- $53,817Asian householders
- $116,025Some other race householders
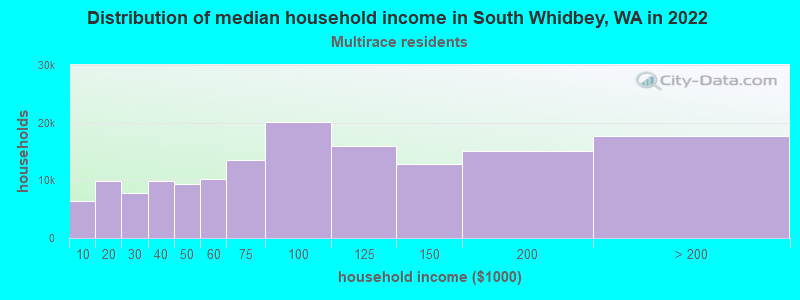
- $73,957Two or more races householders
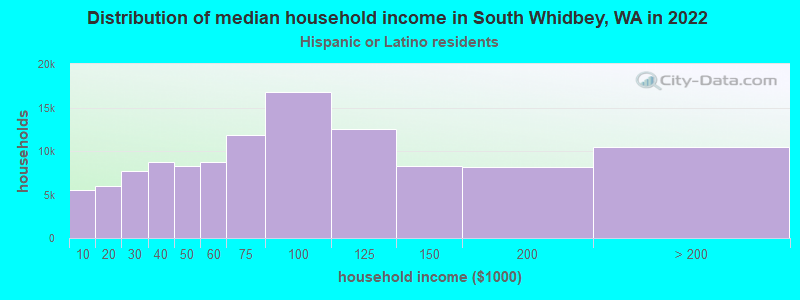
- $69,015Hispanic or Latino race householders
- Median 2022 house value
- $761,529White Non-Hispanic householders
- $666,604American Indian or Alaska Native householders
- $666,604Asian householders
- over $1,000,000Some other race householders
- $787,126Two or more races householders
- $970,932Hispanic or Latino householders
Household income for White non-Hispanic householders
Household income for Black householders
Household income for American Indian and Alaska Native householders
Household income for Asian householders
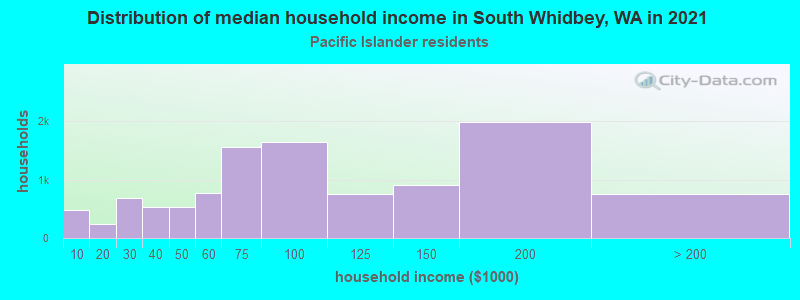
Household income for Native Hawaiian and other Pacific Islander householders
Household income for Two or more races householders
Household income for Hispanic or Latino race householders
Zip code: 98260