Races in Sisters-Millican, Oregon (OR) Detailed Stats
Ancestries, Foreign-born residents, place of birth
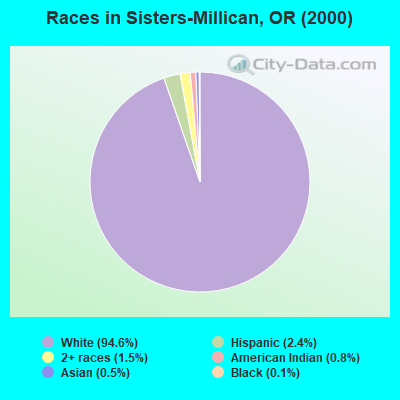
Race distribution in Sisters-Millican

- 22,15494.6%White alone
- 5602.4%Hispanic
- 3461.5%Two or more races
- 1880.8%American Indian alone
- 1170.5%Asian alone
- 310.1%Black alone
- 130.06%Other race alone
- 130.06%Native Hawaiian and Other
Pacific Islander alone
2000
2022
-
- 2,857,61683.5%White alone
- 275,3148.0%Hispanic
- 100,3332.9%Asian alone
- 82,7332.4%Two or more races
- 53,3251.6%Black alone
- 40,1301.2%American Indian alone
- 7,3980.2%Native Hawaiian and Other
Pacific Islander alone - 4,5500.1%Other race alone

-
- 3,037,57171.6%White alone
- 609,53814.4%Hispanic
- 252,7446.0%Two or more races
- 191,2834.5%Asian alone
- 78,2281.8%Black alone
- 29,3990.7%American Indian alone
- 25,7310.6%Other race alone
- 15,6430.4%Native Hawaiian and Other
Pacific Islander alone

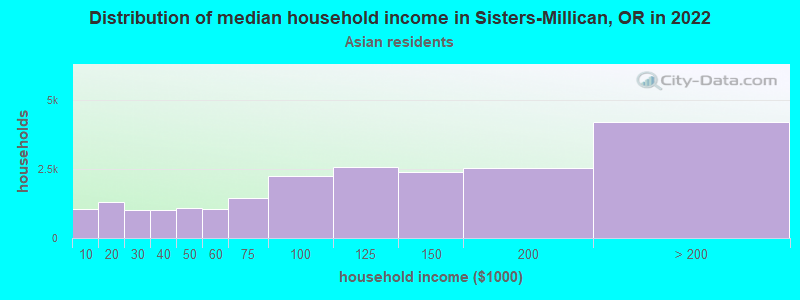
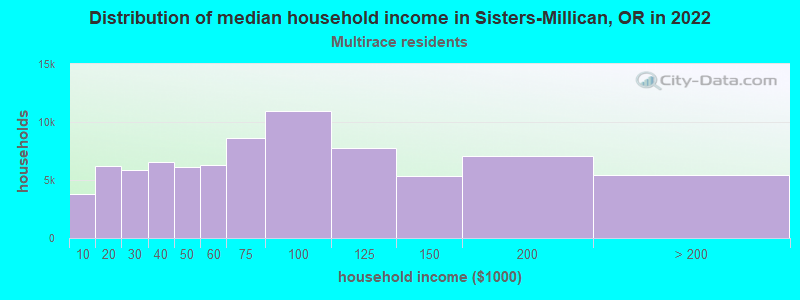
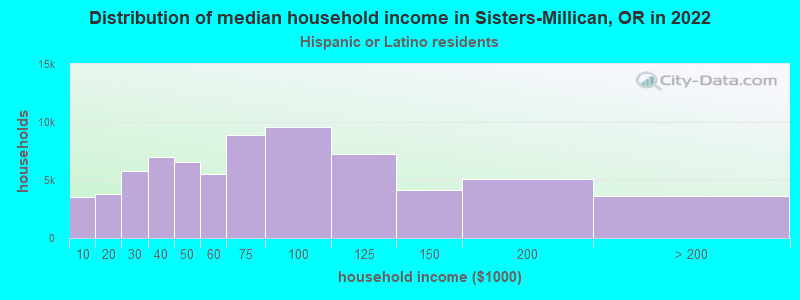
Income and house value in Sisters-Millican
- Median household income in 2022
- $81,746White non-Hispanic householders
- $51,396Asian householders
- $13,172Some other race householders
- $77,856Two or more races householders
- $60,401Hispanic or Latino race householders
- Median 2022 house value
- $771,127White Non-Hispanic householders
- $512,983American Indian or Alaska Native householders
- over $1,000,000Asian householders
- $498,353Two or more races householders
- $667,303Hispanic or Latino householders
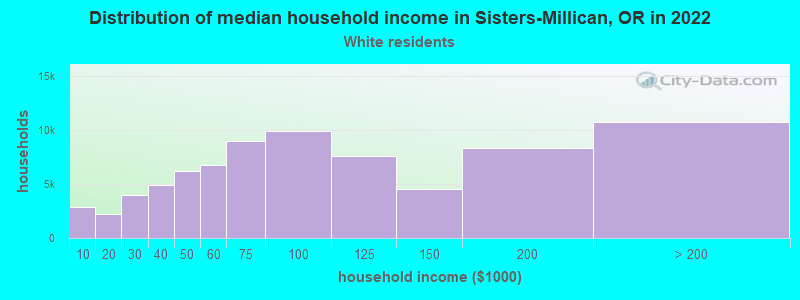
Household income for White non-Hispanic householders
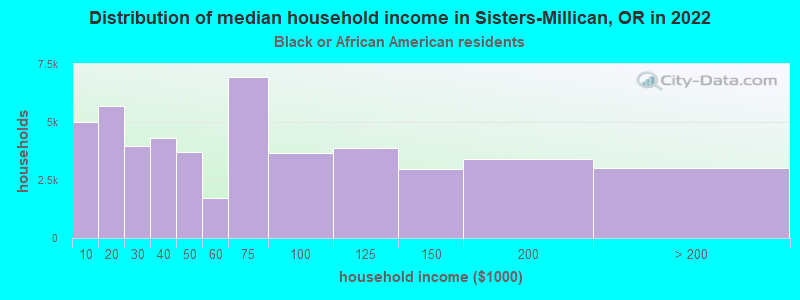
Household income for Black householders
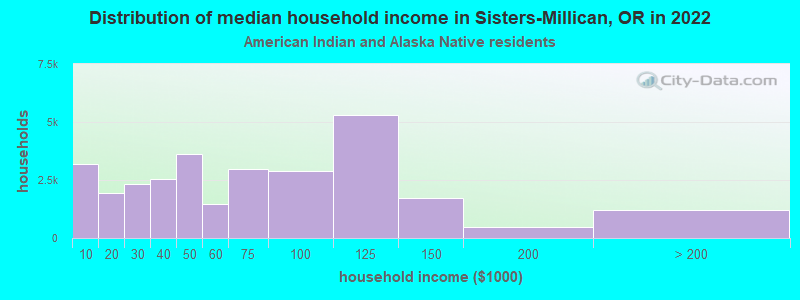
Household income for American Indian and Alaska Native householders
Household income for Asian householders
Household income for Two or more races householders
Household income for Hispanic or Latino race householders
Zip code: 97707