Races in Silver Firs, Washington (WA) Detailed Stats
Data:
Races - White alone (%)
Races - White alone (% change since 2000)
Races - Black alone (%)
Races - Black alone (% change since 2000)
Races - American Indian alone (%)
Races - American Indian alone (% change since 2000)
Races - Asian alone (%)
Races - Asian alone (% change since 2000)
Races - Hispanic (%)
Races - Hispanic (% change since 2000)
Races - Native Hawaiian and Other Pacific Islander alone (%)
Races - Native Hawaiian and Other Pacific Islander alone (% change since 2000)
Races - Two or more races(%)
Races - Two or more races(% change since 2000)
Races - Other race alone (%)
Races - Other race alone (% change since 2000)
Racial diversity
Place of birth - Born in state of residence (%)
Place of birth - Born in state of residence (%) - White
Place of birth - Born in state of residence (%) - Black or African American
Place of birth - Born in state of residence (%) - Asian
Place of birth - Born in state of residence (%) - Hispanic or Latino
Place of birth - Born in state of residence (%) - American Indian and Alaska Native
Place of birth - Born in state of residence (%) - Multirace
Place of birth - Born in state of residence (%) - Other Race
Place of birth - Born in other state (%)
Place of birth - Born in other state (%) - White
Place of birth - Born in other state (%) - Black or African American
Place of birth - Born in other state (%) - Asian
Place of birth - Born in other state (%) - Hispanic or Latino
Place of birth - Born in other state (%) - American Indian and Alaska Native
Place of birth - Born in other state (%) - Multirace
Place of birth - Born in other state (%) - Other Race
Place of birth - Native, outside of US (%)
Place of birth - Native, outside of US (%) - White
Place of birth - Native, outside of US (%) - Black or African American
Place of birth - Native, outside of US (%) - Asian
Place of birth - Native, outside of US (%) - Hispanic or Latino
Place of birth - Native, outside of US (%) - American Indian and Alaska Native
Place of birth - Native, outside of US (%) - Multirace
Place of birth - Native, outside of US (%) - Other Race
Place of birth - Foreign born (%)
Place of birth - Foreign born (%) - White
Place of birth - Foreign born (%) - Black or African American
Place of birth - Foreign born (%) - Asian
Place of birth - Foreign born (%) - Hispanic or Latino
Place of birth - Foreign born (%) - American Indian and Alaska Native
Place of birth - Foreign born (%) - Multirace
Place of birth - Foreign born (%) - Other Race
Residents speaking English at home (%)
Residents speaking English at home - Born in the United States (%)
Residents speaking English at home - Native, born elsewhere (%)
Residents speaking English at home - Foreign born (%)
Residents speaking Spanish at home (%)
Residents speaking Spanish at home - Born in the United States (%)
Residents speaking Spanish at home - Native, born elsewhere (%)
Residents speaking Spanish at home - Foreign born (%)
Residents speaking other language at home (%)
Residents speaking other language at home - Born in the United States (%)
Residents speaking other language at home - Native, born elsewhere (%)
Residents speaking other language at home - Foreign born (%)
Marital status - Never married (%)
Marital status - Now married (%)
Marital status - Separated (%)
Marital status - Widowed (%)
Marital status - Divorced (%)
Ancestries Reported - Arab (%)
Ancestries Reported - Czech (%)
Ancestries Reported - Danish (%)
Ancestries Reported - Dutch (%)
Ancestries Reported - English (%)
Ancestries Reported - French (%)
Ancestries Reported - French Canadian (%)
Ancestries Reported - German (%)
Ancestries Reported - Greek (%)
Ancestries Reported - Hungarian (%)
Ancestries Reported - Irish (%)
Ancestries Reported - Italian (%)
Ancestries Reported - Lithuanian (%)
Ancestries Reported - Norwegian (%)
Ancestries Reported - Polish (%)
Ancestries Reported - Portuguese (%)
Ancestries Reported - Russian (%)
Ancestries Reported - Scotch-Irish (%)
Ancestries Reported - Scottish (%)
Ancestries Reported - Slovak (%)
Ancestries Reported - Subsaharan African (%)
Ancestries Reported - Swedish (%)
Ancestries Reported - Swiss (%)
Ancestries Reported - Ukrainian (%)
Ancestries Reported - United States (%)
Ancestries Reported - Welsh (%)
Ancestries Reported - West Indian (%)
Ancestries Reported - Other (%)
Geographical mobility - Same house 1 year ago (%)
Geographical mobility - Same house 1 year ago (%) - White
Geographical mobility - Same house 1 year ago (%) - Black or African American
Geographical mobility - Same house 1 year ago (%) - Asian
Geographical mobility - Same house 1 year ago (%) - Hispanic or Latino
Geographical mobility - Same house 1 year ago (%) - American Indian and Alaska Native
Geographical mobility - Same house 1 year ago (%) - Multirace
Geographical mobility - Same house 1 year ago (%) - Other Race
Geographical mobility - Moved within same county (%)
Geographical mobility - Moved within same county (%) - White
Geographical mobility - Moved within same county (%) - Black or African American
Geographical mobility - Moved within same county (%) - Asian
Geographical mobility - Moved within same county (%) - Hispanic or Latino
Geographical mobility - Moved within same county (%) - American Indian and Alaska Native
Geographical mobility - Moved within same county (%) - Multirace
Geographical mobility - Moved within same county (%) - Other Race
Geographical mobility - Moved from different county within same state (%)
Geographical mobility - Moved from different county within same state (%) - White
Geographical mobility - Moved from different county within same state (%) - Black or African American
Geographical mobility - Moved from different county within same state (%) - Asian
Geographical mobility - Moved from different county within same state (%) - Hispanic or Latino
Geographical mobility - Moved from different county within same state (%) - American Indian and Alaska Native
Geographical mobility - Moved from different county within same state (%) - Multirace
Geographical mobility - Moved from different county within same state (%) - Other Race
Geographical mobility - Moved from different state (%)
Geographical mobility - Moved from different state (%) - White
Geographical mobility - Moved from different state (%) - Black or African American
Geographical mobility - Moved from different state (%) - Asian
Geographical mobility - Moved from different state (%) - Hispanic or Latino
Geographical mobility - Moved from different state (%) - American Indian and Alaska Native
Geographical mobility - Moved from different state (%) - Multirace
Geographical mobility - Moved from different state (%) - Other Race
Geographical mobility - Moved from abroad (%)
Geographical mobility - Moved from abroad (%) - White
Geographical mobility - Moved from abroad (%) - Black or African American
Geographical mobility - Moved from abroad (%) - Asian
Geographical mobility - Moved from abroad (%) - Hispanic or Latino
Geographical mobility - Moved from abroad (%) - American Indian and Alaska Native
Geographical mobility - Moved from abroad (%) - Multirace
Geographical mobility - Moved from abroad (%) - Other Race
Place of birth for the foreign-born population - Ireland (%)
Place of birth for the foreign-born population - Denmark (%)
Place of birth for the foreign-born population - Norway (%)
Place of birth for the foreign-born population - Sweden (%)
Place of birth for the foreign-born population - United Kingdom (%)
Place of birth for the foreign-born population - England (%)
Place of birth for the foreign-born population - Scotland (%)
Place of birth for the foreign-born population - Other Northern Europe (%)
Place of birth for the foreign-born population - Austria (%)
Place of birth for the foreign-born population - Belgium (%)
Place of birth for the foreign-born population - France (%)
Place of birth for the foreign-born population - Germany (%)
Place of birth for the foreign-born population - Netherlands (%)
Place of birth for the foreign-born population - Switzerland (%)
Place of birth for the foreign-born population - Other Western Europe (%)
Place of birth for the foreign-born population - Greece (%)
Place of birth for the foreign-born population - Italy (%)
Place of birth for the foreign-born population - Portugal (%)
Place of birth for the foreign-born population - Spain (%)
Place of birth for the foreign-born population - Other Southern Europe (%)
Place of birth for the foreign-born population - Albania (%)
Place of birth for the foreign-born population - Belarus (%)
Place of birth for the foreign-born population - Bosnia and Herzegovina (%)
Place of birth for the foreign-born population - Bulgaria (%)
Place of birth for the foreign-born population - Croatia (%)
Place of birth for the foreign-born population - Czechoslovakia (%)
Place of birth for the foreign-born population - Hungary (%)
Place of birth for the foreign-born population - Latvia (%)
Place of birth for the foreign-born population - Lithuania (%)
Place of birth for the foreign-born population - North Macedonia (Macedonia) (%)
Place of birth for the foreign-born population - Moldova (%)
Place of birth for the foreign-born population - Poland (%)
Place of birth for the foreign-born population - Romania (%)
Place of birth for the foreign-born population - Russia (%)
Place of birth for the foreign-born population - Serbia (%)
Place of birth for the foreign-born population - Ukraine (%)
Place of birth for the foreign-born population - Other Eastern Europe (%)
Place of birth for the foreign-born population - China (%)
Place of birth for the foreign-born population - Hong Kong (%)
Place of birth for the foreign-born population - Taiwan (%)
Place of birth for the foreign-born population - Japan (%)
Place of birth for the foreign-born population - Korea (%)
Place of birth for the foreign-born population - Other Eastern Asia (%)
Place of birth for the foreign-born population - Afghanistan (%)
Place of birth for the foreign-born population - Bangladesh (%)
Place of birth for the foreign-born population - India (%)
Place of birth for the foreign-born population - Iran (%)
Place of birth for the foreign-born population - Kazakhstan (%)
Place of birth for the foreign-born population - Nepal (%)
Place of birth for the foreign-born population - Pakistan (%)
Place of birth for the foreign-born population - Sri Lanka (%)
Place of birth for the foreign-born population - Uzbekistan (%)
Place of birth for the foreign-born population - Other South Central Asia (%)
Place of birth for the foreign-born population - Burma (%)
Place of birth for the foreign-born population - Cambodia (%)
Place of birth for the foreign-born population - Indonesia (%)
Place of birth for the foreign-born population - Laos (%)
Place of birth for the foreign-born population - Malaysia (%)
Place of birth for the foreign-born population - Philippines (%)
Place of birth for the foreign-born population - Singapore (%)
Place of birth for the foreign-born population - Thailand (%)
Place of birth for the foreign-born population - Vietnam (%)
Place of birth for the foreign-born population - Other South Eastern Asia (%)
Place of birth for the foreign-born population - Armenia (%)
Place of birth for the foreign-born population - Iraq (%)
Place of birth for the foreign-born population - Israel (%)
Place of birth for the foreign-born population - Jordan (%)
Place of birth for the foreign-born population - Kuwait (%)
Place of birth for the foreign-born population - Lebanon (%)
Place of birth for the foreign-born population - Saudi Arabia (%)
Place of birth for the foreign-born population - Syria (%)
Place of birth for the foreign-born population - Turkey (%)
Place of birth for the foreign-born population - Yemen (%)
Place of birth for the foreign-born population - Other Western Asia (%)
Place of birth for the foreign-born population - Eritrea (%)
Place of birth for the foreign-born population - Ethiopia (%)
Place of birth for the foreign-born population - Kenya (%)
Place of birth for the foreign-born population - Somalia (%)
Place of birth for the foreign-born population - Uganda (%)
Place of birth for the foreign-born population - Zimbabwe (%)
Place of birth for the foreign-born population - Other Eastern Africa (%)
Place of birth for the foreign-born population - Cameroon (%)
Place of birth for the foreign-born population - Congo (%)
Place of birth for the foreign-born population - Democratic Republic of Congo (Zaire) (%)
Place of birth for the foreign-born population - Other Middle Africa (%)
Place of birth for the foreign-born population - Egypt (%)
Place of birth for the foreign-born population - Morocco (%)
Place of birth for the foreign-born population - Sudan (%)
Place of birth for the foreign-born population - Other Northern Africa (%)
Place of birth for the foreign-born population - South Africa (%)
Place of birth for the foreign-born population - Other Southern Africa (%)
Place of birth for the foreign-born population - Cabo Verde (%)
Place of birth for the foreign-born population - Ghana (%)
Place of birth for the foreign-born population - Liberia (%)
Place of birth for the foreign-born population - Nigeria (%)
Place of birth for the foreign-born population - Senegal (%)
Place of birth for the foreign-born population - Sierra Leone (%)
Place of birth for the foreign-born population - Other Western Africa (%)
Place of birth for the foreign-born population - Australia (%)
Place of birth for the foreign-born population - New Zealand (%)
Place of birth for the foreign-born population - Fiji (%)
Place of birth for the foreign-born population - Micronesia (%)
Place of birth for the foreign-born population - Bahamas (%)
Place of birth for the foreign-born population - Barbados (%)
Place of birth for the foreign-born population - Cuba (%)
Place of birth for the foreign-born population - Dominica (%)
Place of birth for the foreign-born population - Dominican Republic (%)
Place of birth for the foreign-born population - Grenada (%)
Place of birth for the foreign-born population - Haiti (%)
Place of birth for the foreign-born population - Jamaica (%)
Place of birth for the foreign-born population - St. Vincent and the Grenadines (%)
Place of birth for the foreign-born population - Trinidad and Tobago (%)
Place of birth for the foreign-born population - West Indies (%)
Place of birth for the foreign-born population - Other Caribbean (%)
Place of birth for the foreign-born population - Belize (%)
Place of birth for the foreign-born population - Costa Rica (%)
Place of birth for the foreign-born population - El Salvador (%)
Place of birth for the foreign-born population - Guatemala (%)
Place of birth for the foreign-born population - Honduras (%)
Place of birth for the foreign-born population - Mexico (%)
Place of birth for the foreign-born population - Nicaragua (%)
Place of birth for the foreign-born population - Panama (%)
Place of birth for the foreign-born population - Other Central America (%)
Place of birth for the foreign-born population - Argentina (%)
Place of birth for the foreign-born population - Bolivia (%)
Place of birth for the foreign-born population - Brazil (%)
Place of birth for the foreign-born population - Chile (%)
Place of birth for the foreign-born population - Colombia (%)
Place of birth for the foreign-born population - Ecuador (%)
Place of birth for the foreign-born population - Guyana (%)
Place of birth for the foreign-born population - Peru (%)
Place of birth for the foreign-born population - Uruguay (%)
Place of birth for the foreign-born population - Venezuela (%)
Place of birth for the foreign-born population - Other South America (%)
Place of birth for the foreign-born population - Canada (%)
Place of birth for the foreign-born population - Other Northern America (%)
Place of birth for the foreign-born population - Other (%)
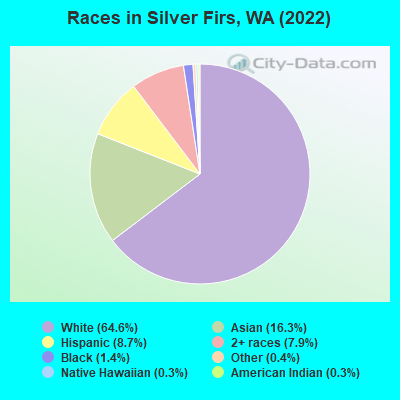
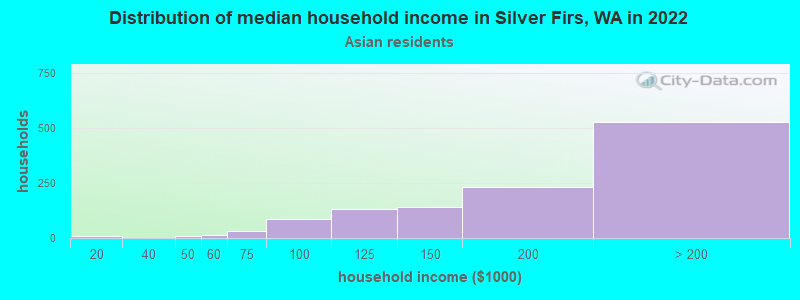
According to 2022 data, the most numerous races in Silver Firs, WA are White alone (14,565 residents), Hispanic (1,970 residents), and Asian alone (3,672 residents). 77.6% of Silver Firs residents speak English at home.
Race distribution in Silver Firs 14,565 64.6% White alone 3,672 16.3% Asian alone 1,970 8.7% Hispanic 1,773 7.9% Two or more races 313 1.4% Black alone 96 0.4% Other race alone 69 0.3% American Indian alone 70 0.3% Native Hawaiian and Other
2000 2022
4,652,490 78.9% White alone 441,509 7.5% Hispanic 319,401 5.4% Asian alone 184,631 3.1% Black alone 175,926 3.0% Two or more races 85,396 1.4% American Indian alone 22,779 0.4% Native Hawaiian and Other 11,989 0.2% Other race alone
4,941,456 63.5% White alone 1,093,313 14.0% Hispanic 755,832 9.7% Asian alone 523,448 6.7% Two or more races 299,537 3.8% Black alone 69,024 0.9% American Indian alone 52,231 0.7% Native Hawaiian and Other 50,945 0.7% Other race alone
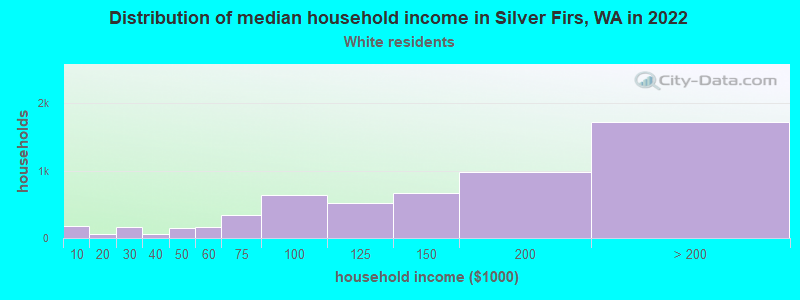
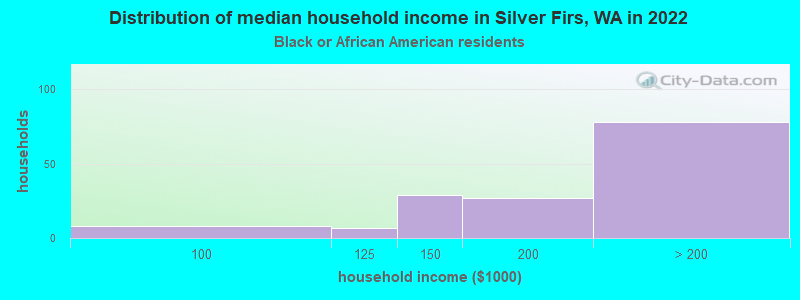
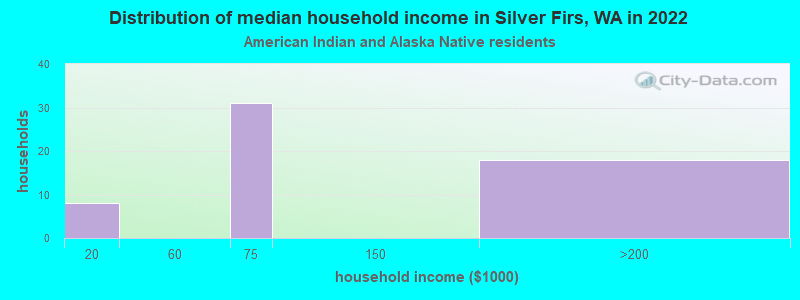
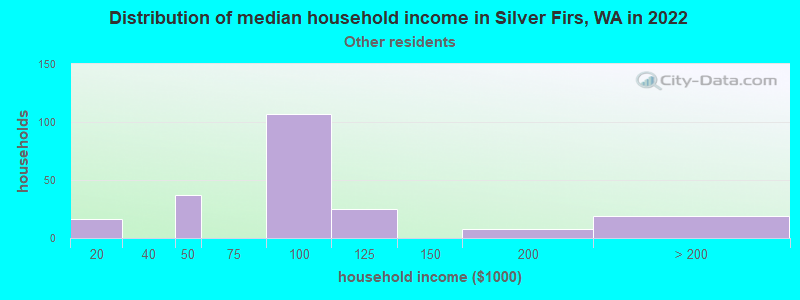
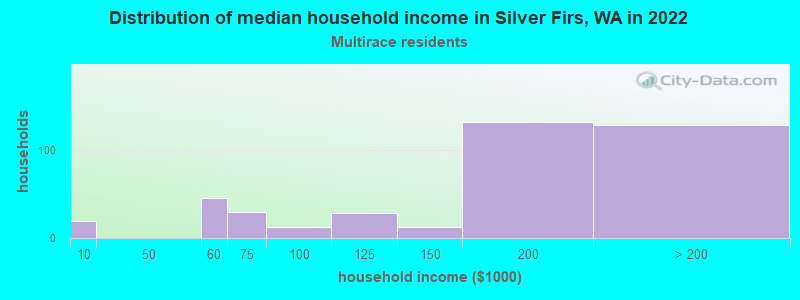
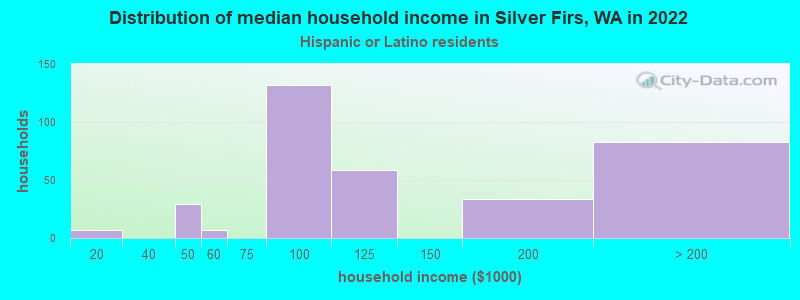
Income and house value in Silver Firs Median household income in 2022 $139,734 White non-Hispanic householdersover $200,000 Black householders$162,723 Asian householders$89,918 Some other race householders$164,158 Two or more races householders$105,561 Hispanic or Latino race householders
Median age by race in Silver Firs
40.7 Median age for White residents41.3 40.0 36.6 Median age for Black or African American residents38.3 37.6 52.4 Median age for American Indian / Alaska Native residents62.1 30.9 36.4 Median age for Asian residents36.6 36.3 -677,839,850.3 Median age for Native Hawaiian / Pacific Islander residents-661,202,185.1 -844,317,095.6 35.7 Median age for Other race residents26.9 40.0 18.3 Median age for Two or more races residents16.8 29.7 41.5 Median age for White alone residents41.1 42.1 23.1 Median age for Hispanic or Latino residents23.3 18.9
Owner/renter occupied households by race in Silver Firs
House owners and renters - White residents 4,949 89.1% Owner occupied605 10.9% Renter occupiedHouse owners and renters - Black or African American residents 100 90.1% Owner occupied11 9.9% Renter occupiedHouse owners and renters - American Indian / Alaska Native residents 36 57.1% Owner occupied27 42.9% Renter occupiedHouse owners and renters - Asian residents 1,237 98.2% Owner occupied23 1.8% Renter occupiedHouse owners and renters - Other race residents 212 100.0% Owner occupiedHouse owners and renters - Two or more races residents 315 72.9% Owner occupied117 27.1% Renter occupiedHouse owners and renters - White alone residents 4,869 89.1% Owner occupied594 10.9% Renter occupiedHouse owners and renters - Hispanic or Latino residents 326 91.1% Owner occupied32 8.9% Renter occupied
Language usage in Silver Firs
English speakers - Total 77.6% of residents of Silver Firs speak English at home.
5.2% of residents speak Spanish at home 666 61.0% Speak English very well425 39.0% Speak English less than very well17.3% of residents speak other language at home 2,249 61.9% Speak English very well1,386 38.1% Speak English less than very well
English speakers - Born in the United States 93.2% of residents of Silver Firs speak English at home.
2.7% of residents speak Spanish at home 194 100.0% Speak English very well3.9% of residents speak other language at home 219 79.6% Speak English very well56 20.4% Speak English less than very well
English speakers - Native, born elsewhere 88.8% of residents of Silver Firs speak English at home.
4.4% of residents speak Spanish at home 14 100.0% Speak English very well6.2% of residents speak other language at home 15 75.0% Speak English very well5 25.0% Speak English less than very well
English speakers - Foreign-born 24.3% of residents of Silver Firs speak English at home.
8.8% of residents speak Spanish at home 30 8.3% Speak English very well330 91.7% Speak English less than very well67.9% of residents speak other language at home 1,667 60.3% Speak English very well1,098 39.7% Speak English less than very well
White (Caucasian) - Speak only English Native:
94.9% (12,874)Foreign-born:
27.5% (237)
White (Caucasian) - Speak another language Native:
4.8% (654)Foreign-born:
72.3% (624)
Black or African American - Speak only English Native:
98.3% (188)Foreign-born:
81.6% (96)
Black or African American - Speak another language Native:
12.1% (23)Foreign-born:
47.3% (56)
American Indian / Alaska Native - Speak another language Native:
64.5% (83)Foreign-born:
100.0% (57)
Asian - Speak only English Native:
54.6% (470)Foreign-born:
18.1% (447)
Asian - Speak another language Native:
45.4% (391)Foreign-born:
82.6% (2,040)
Other race - Speak only English Native:
44.9% (203)Foreign-born:
21.8% (73)
Other race - Speak another language Native:
53.5% (242)Foreign-born:
82.3% (275)
Two or more races - Speak only English Native:
94.4% (1,468)Foreign-born:
84.5% (164)
Two or more races - Speak another language Native:
6.1% (95)Foreign-born:
29.4% (57)
White alone - Speak only English Native:
96.7% (12,542)Foreign-born:
27.4% (239)
White alone - Speak another language Native:
3.3% (429)Foreign-born:
73.0% (638)
Hispanic or Latino - Speak only English Native:
53.9% (744)Foreign-born:
30.7% (159)
Hispanic or Latino - Speak another language Native:
44.7% (617)Foreign-born:
71.0% (367)
Foreign-born residents in Silver Firs
Marital status for residents in Silver Firs Marital status - White (Caucasian) population 15 years and over
Males 31.4% Never married59.6% Now married0.5% Separated0.8% Widowed7.7% DivorcedFemales 26.4% Never married61.8% Now married2.1% Separated3.2% Widowed6.4% DivorcedWomen who gave birth in the past 12 months Now married:
99.3% (141)Unmarried:
0.7% (1)
Women who did not give birth in the past 12 months Now married:
53.9% (1,865)Unmarried:
46.1% (1,597)
Marital status - Black or African American population 15 years and over
Males 28.0% Never married65.0% Now married0.0% Separated7.0% Widowed0.0% DivorcedFemales 28.3% Never married45.3% Now married0.0% Separated0.0% Widowed26.4% DivorcedWomen who did not give birth in the past 12 months Now married:
45.3% (27)Unmarried:
54.7% (33)
Marital status - American Indian / Alaska Native population 15 years and over
Males 33.3% Never married66.7% Now married0.0% Separated0.0% Widowed0.0% DivorcedFemales 27.1% Never married48.2% Now married0.0% Separated0.0% Widowed24.7% DivorcedWomen who did not give birth in the past 12 months Now married:
47.7% (30)Unmarried:
52.3% (33)
Marital status - Asian population 15 years and over
Males 16.5% Never married83.5% Now married0.0% Separated0.0% Widowed0.0% DivorcedFemales 12.8% Never married74.7% Now married0.0% Separated5.4% Widowed7.2% DivorcedWomen who gave birth in the past 12 months Now married:
100.0% (78)Unmarried:
0.0% (0)
Women who did not give birth in the past 12 months Now married:
77.2% (781)Unmarried:
22.8% (231)
Marital status - Other race population 15 years and over
Males 68.0% Never married27.9% Now married0.0% Separated0.0% Widowed4.0% DivorcedFemales 26.2% Never married44.8% Now married0.0% Separated8.6% Widowed20.4% DivorcedWomen who did not give birth in the past 12 months Now married:
60.0% (140)Unmarried:
40.0% (93)
Marital status - Two or more races population 15 years and over
Males 57.5% Never married37.5% Now married0.0% Separated0.0% Widowed5.0% DivorcedFemales 22.0% Never married54.4% Now married2.1% Separated0.0% Widowed21.5% DivorcedWomen who gave birth in the past 12 months Now married:
100.0% (52)Unmarried:
0.0% (0)
Women who did not give birth in the past 12 months Now married:
65.9% (167)Unmarried:
34.1% (86)
Marital status - White alone, not Hispanic / Latino population 15 years and over
Males 30.7% Never married59.9% Now married0.5% Separated0.8% Widowed8.1% DivorcedFemales 26.7% Never married61.8% Now married2.2% Separated3.3% Widowed6.0% DivorcedWomen who gave birth in the past 12 months Now married:
99.3% (144)Unmarried:
0.7% (1)
Women who did not give birth in the past 12 months Now married:
53.7% (1,798)Unmarried:
46.3% (1,551)
Marital status - Hispanic or Latino population 15 years and over
Males 54.9% Never married45.1% Now married0.0% Separated0.0% Widowed0.0% DivorcedFemales 23.8% Never married43.5% Now married0.0% Separated1.6% Widowed31.1% DivorcedWomen who did not give birth in the past 12 months Now married:
55.3% (225)Unmarried:
44.7% (182)
Ancestries in Silver Firs
840 8.0% English708 6.7% Irish626 6.0% American591 5.6% German466 4.4% European349 3.3% Norwegian223 2.1% Scottish200 1.9% Danish171 1.6% Iraqi166 1.6% Italian155 1.5% Canadian142 1.4% Egyptian135 1.3% Armenian112 1.1% Swedish107 1.0% French101 1.0% Polish93 0.9% Scandinavian75 0.7% Eastern European74 0.7% Iranian73 0.7% British59 0.6% Romanian55 0.5% Nigerian52 0.5% Dutch35 0.3% Jamaican31 0.3% African27 0.3% Ethiopian26 0.2% Swiss25 0.2% Portuguese25 0.2% Russian25 0.2% South African20 0.2% Moroccan20 0.2% Ukrainian18 0.2% Czech17 0.2% Brazilian16 0.2% Senegalese15 0.1% Hungarian14 0.1% French Canadian13 0.1% Turkish12 0.1% Northern European11 0.1% Syrian10 0.10% Estonian9 0.09% Austrian8 0.08% Greek
Geographical mobility in Silver Firs Same house 1 year ago 14,179 94.1% White (Caucasian)254 81.1% Black or African American151 85.9% American Indian / Alaska Native2,917 81.6% Asian52 100.0% Native Hawaiian / Pacific Islander844 100.0% Other race1,947 93.4% Two or more races13,695 94.5% White alone, not Hispanic / Latino1,907 96.1% Hispanic or LatinoMoved within same county 362 2.4% White / Caucasian20 11.4% American Indian / Alaska Native147 4.1% Asian119 5.7% Two or more races370 2.6% White alone, not Hispanic / Latino13 0.7% Hispanic or LatinoMoved within same state 379 2.5% White / Caucasian11 3.5% Black or African American223 6.2% Asian10 1.2% Other race12 0.6% Two or more races335 2.3% White alone, not Hispanic / Latino64 3.2% Hispanic or LatinoMoved from different state 193 1.3% White / Caucasian33 10.5% Black or African American129 3.6% Asian120 0.8% White alone, not Hispanic / Latino47 2.4% Hispanic or LatinoMoved from abroad 32 0.2% White64 1.8% Asian13 1.6% Other race8 0.4% Two or more races33 0.2% White alone, not Hispanic / Latino
Children Nativity (place of birth) in Silver Firs
Children under 6 years - Living with two parents Both parents native 997 98.6% Native15 1.4% Foreign-bornBoth parents foreign-born 466 100.0% NativeOne native, one foreign-born parent 326 100.0% NativeChildren under 6 years - Living with one parent Native parent 123 100.0% NativeChildren 6 to 17 years - Living with two parents Both parents native 1,896 100.0% NativeBoth parents foreign-born 449 75.8% Native143 24.2% Foreign-bornOne native, one foreign-born parent 530 100.0% NativeChildren 6 to 17 years - Living with one parent Native parent 499 94.7% Native28 5.3% Foreign-bornForeign-born parent 133 73.3% Native49 26.7% Foreign-born
Grandparents responsible for own grandchildren in Silver Firs
Grandparents (30 to 59 years) White / Caucasian 9 28.1% Responsible for grandchildren22 71.9% Not responsible for grandchildrenAsian 33 100.0% Not responsible for grandchildrenWhite alone, not Hispanic / Latino 9 100.0% Responsible for grandchildrenHispanic or Latino 16 100.0% Not responsible for grandchildren
Grandparents (60 years and over) White / Caucasian 27 100.0% Not responsible for grandchildrenAsian 107 100.0% Not responsible for grandchildrenWhite alone, not Hispanic / Latino 28 100.0% Not responsible for grandchildren